. 2021 Jan 19;34(3):108655.
doi: 10.1016/j.celrep.2020.108655.

Trophectoderm mechanics direct epiblast shape upon embryo implantation

Affiliations

Trophectoderm mechanics direct epiblast shape upon embryo implantation

Antonia Weberling et al. Cell Rep. .

Abstract

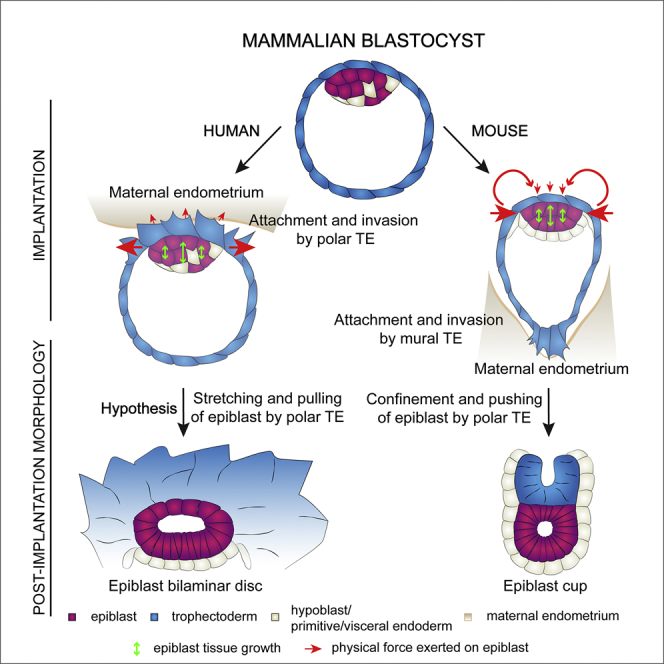
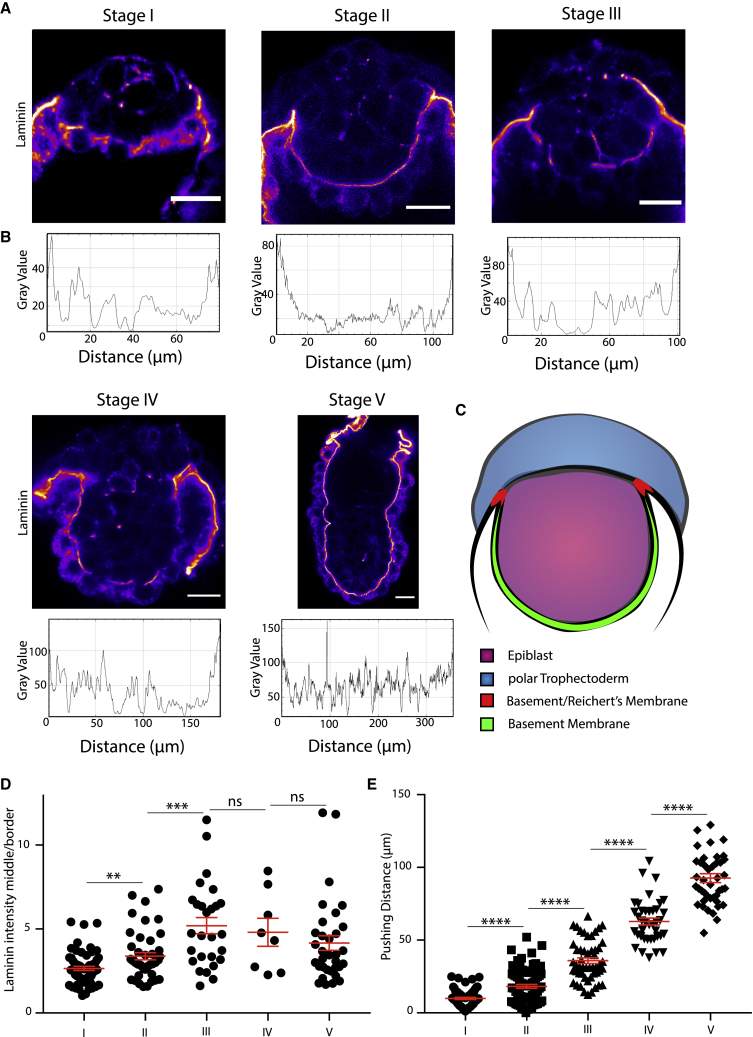
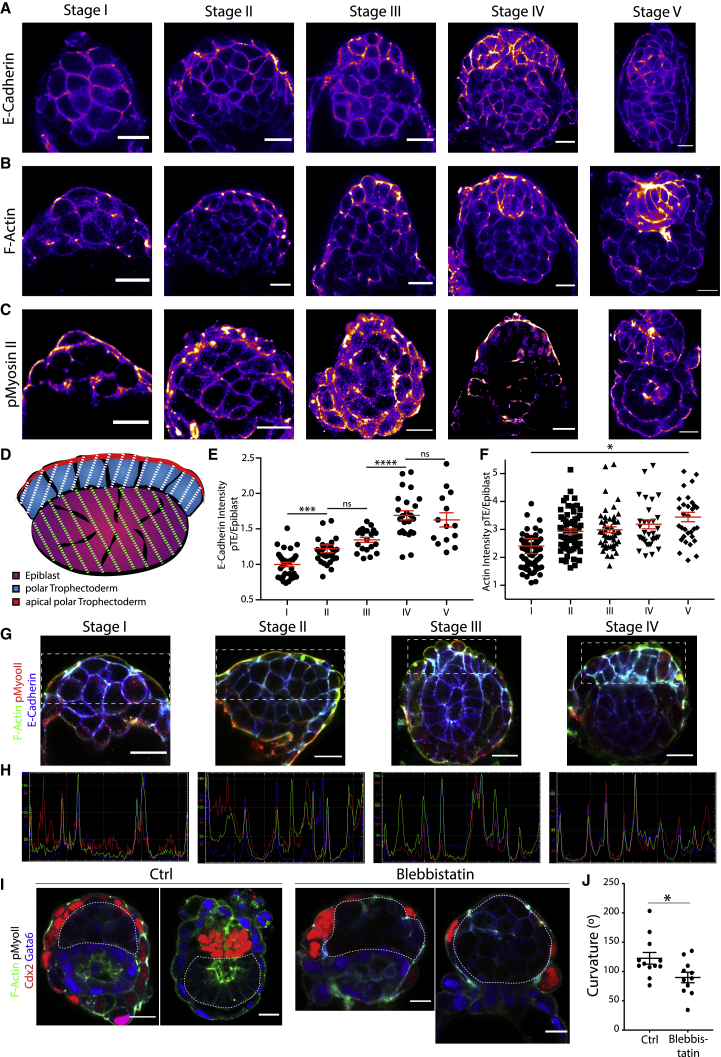
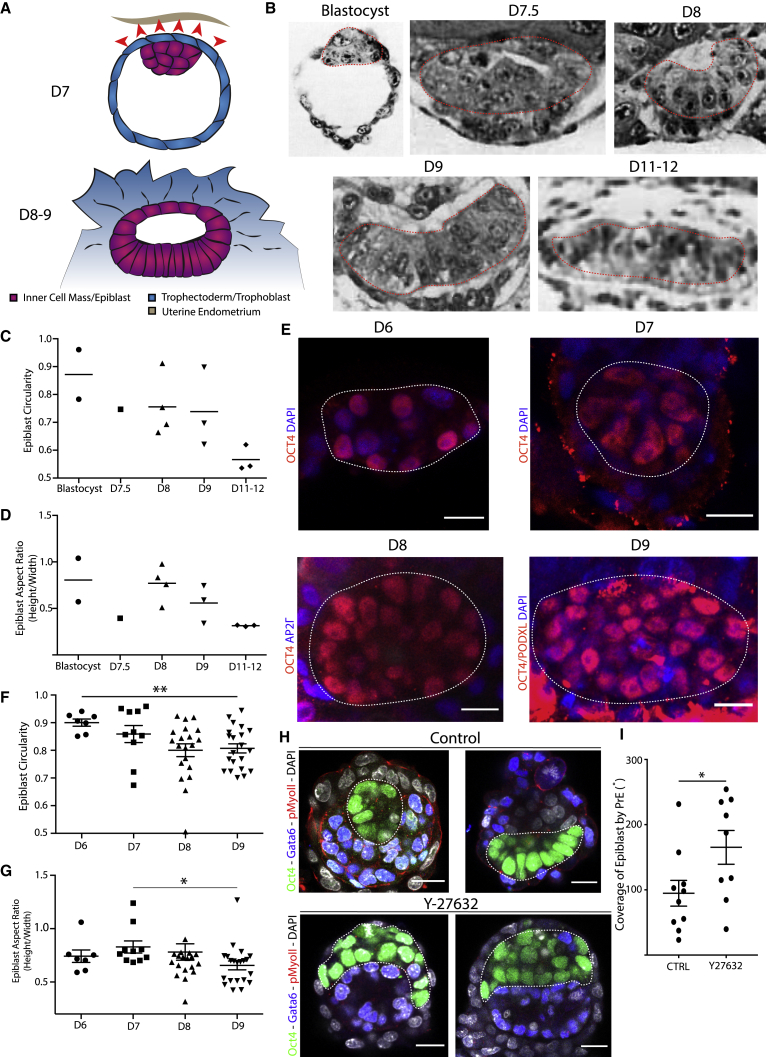
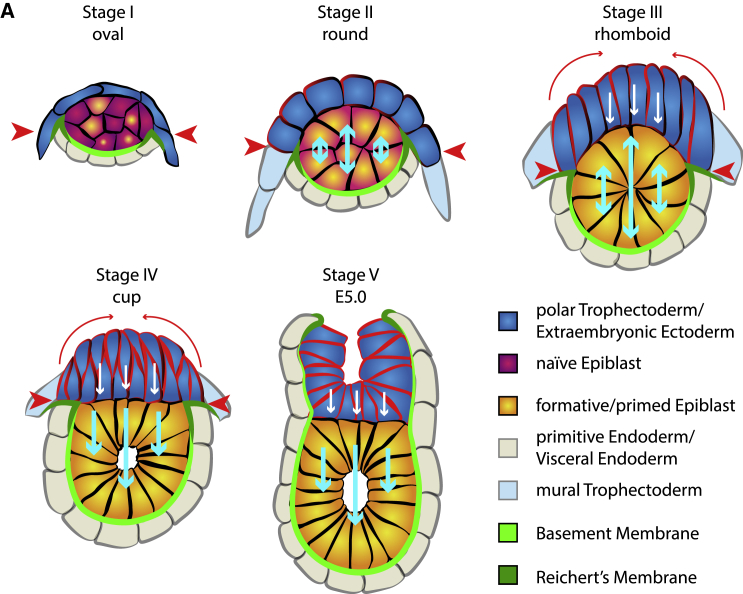
Implantation is a hallmark of mammalian embryogenesis during which embryos establish their contacts with the maternal endometrium, remodel, and undertake growth and differentiation. The mechanisms and sequence of events through which embryos change their shape during this transition are largely unexplored. Here, we show that the first extraembryonic lineage, the polar trophectoderm, is the key regulator for remodeling the embryonic epiblast. Loss of its function after immuno-surgery or inhibitor treatments prevents the epiblast shape transitions. In the mouse, the polar trophectoderm exerts physical force upon the epiblast, causing it to transform from an oval into a cup shape. In human embryos, the polar trophectoderm behaves in the opposite manner, exerting a stretching force. By mimicking this stretching behavior in mouse embryogenesis, we could direct the epiblast to adopt the disc-like shape characteristic of human embryos at this stage. Thus, the polar trophectoderm acts as a conserved regulator of epiblast shape.

Keywords: epiblast; morphogenesis; mouse/human implantation; tissue remodeling; trophectoderm.


Conflict of interest statement

Declaration of interests The authors declare no competing interests.

Figures

None
Graphical abstract
Figure 1
Figure 1
Sequence of remodeling steps of epiblast and polar trophectoderm tissues upon implantation (A) E4.5 implanting blastocyst and E5.0 early egg cylinder. Staining: DAPI (blue), F-actin (green), and Oct4 (red). Oct4 is expressed in the epiblast tissue. Zoom-in on the epiblast tissue highlights shapes of the epiblast upon implantation (oval) and post-implantation (cup). (B) Schematic of the epiblast (pink) and polar TE (blue) lineages from implantation to egg-cylinder formation. (C) Lineage staining of embryos fixed at sequential time points from implantation to egg-cylinder formation (E4.5–5.0). Top row: embryos stained for Gata6 (white) and Cdx2 (blue) to distinguish primitive endoderm and polar TE lineages, respectively. Staining: DAPI (red) and F-actin (green). This allows analysis of epiblast and polar TE tissue shapes. Bottom row: zoom-in on epiblast and polar TE lineages, with polar TE highlighted in blue and the epiblast in red. (D) Schematic to illustrate measurements taken for quantitative analysis. Polar TE is indicated in blue, and epiblast is indicated in pink. Measurements were taken in plane of maximum tissue area for both lineages. Epiblast height (white) and width (green) were measured through the center of the epiblast. Epiblast area (green dotted line) was measured for the maximum area. Polar TE height (red) was measured at three points, and the average for each embryo was analyzed. (E) Quantification of epiblast height (in microns) over time. Scatterplot, mean ± SEM. The epiblast height changes significantly over time. Stage I, n = 69; stage II, n = 81; stage III, n = 51; stage IV, n = 40; stage V, n = 43. Analysis, unpaired Student’s t test: stages I–II, p < 0.0001; II–III, p = 0.0020; III–IV, p = 0.3530; IV–V, p = 0.0059. (F) Quantification of epiblast width over time. Scatterplot, mean ± SEM. Epiblast width increases slightly. Stage I, n = 68; stage II, n = 81; stage III, n = 51; stage IV, n = 40; stage V, n = 43. Analysis, unpaired Student’s t test: stages I–II, p = 0.6192; II–III, p = 0.1559; III–IV, p = 0.1523; IV–V, p = 0.2277; I–V, p < 0.0001. (G) Quantification of epiblast area over time. Scatterplot, mean ± SEM. Area increases significantly over time. Stage I, n = 69; stage II, n = 81; stage III, n = 51; stage IV, n = 40; stage V, n = 44. Analysis, unpaired Student’s t test: stages I–II, p < 0.0001; II–III, p < 0.0001; III–IV, p = 0.0005; IV–V, p = 0.4385. (H) Quantification of polar TE height over time. Scatterplot, mean ± SEM. Height of polar TE increases exponentially over time. Stage I, n = 69; stage II, n = 82; stage III, n = 51; stage IV, n = 40; stage V, n = 44. Analysis, unpaired Student’s t test: stages I–II, p < 0.0001; II–III, p < 0.0001; III–IV, p < 0.0001; IV–V, p < 0.0001. Scale bars, 20 μm. (I) Analysis of epiblast and polar TE cell numbers over time. Stages I: black, II: red, III: yellow, IV: blue, V: green. The growth in cell numbers is highly correlated; Pearson r = 0.8884, p < 0.0001. Stage I, n = 62; stage II, n = 51; stage III, n = 16; stage IV, n = 17; stage V, n = 28.
Figure 2
Figure 2
The dynamics of the tissue interface suggest force transmission of the polar trophectoderm toward the epiblast (A) Lineage staining of embryos fixed at consecutive time points from implantation to egg-cylinder formation. Staining: DAPI (blue), Gata6 (white), Cdx2 (blue), and F-actin (green). Tissue interface between epiblast and polar TE defined through F-actin (white dotted line). (B) Schematic of quantifications carried out. Polar TE (blue) and epiblast (pink). Interface was analyzed for the following parameters: total length of interface (green dotted line), interface diameter (blue), and total curvature angle (white). (C) Quantitative analysis of tissue interface length over time. Scatterplot, mean ± SEM. Interface length increased and then dropped significantly. Stage I, n = 68; stage II, n = 81; stage III, n = 51; stage IV, n = 40; stage V, n = 44. Analysis, unpaired Student’s t test: stages I–II, p < 0.0001; II–III, p = 0.0081; III–IV, p < 0.0001; IV–V, p = 0.5749. (D) Quantitative analysis of diameter of tissue interface over time. Scatterplot, mean ± SEM. Diameter increased and then decreased to a steady state. Stage I, n = 68; stage II, n = 81; stage III, n = 51; stage IV, n = 40; stage V, n = 44. Analysis, unpaired Student’s t test: stages I–II, p < 0.0001; II–III, p = 0.0014; III–IV, p < 0.0001; IV–V, p = 0.4693. (E) Quantitative analysis of the total curvature of interface. Scatterplot, mean ± SEM. Curvature first dropped to then vastly increase going against 180°. Stage I, n = 68; stage II, n = 81; stage III, n = 51; stage IV, n = 40; stage V, n = 44. Analysis, unpaired Student’s t test: stages I–II, p = 0.0152; II–III, p = 0.5655, III–IV, p < 0.0001, IV–V, p = 0.0136. (F) Quantitative analysis of the relative interface (total length/diameter) over time. Scatterplot, mean ± SEM. Relative interface first increased from ∼1.4 to ∼1.45 to then go against 1. The ns are the same as in (C). Analysis, unpaired Student’s t test: stages I–II, p = 0.0229; II–III, p = 0.7226; III–IV, p < 0.0001; IV–V, p = 0.0005. (G) Quantitative analysis of epiblast coverage by the polar TE (total perimeter/length of interface) over time. Scatterplot, mean ± SEM. EPIBLAST was covered up to 50% by polar TE; this decreased to about 25% after cup formation. Stage I, n = 68; stage II, n = 81; stage III, n = 51; stage IV, n = 40; stage V, n = 44. Analysis, unpaired Student’s t test: stages I–II, p = 0.1128; II–III, p < 0.0001; III–IV, p < 0.0001; IV–V: p = 0.6305. (H) Staining of exit from naive pluripotency over time. Nanog (red) expressed only at stage I, and primed pluripotency marker, Otx2 (blue), from stage I onward and then steadily upregulated. F-actin (green) allows staging of the embryos. (I) Quantitative analysis of expression dynamics of Nanog and Otx2. Mean gray value measured at 3 different z-positions per embryo. Mean of the ratio Nanog/Otx2 plotted. Nanog expression was lost already during stage I. Stage Ia, n = 21; stage Ib, n = 18; stage II, n = 14; stage III, n = 13; stage IV, n = 3. Scatterplot, mean ± SEM. Analysis, unpaired Student’s t test: stages Ia–Ib, p < 0.0001; Ib–II, p = 0.0015; II–III, p = 0.1120; III–IV, p = 0.7389.
Figure 3
Figure 3
The polar trophectoderm induces cup-shape formation of the epiblast (A) Correlation analysis of polar TE aspect ratio (total height/length of interface) with curvature. Stages II–V had a strong positive correlation. Stage I, n = 68; stage II, n = 81; stage III n = 51; stage IV, n = 40; stage V = 44. Analysis: r = 0.7414, p < 0.0001. Black, stage I; red, stage II; yellow, stage III; blue, stage IV; green, stage V. (B) Correlation analysis of polar TE aspect ratio with the length of the tissue interface. Strong anti-correlation of stages II–V. Stage I, n = 68; stage II, n = 81; stage III, n = 51; stage IV, n = 40; stage V, n = 44. Analysis: r = −0.7572, p < 0.0001. (C) Staining of E4.5 embryo cultured for 48 h in hanging drops after immuno-surgery (left and middle columns) and control (right column). Embryos stained for DAPI (red), F-actin (green), and HNF4alpha (blue, top row); Otx2 in the bottom row. (D) Quantification of the circularity of the epiblast after immuno-surgery and hanging drop culture. For treated embryos (IS), only those were analyzed where the full TE tissue could be removed. For controls (Ctrl), only embryos that retained all three lineages were considered. Treated, n = 6; control, n = 4. Scatterplot, mean ± SEM. (E) Mouse embryonic stem cells (mESCs) were cultured for 48 h in 3D Matrigel in differentiating conditions. Structures stained for DAPI (red), F-actin (green), and Otx2 (white). (F) Quantitative analysis of the circularity of mESC structures. n = 40. Scatterplot, mean ± SEM. Structures were collected from 4 independent experiments. (G) Model for the hypothetical forces required to regulate EPIBLAST cup-shape acquisition. Blue, polar TE; magenta-purple, epiblast. Scale bars, 20 μm.
Figure 4
Figure 4
The ECM shows a clear distribution upon implantation (A) Expression of laminin upon implantation from stages I–V. Fire staining represents intensity of signal, with purple indicating low intensity and yellow indicating high intensity. (B) Intensity profiles of laminin signal from (A). BM was traced by spline fit; line width, 5 μm. (C) Schematic for intensity quantification of laminin expression. Mean gray value of BM (green) was determined through tracing by spline fit, with a line width of 5 μm. Mean gray value of the border between the BM and Reichert’s membrane (red) was determined. (D) Quantitative analysis of laminin intensity ratio BM versus mean of the border between Reichert’s membrane and the BM for each embryo. Intensity ratio increases significantly up to stage III and then remains constant. Scatterplot, mean ± SEM. Stage I, n = 59; stage II, n = 46; stage III, n = 27; stage IV, n = 8; stage V, n = 33. Analysis, unpaired Student’s t test: stages I–II, p = 0.0023; II–III, p = 0.0002; III–IV, p = 0.6952; IV–V, p = 0.5181. (E) Quantification of the pushing distance of the epiblast distal tip toward blastocoelic cavity. Epiblast pushed down continuously with a high significance. Mean ± SEM. Stage I, n = 65; stage II, n = 81; stage III, n = 51; stage IV, n = 39; stage V, n = 43. Analysis, unpaired Student’s t test: stages I–II, p < 0.0001; II–III, p < 0.0001; III–IV, p < 0.0001; IV–V, p < 0.0001. Scale bars, 20 μm.
Figure 5
Figure 5
Differential expression of E-cadherin and F-actin in polar trophectoderm and epiblast (A) E-cadherin staining of embryos fixed upon implantation up to egg-cylinder formation. Fire staining represents intensity of signal, with purple indicating lowly expressed and yellow indicating highly expressed. (B) F-actin staining of embryos fixed at consecutive stages from implantation to egg-cylinder formation; intensity is represented through fire staining, as in (A). A clear increase in the actin intensity from stage I to stage V is visible in the polar TE. (C) pMyosin-II staining of embryos from implantation to egg-cylinder formation. Intensity is represented through fire staining, as in (A). pMyosin-II exhibits similar staining pattern as F-actin. (D) Schematic illustration of the intensity measurements on tissue level (epiblast is indicated in magenta-purple, and green stripes indicate the area of tissue intensity measurement; polar TE is indicated in blue, and white stripes indicate the area of tissue intensity measurement) and level at which plot profiles were taken (red). (E) Quantitative analysis of the E-cadherin intensity ratio. For each embryo, the mean gray value of both tissues was determined at 3 different z positions. The mean of the ratio polar TE/epiblast was plotted. As clearly visible, the polar TE intensity increased significantly over time. Scatterplot, mean ± SEM. Stage I, n = 35; stage II, n = 30; stage III, n = 19; stage IV, n = 24; stage V, n = 14. Analysis, unpaired Student’s t test: stages I–II, p = 0.0007; II–III, p = 0.0949; II–IV, p < 0.0001; IV–V, p = 0.5729. (F) Quantitative analysis of the relative F-actin intensity (polar TE/epiblast) over time averaged for each embryo from measurements of the mean gray value of both tissues at 3 different stages. Scatterplot of average values with mean ± SEM. Relative actin intensity clearly increased over time. Stage I, n = 63; stage II, n = 65; stage III, n = 48; stage IV, n = 33; stage V, n = 32. Analysis, unpaired Student’s t test: stages I–V, p = 0.0100. (G) Expression analysis of F-actin (green), pMyosin-II (red), and E-cadherin (blue) in the polar TE from stage I to stage III. White rectangles in the full figures illustrate the zoom-in region. (H) Merged plot profiles of the apical surface of the polar TE in (G). A spline fit line was drawn with a thickness of 5 μm. Plot profile was determined through Fiji. Staining: F-actin (green), pMyosin-II (red), and E-cadherin (blue). It is visible that, from stages I–IV, the peaks of each marker begin to overlay. (I) Representative immunofluorescent (IF) stainings of E4.5 embryos cultured for 20 h in hanging-drop culture supplemented with 100 μM Blebbistatin or DMSO in controls. Embryos were stained for F-actin (green), pMyosin-II (white), Cdx2 (red), and Gata6 (blue); the experiment was carried out 4 times. The shape of the EPIBLAST was annotated through a white dotted line. (J) Quantitative analysis of the total curvature angle of the tissue interface epiblast/polar TE in treated embryos versus controls. Control, n = 12; treated, n = 11. Analysis, unpaired Student’s t test: p = 0.0249; treated and control embryos differ significantly. Scale bars, 20 μm.
Figure 6
Figure 6
Human epiblasts are not constricted horizontally upon implantation (A) Schematic drawing of a human blastocyst upon implantation at embryonic day (D)7. Implantation into the maternal endometrium (beige) mediated by the polar TE (blue), overlying the epiblast/inner cell mass (magenta-purple). The implantation results in differentiation and invasion of the trophectoderm/ trophoblast, which is hypothesized to exhibit stretching and pulling forces on the epiblast (red arrows). After implantation, the epiblast acquires a bilaminar disc-like structure forming a flat oval (D8–9). (B) Analysis of epiblast shapes of embryos from the Carnegie Collection. EPIBLAST is indicated with a red dashed line. Blastocyst: Carnegie embryo 8663; D7.5: Carnegie embryo 8020; D8: Carnegie embryo 8155; D9: Carnegie embryo 8004; D11–12: Carnegie embryo 7700. (C) Quantitative analysis of epiblast circularity of Carnegie embryos from blastocyst to D11–12. Scatterplot and mean. (D) Quantitative analysis of epiblast aspect ratio (height versus width) of Carnegie embryos from blastocyst stage to D11–12. Scatterplot and mean. (E) IF staining of in vitro cultured embryos from D6 to D9. Red indicates OCT4 (D6–8) and OCT4 + PODXL (D9); blue indicates DAPI (D6–7 and D9) and AP2Γ (D8). Scale bars, 20 μm. (F) Quantitative analysis of the circularity of in vitro cultured embryos from D6 to D9. The circularity continuously decreases as the epiblast becomes more oval shaped. Scatterplot, mean ± SEM. Analysis, unpaired Student’s t test: D6–D9, p = 0.0042. D6, n = 7; D7, n = 10; D8, n = 20; D9, n = 21. (G) Quantitative analysis of epiblast aspect ratio (height/width) of in vitro cultured embryos from (F). Aspect ratio decreases significantly upon implantation. D7–D9, p = 0.0219. (H) Y27632 treatment of mouse embryos in attachment culture for 20 h. Treated embryos were cultured in 100 μM Y27632, and controls were cultured in DMSO. Embryos stained for Oct4 (green), Gata6 (blue), pMyosin-II (red), and DAPI (gray). Experiment was carried out 3 times. Dashed white line encircles epiblast lineage. (I) Analysis of epiblast coverage angle by the primitive endoderm in Y27632-treated embryos versus controls. The controls are significantly more highly covered than the treated embryos, in which the coverage angle in several cases inverted with epiblast spreading over the primitive endoderm instead. Analysis, unpaired Student’s t test: p = 0.0425. Controls, n = 10; treated, n = 9.
Figure 7
Figure 7
Model of epiblast remodeling at implantation Upon implantation, stage I, the oval-shaped naive epiblast (magenta-purple) exits from naive pluripotency toward the primed state (yellow-orange) and increases in area. A thick layer of Reichert’s membrane constricts horizontal growth (red arrowheads), leading to the epiblast to only grow vertically (light blue arrows) to adopt a circular shape at stage II. At the same time, the polar TE (dark blue) began to increase in height due to a tissue boundary developed toward the mural trophectoderm (light blue) and begins to exhibit increased levels of tension and contractility (red cell membranes). Continuous growth of the epiblast in addition to constrictive force of Reichert’s membrane lead to the acquisition of a rhomboid shape (stage III). Then, the polar TE begins to constrict apically (long red arrows), exerting force toward the epiblast, transforming the concave surface to a flat disk, which leads the epiblast to become a cup only able to grow toward the proximal side. Further apical constriction of the polar TE results in formation of the egg cylinder (stage V).

References

    1. Acampora D., Omodei D., Petrosino G., Garofalo A., Savarese M., Nigro V., Di Giovannantonio L.G., Mercadante V., Simeone A. Loss of the Otx2-Binding Site in the Nanog Promoter Affects the Integrity of Embryonic Stem Cell Subtypes and Specification of Inner Cell Mass-Derived Epiblast. Cell Rep. 2016;15:2651–2664. - PubMed
    1. Bedzhov I., Zernicka-Goetz M. Self-organizing properties of mouse pluripotent cells initiate morphogenesis upon implantation. Cell. 2014;156:1032–1044. - PMC - PubMed
    1. Begnaud S., Chen T., Delacour D., Mège R.-M., Ladoux B. Mechanics of epithelial tissues during gap closure. Curr. Opin. Cell Biol. 2016;42:52–62. - PMC - PubMed
    1. Buckley C.D., Tan J., Anderson K.L., Hanein D., Volkmann N., Weis W.I., Nelson W.J., Dunn A.R. The minimal cadherin-catenin complex binds to actin filaments under force. Science. 2014;346:1254211. - PMC - PubMed
    1. Cartagena-Rivera A.X., Logue J.S., Waterman C.M., Chadwick R.S. Actomyosin Cortical Mechanical Properties in Nonadherent Cells Determined by Atomic Force Microscopy. Biophys. J. 2016;110:2528–2539. - PMC - PubMed

Publication types

LinkOut - more resources