. 2021 Jan 19;34(3):108645.
doi: 10.1016/j.celrep.2020.108645.

Protective plant immune responses are elicited by bacterial outer membrane vesicles

Affiliations

Protective plant immune responses are elicited by bacterial outer membrane vesicles

Hannah M McMillan et al. Cell Rep. .

Abstract

Bacterial outer membrane vesicles (OMVs) perform a variety of functions in bacterial survival and virulence. In mammalian systems, OMVs activate immune responses and are exploited as vaccines. However, little work has focused on the interactions of OMVs with plant hosts. Here, we report that OMVs from Pseudomonas syringae and P. fluorescens activate plant immune responses that protect against bacterial and oomycete pathogens. OMV-mediated immunomodulatory activity from these species displayed different sensitivity to biochemical stressors, reflecting differences in OMV content. Importantly, OMV-mediated plant responses are distinct from those triggered by conserved bacterial epitopes or effector molecules alone. Our study shows that OMV-induced protective immune responses are independent of the T3SS and protein, but that OMV-mediated seedling growth inhibition largely depends on proteinaceous components. OMVs provide a unique opportunity to understand the interplay between virulence and host response strategies and add a new dimension to consider in host-microbe interactions.

Keywords: OMV; Pseudomonas fluorescens; Pseudomonas syringae; bacterial virulence; extracellular vesicles; oomycetes; plant immune response; plant immunity; secretion.


Conflict of interest statement

Declaration of interests The authors declare no competing interests.

Figures
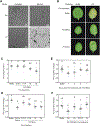
Figure 1.
Figure 1.. OMV pre-treatment protects against bacterial challenge
(A) TEM of OMVs isolated from Pst (top) or Pf (bottom) cultures grown in complete media (left) or shifted to minimal media for 2 h (right). Scale bar: 200 nm. Representatives from at least 15 images (Pst complete: n = 15; Pst minimal: n = 47; Pf complete: n = 26; Pf minimal: n = 35). (B) Leaves infiltrated with either buffer (top) or OMVs from Pst (center) or Pf (bottom) cultures followed by challenge with either buffer (left) or Pst (right). OMVs were collected from minimal media cultures. Representative images from n = 7. (C and D) Pst population size (C) or log fold change (D) in plants pre-treated with either buffer or various concentrations of Pst (C) or Pf (D) OMVs from minimal media cultures. Statistics: ANOVA, Tukey’s honestly significant difference (HSD). (E) Pst log fold change in plants pre-treated with 5× Pst OMVs from minimal media cultures. Leaves were pre-treated 1, 3, 5, or 7 days before challenge with Pst. Statistics: ANOVA, Tukey’s HSD. Each treatment sample was normalized to a paired buffer-treated control. (F) Pst log fold change in plants pre-treated with either buffer or OMVs/MVs from various species. Statistics: ANOVA, Tukey’s HSD. In (B)–(F), plants were pre-treated with OMVs, challenged with Pst 24 h later, and Pst CFU/cm2 was measured after 4 days. In (C)–(F), n = 3 experimental replicates, each with at least 7 plants per treatment condition. Gray scatter points display the value from each plant tested. Horizontal line and error bars indicate means ± SEs; p < 0.05 in all of the statistical tests. Conditions not connected by the same letter are statistically significantly different. See also Figures S1 and S2.
Figure 2.
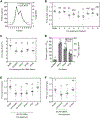
Figure 2.. OMV-mediated protection is OMV-associated, type III secretion-independent, and withstands biochemical disruption
(A) OptiPrep density gradient with Pst OMVs showing distribution of protein and lipid across light (left) to heavy (right) fractions. Protein and lipid traces are representative of 3 experimental replicates. (B) Pst log fold change in plants pre-treated with either buffer or various fractions from the density gradient in (A). Statistics: ANOVA, Tukey’s HSD. (C) Pst log fold change in plants pre-treated with either buffer or 5× Pst OMVs from WT, ΔhrcC, ΔhrpA, or ΔhrpL. Statistics: ANOVA, Tukey’s HSD. (D) OMV production as measured by protein and lipid normalized to culture density. Statistics: repeated-measures ANOVA, Tukey’s HSD; n = 3. (E) Pst log fold change in plants pre-treated with either buffer, 5× Pst OMVs, treated 5× Pst OMVs (sonicated, boiled, or treated with Proteinase K), or Proteinase K alone as a control. ProK: Proteinase K. Statistics: ANOVA, Tukey’s HSD. (F) Pst log fold change in plants pre-treated with either buffer, 5× Pst OMVs, 5× Pst OMVs exposed to a combination (Combo) of treatments, or the combination treatment alone as a control. Statistics: ANOVA, Tukey’s HSD. In (B), (C), (E), and (F), plants were pre-treated with OMVs, challenged with Pst 24 h later, and Pst colony-forming units (CFUs)/cm2 were measured after 4 days. In (B), (C), (E), and (F), n = 3 experimental replicates, each with at least 7 plants per treatment condition. Gray scatter points display the value from each plant tested. Horizontal line and error bars indicate means ± SEs; p < 0.05 in all statistical tests. Conditions not connected by the same letter are statistically significantly different. All OMVs were isolated from cultures grown in complete media and shifted to minimal media for 2 h. See also Figure S3.
Figure 3.
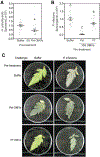
Figure 3.. Pst and Pf OMVs protect against oomycete challenge in multiple plant species
(A) Hyaloperonospora arabidopsidis spore count in samples isolated from A. thaliana seedlings pre-treated with either buffer or 5× Pst OMVs. Statistics: 2-tailed Student’s t test. (B) Phytophthora infestans sporangia count in samples isolated from detached tomato leaves pre-treated with either buffer, 10× Pst OMVs, or 10× Pf OMVs. Statistics: ANOVA, Tukey’s HSD. (C) Tomato leaves pre-treated with buffer (top), Pst OMVs (center), or Pf OMVs (bottom) and challenged with buffer (left) or Phytophthora infestans (right). Representative images from n = 3 experimental replicates, each with 8 leaves per treatment condition. In (A) and (B), n = 3 experimental replicates, each with at least 7 plants per treatment condition. Gray scatter points display the value from each plant tested. Horizontal line and error bars indicate means ± SEs; p < 0.05 in all statistical tests. Asterisk indicates statistical significance. Conditions not connected by the same letter are statistically significantly different. All OMVs were isolated from cultures grown in complete media and shifted to minimal media for 2 h. See also Figure S4.
Figure 4.
Figure 4.. OMV treatment leads to seedling growth inhibition
(A and B) Seedling weight 7 days post-treatment with either buffer or various concentrations of Pst (A) or Pf (B) OMVs. Statistics: ANOVA, Tukey’s HSD. (C) Hormone mutant seedling weight 7 days post-treatment with 5× Pst OMVs. DEPS: dde2–2/ein2–1/pad4–1/sid2–2; DEP: dde2–2/ein2–1/pad4–1; DPS: dde2–2/pad4–1/sid2–2; and EPS: ein2–1/pad4–1/sid2–2. Statistics: ANOVA, Tukey’s HSD. (D) Seedling weight 7 days post-treatment with either buffer or OMVs/MVs from a variety of bacteria. Statistics: ANOVA, Tukey’s HSD. Pst and Pf OMVs were isolated from cultures grown in complete media and shifted to minimal media for 2 h. n = 3 experimental replicates, each with at least 7 plants per treatment condition. Gray scatter points display the value from each plant tested. Horizontal line and error bars indicate means ± SEs; p < 0.05 in all statistical tests. Conditions not connected by the same letter are statistically significantly different. See also Figures S5 and S6.
Figure 5.
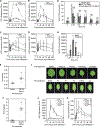
Figure 5.. Bacterial OMVs induce plant ICS1 expression involved in SA biosynthesis
(A–D) ICS1 expression over time from Col-0 ICS1:LUC transgenic plants infiltrated with Pst cells or 5× Pst OMVs (A and B), or Pf cells or 5× Pf OMVs (C and D). Cells and OMVs were isolated from cultures grown in complete media and shifted to either (A and C) complete (mock) or (B and D) minimal (shift) media for 2 h. Statistics: repeated-measures ANOVA, ANOVA subdivided by time point. (E and F) HPLC quantification of (E) salicylic acid (SA) and (F) SA 2-O-β-D-glucose (SAG) metabolites from leaves infiltrated with either a buffer control or 5× Pst OMVs from cultures shifted to minimal media for 2 h. Statistics: 2-tailed Student’s t test. (G and H) MAPK activation over time in response to treatment with flg22, 5× Pst OMVs, or sonicated 5× Pst OMVs (G), or 5× Pf OMVs (H). Statistics: (G) repeated-measures ANOVA, 2-tailed Student’s t test after subdivision by time point; (H) ANOVA, Tukey’s HSD. 5× Pst OMVs treatment: n = 5; sonicated 5× Pst OMVs treatment: n = 3; 5× Pf OMVs treatment: n = 3. (I) Images of infiltrated leaves showing no disease phenotype or water soaking in A. thaliana in association with the infiltration of OMVs/MVs from any of the species tested. Representative images from n = 2, each with 6 leaves per treatment condition. (J) ICS1 expression over time from Col-0 ICS1:LUC transgenic plants infiltrated with OMVs/MVs from various species. Statistics: repeated-measures ANOVA, ANOVA subdivided by time point. (K) Magnified graph from (J) showing differences in ICS1 expression among all OMV/MV treatments except Pst. In (A)–(F) and (J) and (K), n = 3 experimental replicates, each with at least 7 plants per treatment condition. Gray scatter points display the value from each plant tested. Horizontal line and error bars indicate means ± SEs; p < 0.05 in all statistical tests. Asterisks indicate statistical significance. Conditions not connected by the same letter are statistically significantly different. See also Figures S7 and S8.

References

    1. Acevedo R, Fernández S, Zayas C, Acosta A, Sarmiento ME, Ferro VA, Rosenqvist E, Campa C, Cardoso D, Garcia L, and Perez JL (2014). Bacterial outer membrane vesicles and vaccine applications. Front. Immunol. 5, 121. - PMC - PubMed
    1. Albrecht T, and Argueso CT (2017). Should I fight or should I grow now? The role of cytokinins in plant growth and immunity and in the growth-defence trade-off. Ann. Bot. 119, 725–735. - PMC - PubMed
    1. Alfano JR, and Collmer A (2001). CHAPTER 5 - Mechanisms of Bacterial Pathogenesis in Plants: Familiar Foes in a Foreign Kingdom. In Principles of Bacterial Pathogenesis, Groisman EA, ed. (Academic Press; ).
    1. Bahar O, Mordukhovich G, Luu DD, Schwessinger B, Daudi A, Jehle AK, Felix G, and Ronald PC (2016). Bacterial Outer Membrane Vesicles Induce Plant Immune Responses. Mol. Plant Microbe Interact. 29, 374–384. - PubMed
    1. Bakker PAHM, Pieterse CMJ, and van Loon LC (2007). Induced Systemic Resistance by Fluorescent Pseudomonas spp. Phytopathology 97, 239–243. - PubMed

Publication types

MeSH terms

Substances

LinkOut - more resources