. 2021 Jan 19;34(3):108634.
doi: 10.1016/j.celrep.2020.108634.

Transcriptome alterations in myotonic dystrophy frontal cortex

Affiliations

Transcriptome alterations in myotonic dystrophy frontal cortex

Brittney A Otero et al. Cell Rep. .

Abstract

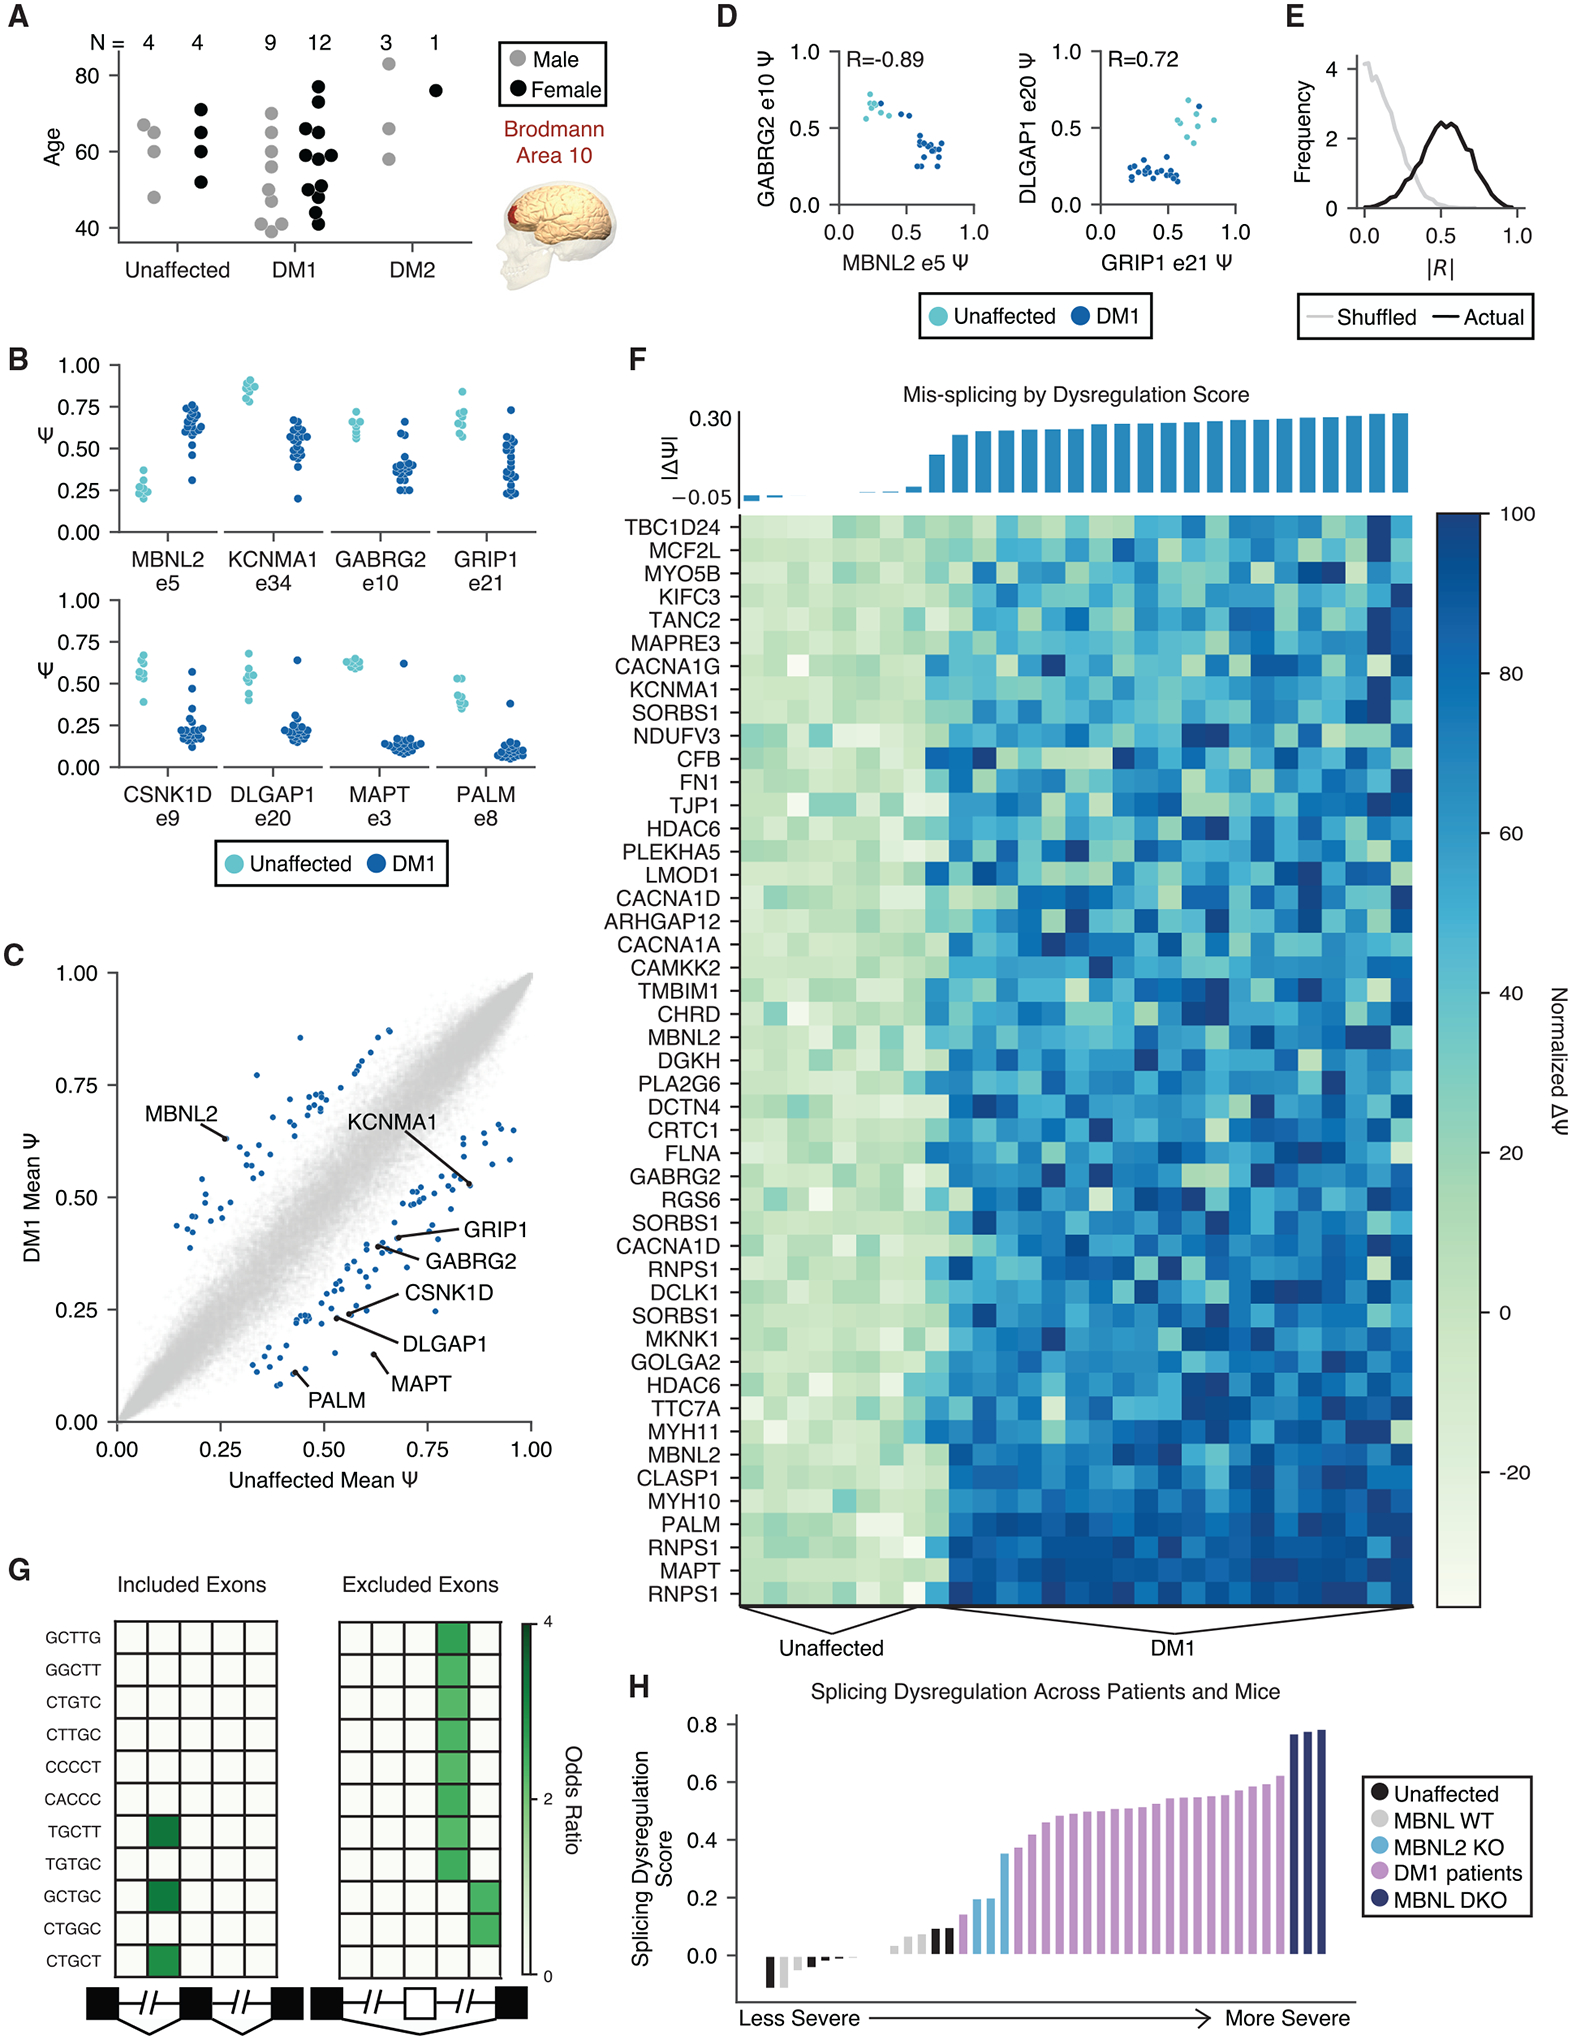
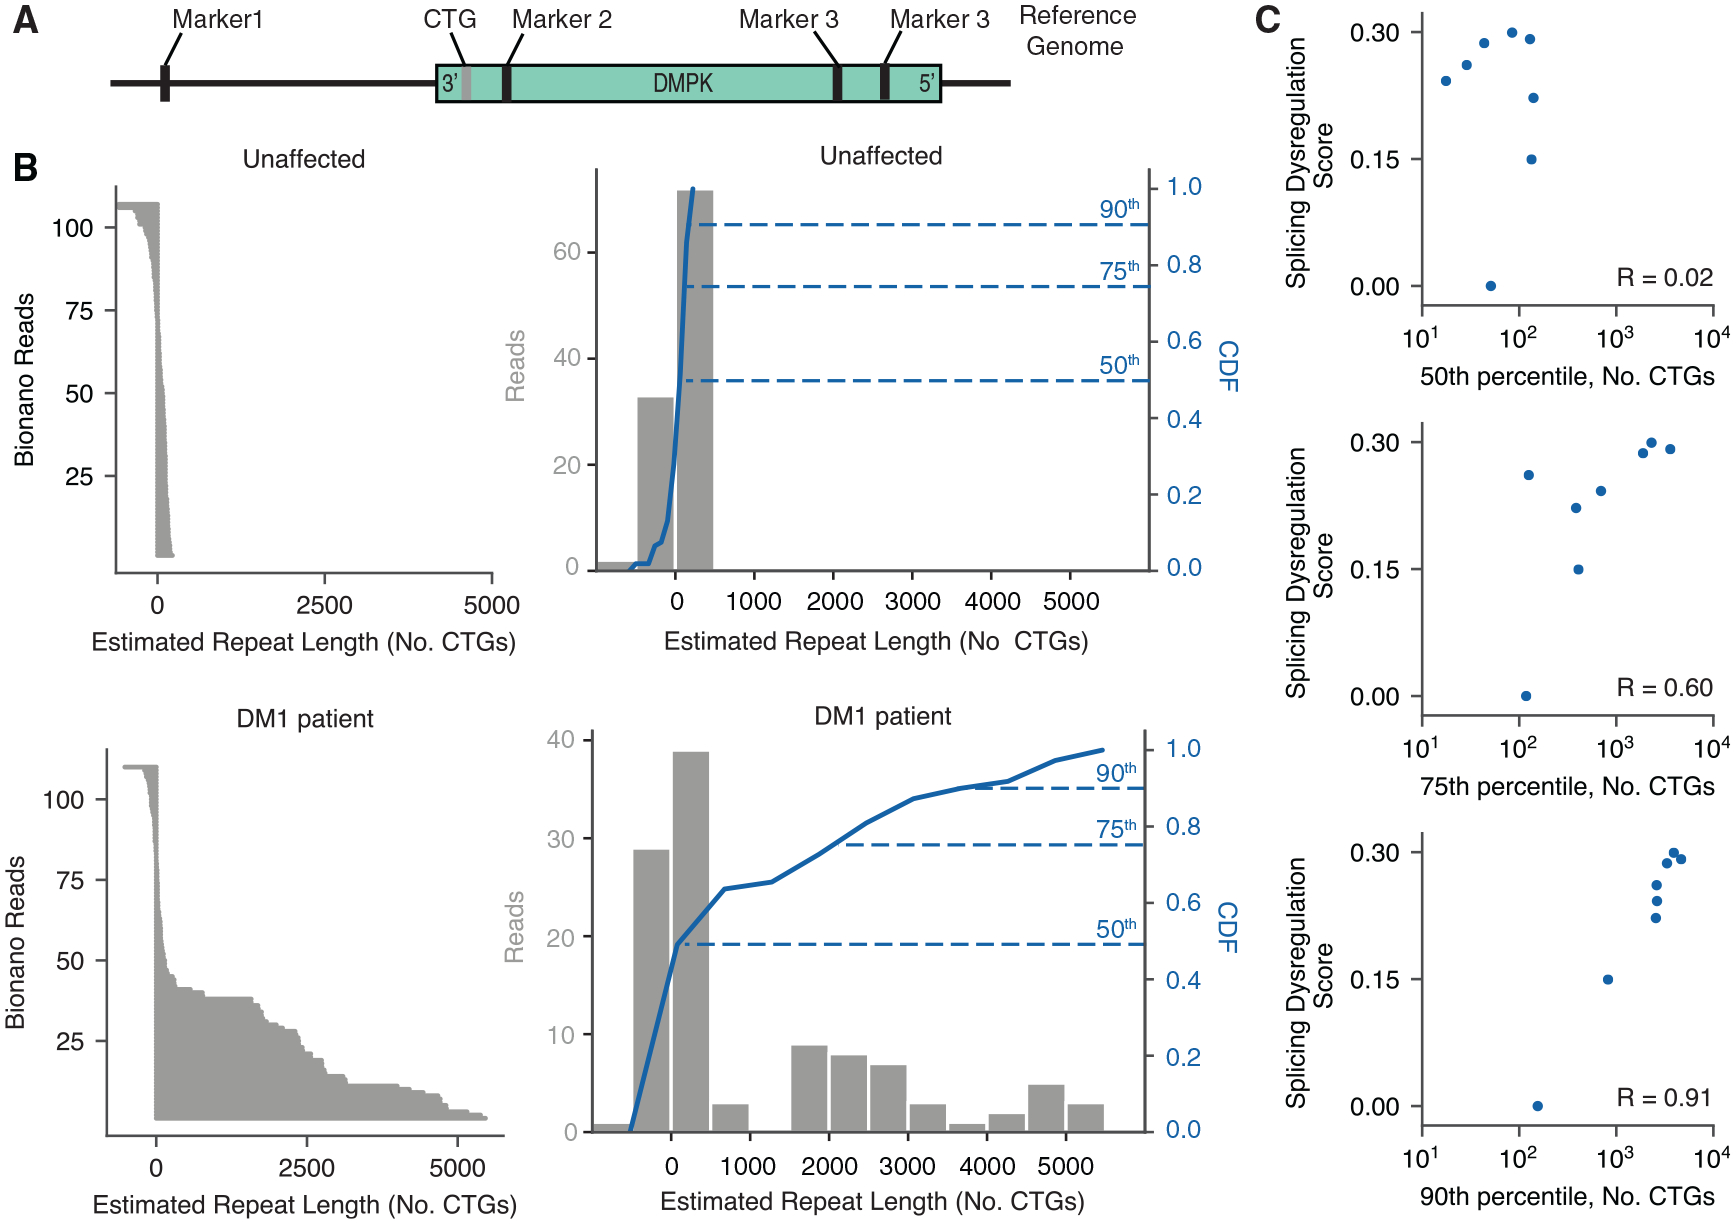
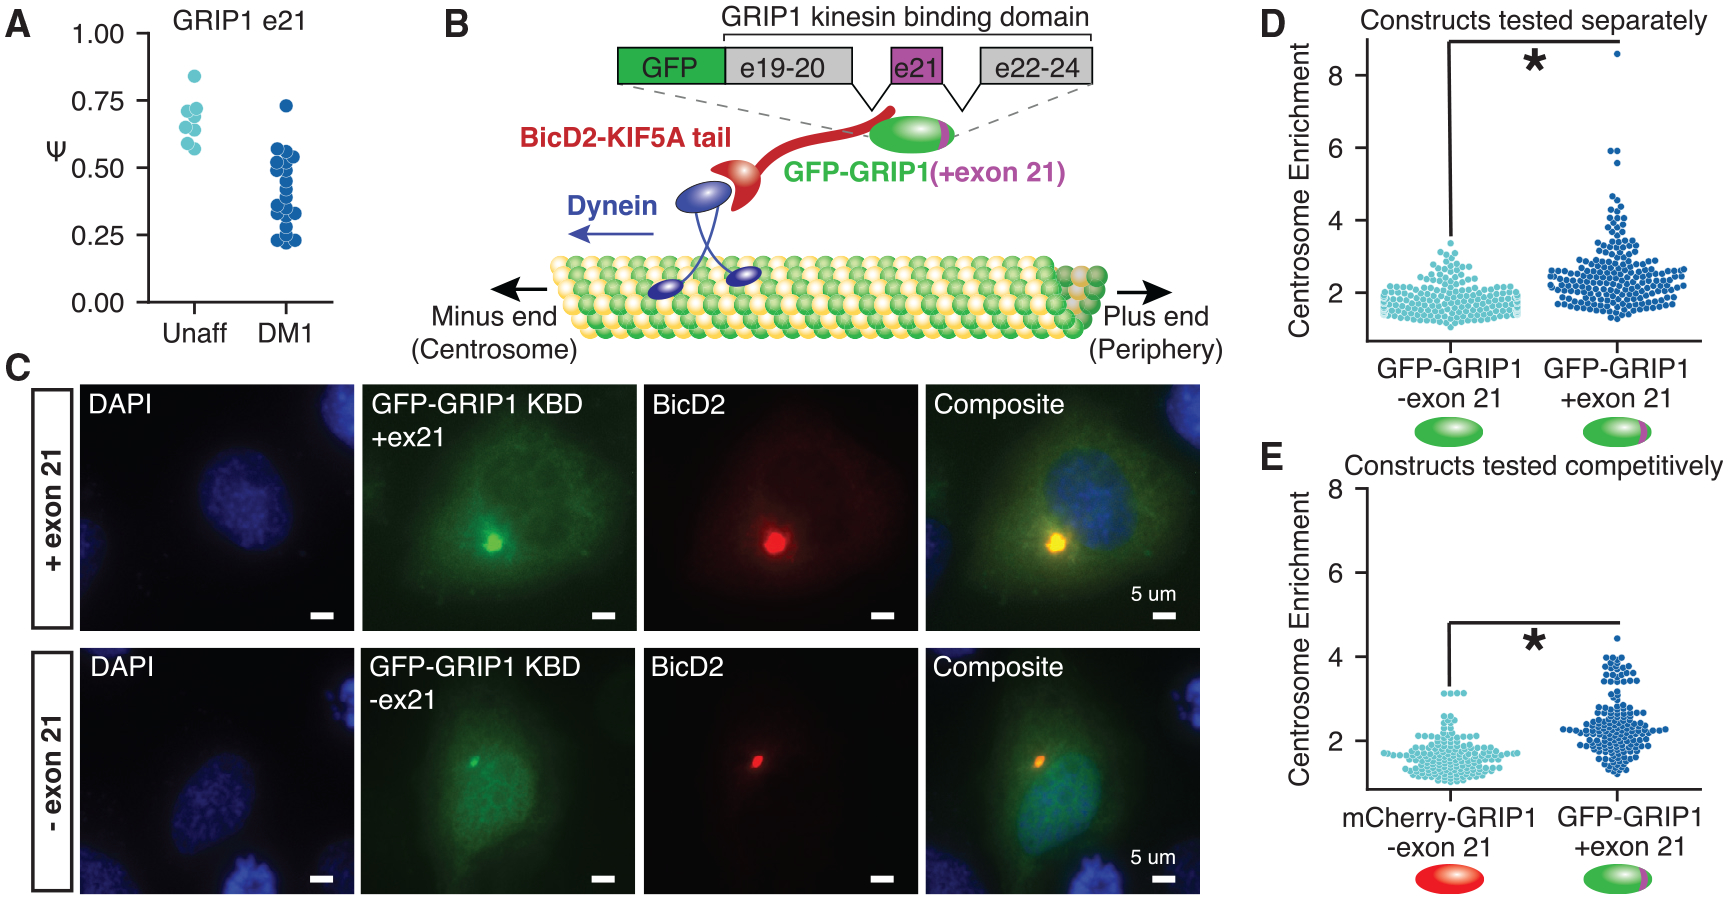
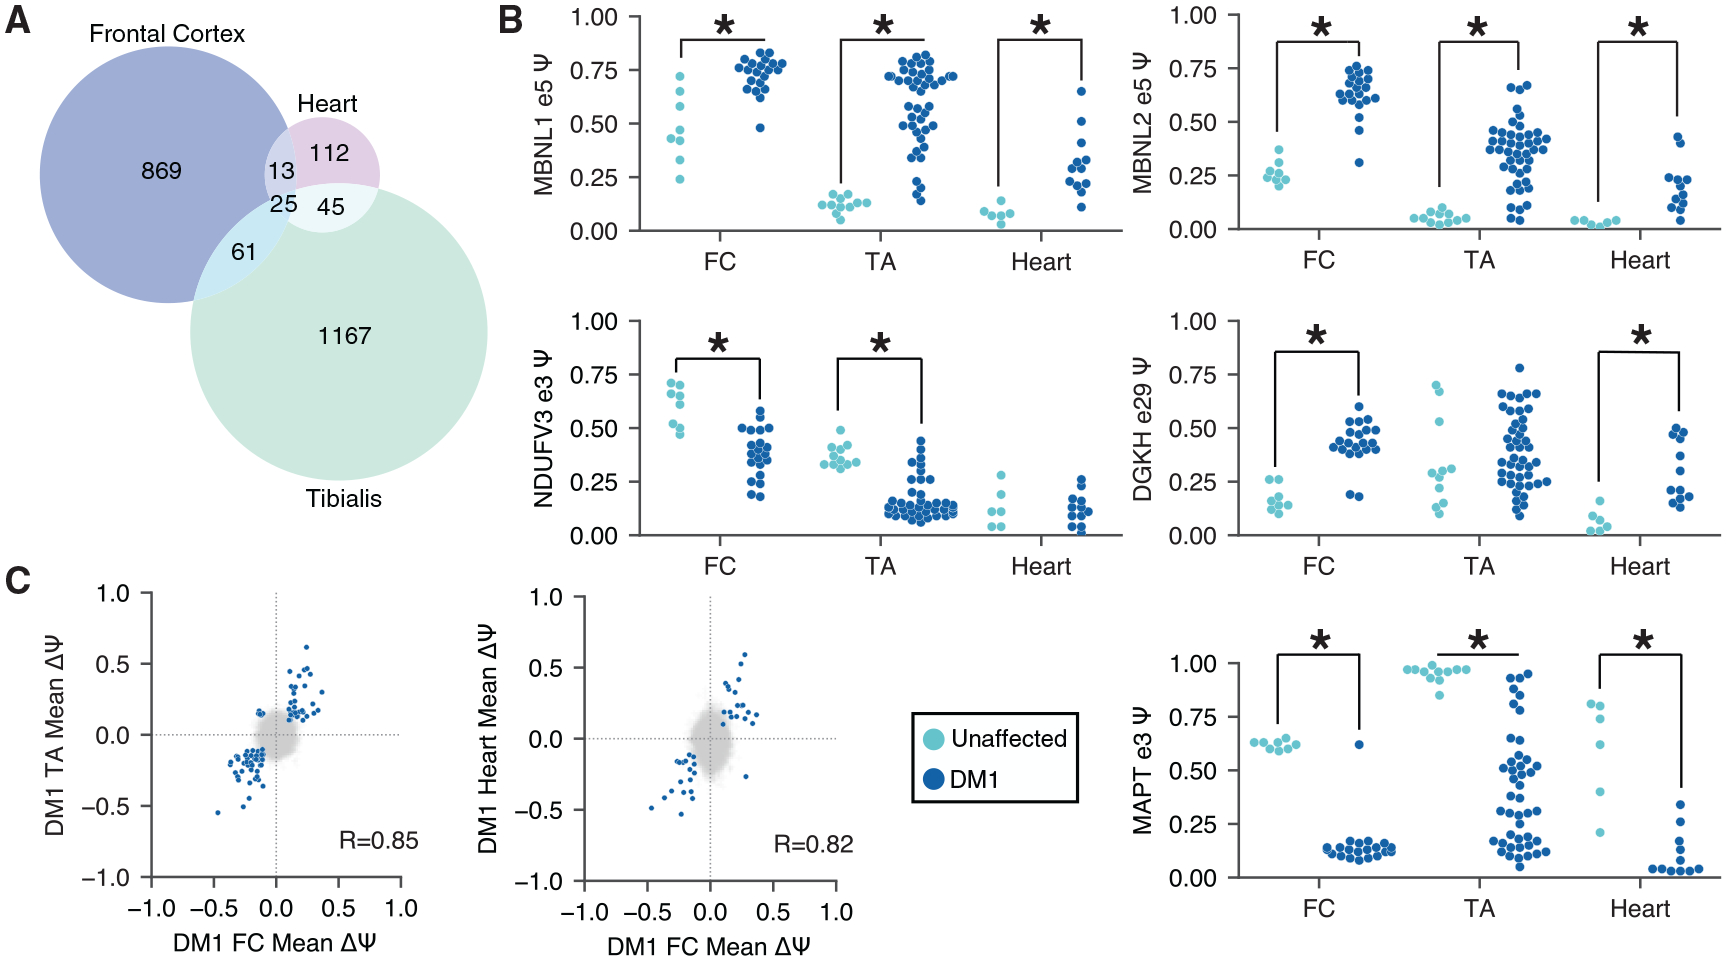
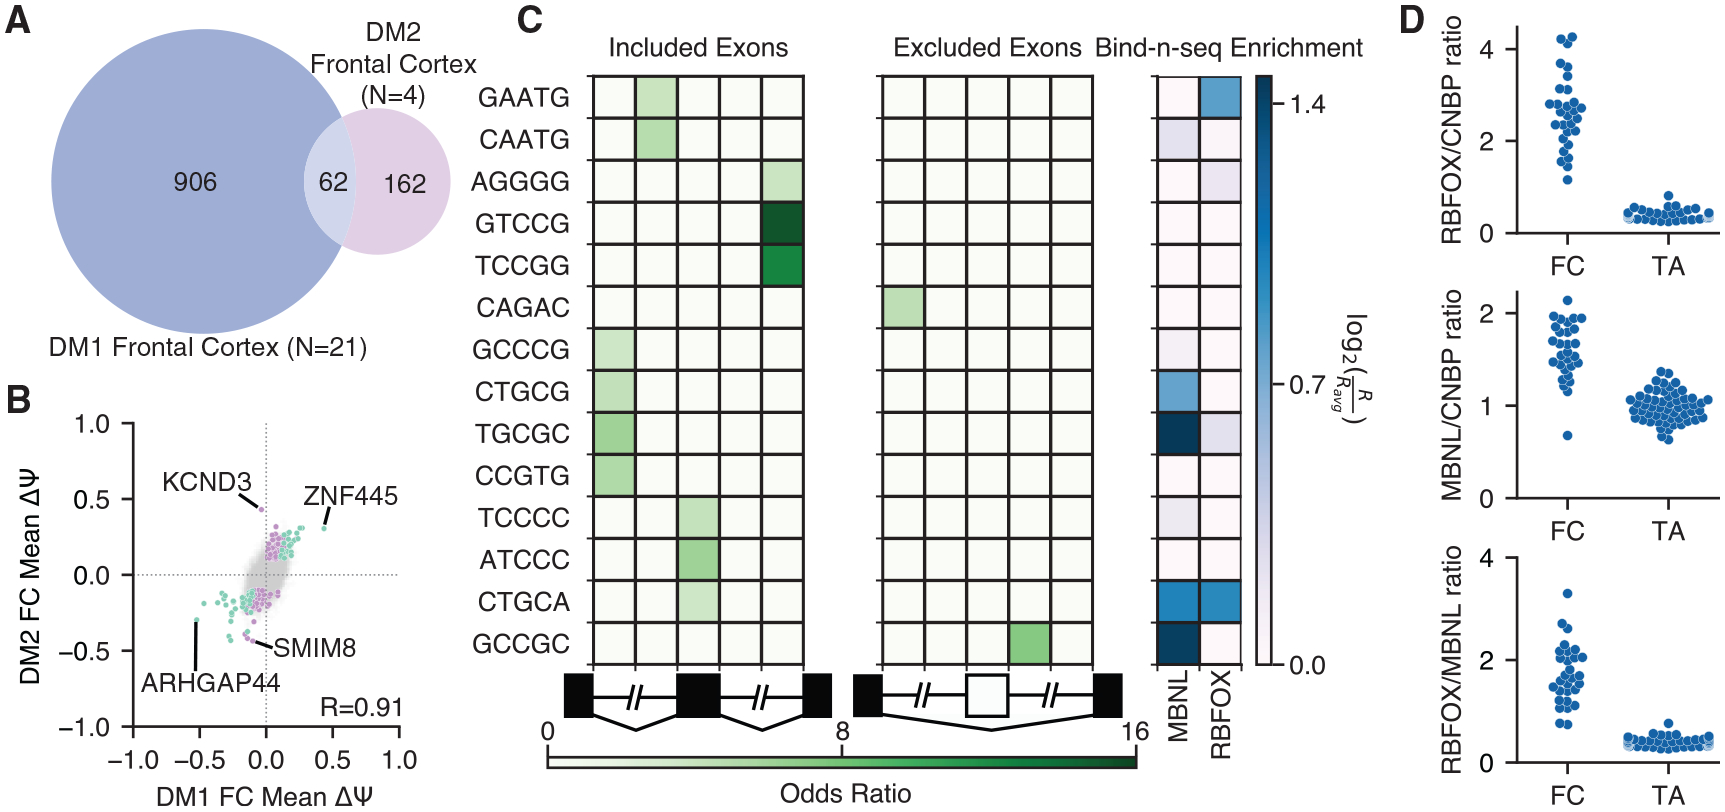
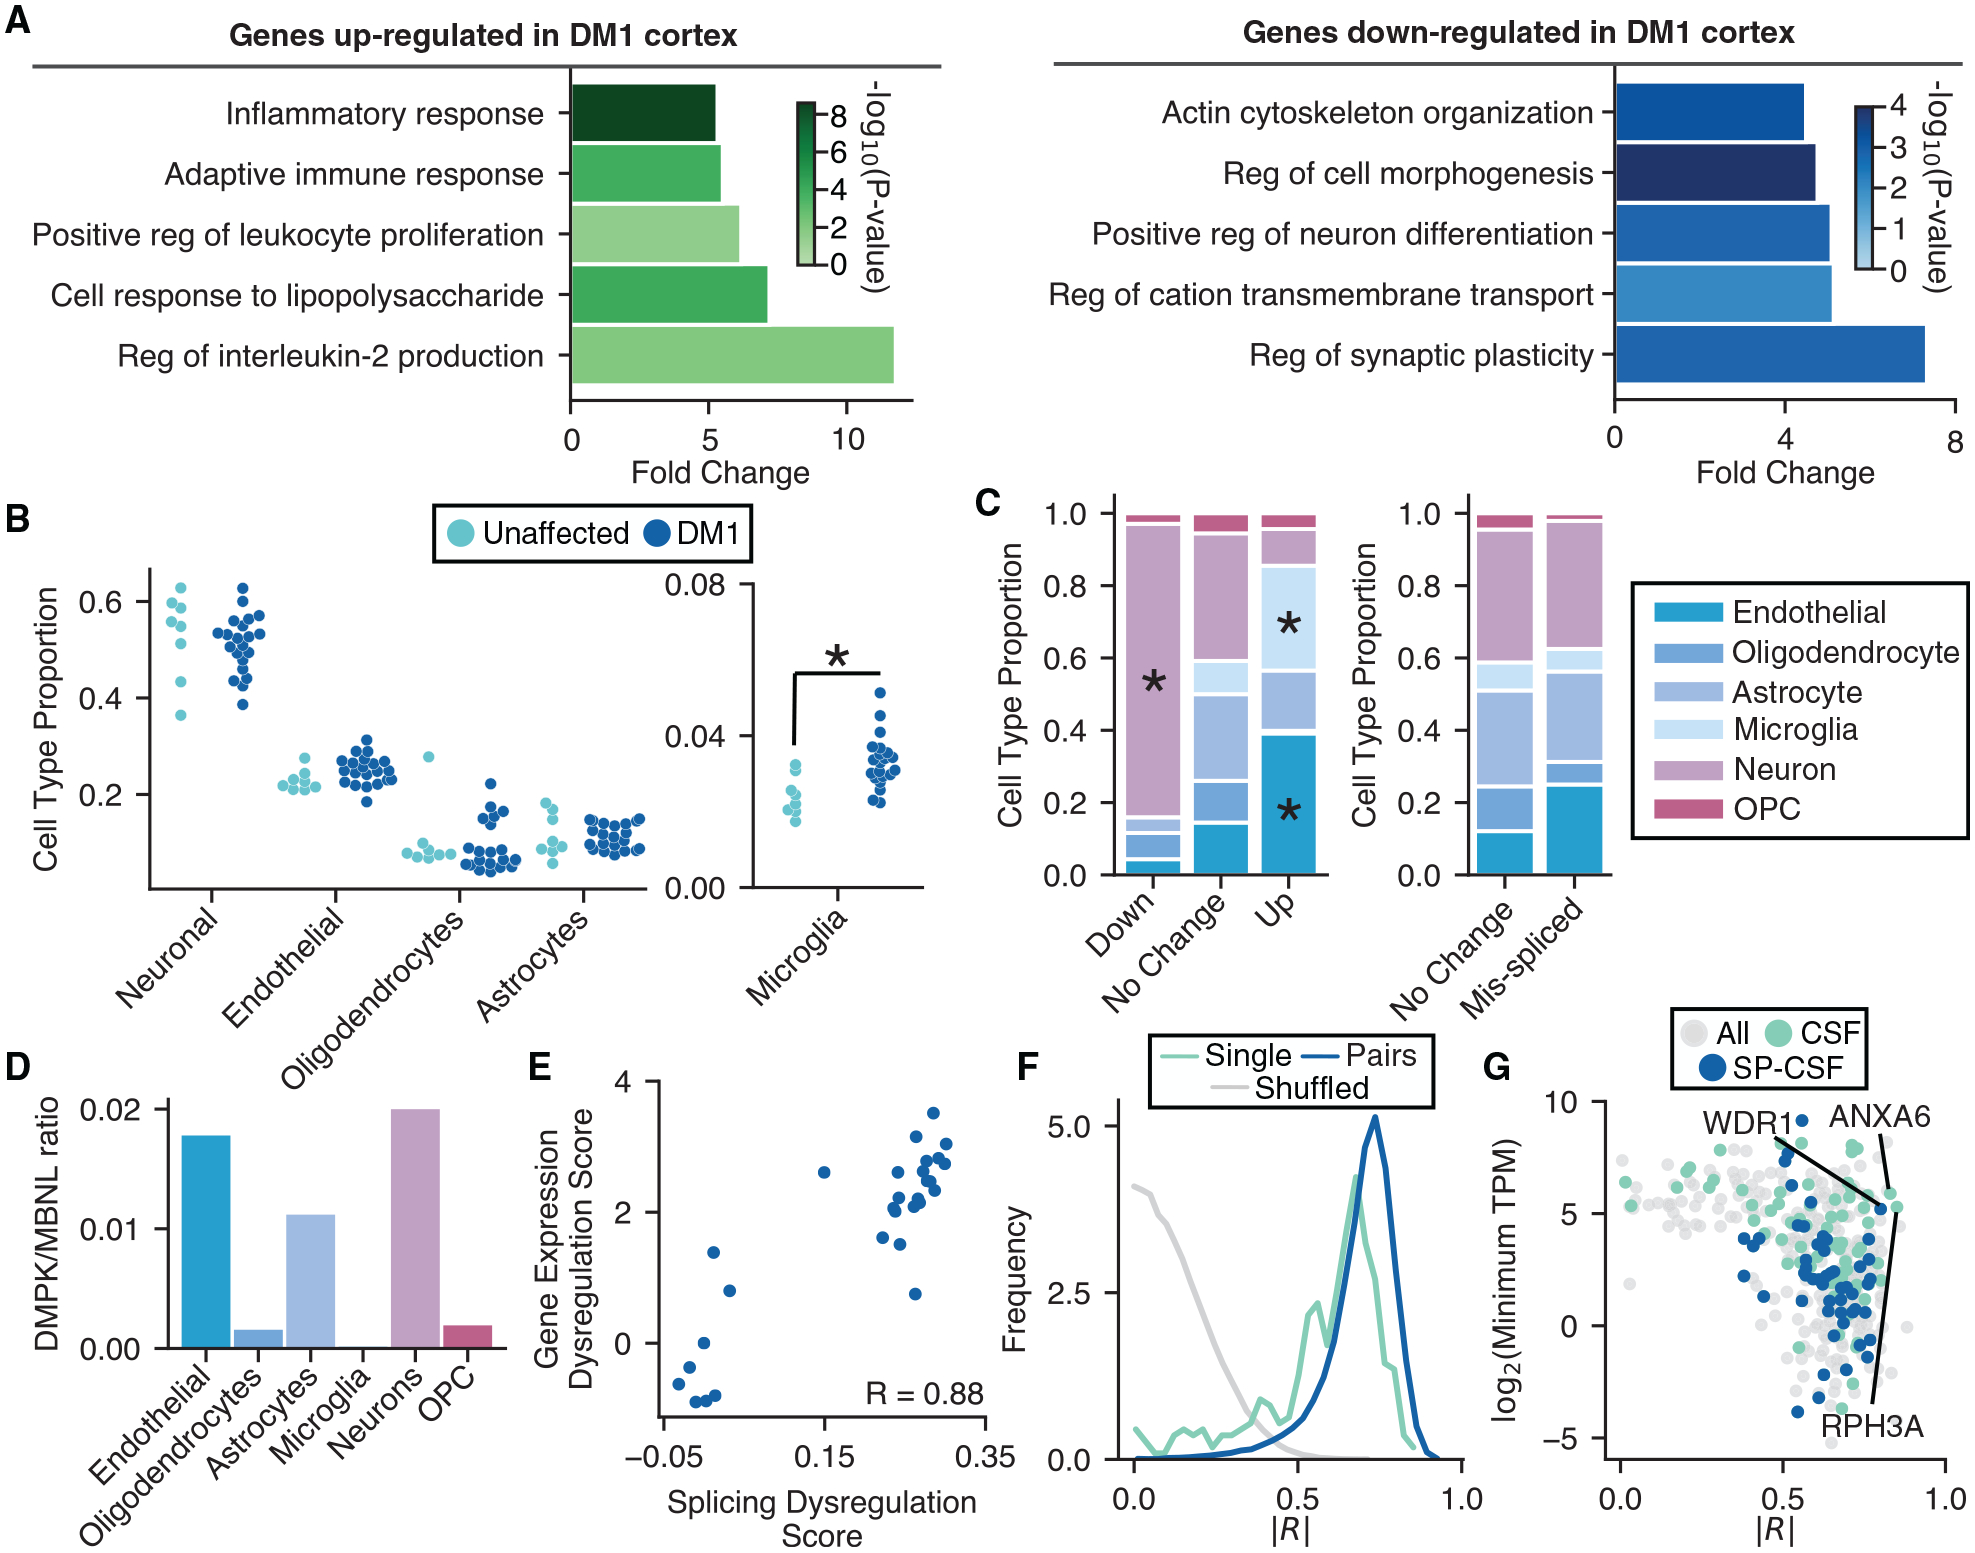
Myotonic dystrophy (DM) is caused by expanded CTG/CCTG repeats, causing symptoms in skeletal muscle, heart, and central nervous system (CNS). CNS issues are debilitating and include hypersomnolence, executive dysfunction, white matter atrophy, and neurofibrillary tangles. Here, we generate RNA-seq transcriptomes from DM and unaffected frontal cortex and identify 130 high-confidence splicing changes, most occurring only in cortex, not skeletal muscle or heart. Mis-spliced exons occur in neurotransmitter receptors, ion channels, and synaptic scaffolds, and GRIP1 mis-splicing modulates kinesin association. Optical mapping of expanded CTG repeats reveals extreme mosaicism, with some alleles showing >1,000 CTGs. Mis-splicing severity correlates with CTG repeat length across individuals. Upregulated genes tend to be microglial and endothelial, suggesting neuroinflammation, and downregulated genes tend to be neuronal. Many gene expression changes strongly correlate with mis-splicing, suggesting candidate biomarkers of disease. These findings provide a framework for mechanistic and therapeutic studies of the DM CNS.


Conflict of interest statement

Declaration of interests The authors declare no competing interests.

Figures

Figure 1.
Figure 1.. Mis-splicing changes across DM1 FC samples show a gradient of severity consistent with quantitative loss of MBNL
(A) RNA-seq was performed on 21 DM1, 4 DM2, and 8 unaffected FC (Brodmann area 10) samples across a range of ages. (B) Percentage spliced in (PSI, ψ) for specific exons in unaffected and DM1 FC samples. (C) Scatterplot of mean ψ for unaffected versus DM1 samples for all exons measured; 130 mis-splicing events were detected as significantly regulated (|Δψ| > 0.2, p < 0.01 by rank-sum test) and are highlighted in blue. (D) Scatterplot of ψ for MBNL2 exon 5 versus GABRG2 exon 10 and GRIP1 exon 21 versus DLGAP1 exon 20 across unaffected and DM1 individuals. The Pearson correlation value is shown. (E) Histogram of correlation values for all pairs of 130 significantly regulated exons (black). A similar histogram of correlation values for all pairs following shuffling of patient identities is also shown (gray) (see STAR Methods). A Kolmogorov-Smirnov (KS) test shows that the distributions are different (p < 1e–300). (F) Normalized ψ for 47 of the 130 significantly regulated exons showing the least variation in ψ across unaffected FC (see STAR Methods). Individuals are sorted by splicing dysregulation score (see STAR Methods), also shown above in bars. (G) Heatmap showing enrichment of motifs around the 101 significantly regulated skipped exons relative to all other measured skipped exons. The columns denote the intronic region from +1 to +250 and −250 to −1 of the upstream intron, the skipped exon, and the intronic region from +1 to +250 and −250 to −1 of the downstream intron. (H) Total splicing dysregulation in all human and MBNL KO mouse samples considered as computed using 74 orthologous exons significantly dysregulated (|Δψ| > 0.1, p < 0.05 by rank-sum test) in DM1 patients and MBNL DKO mice.
Figure 2.
Figure 2.. DM1 FC samples show large expansions, and the proportion of long expansions correlates with overall splicing dysregulation
(A) DNA fragments from unaffected and DM1 FC samples were labeled by direct labeling enzyme (DLE) and subjected to optical mapping of the DMPK locus. (B) Observed Bionano reads are shown on the left for one unaffected individual (top) and one DM1 individual (bottom). Histograms of the estimated CTG repeat lengths are shown on the right (gray bars) for individuals, along with their cumulative distribution functions (CDFs, blue line). The 50th, 75th, and 90th percentiles of repeat lengths are indicated. (C) Scatterplot of the 50th, 75th, and 90th percentiles of repeat lengths versus total splicing dysregulation across all unaffected and DM1 individuals for which repeat lengths were measured. Pearson correlation values are shown.
Figure 3.
Figure 3.. Mis-splicing of GRIP1 in DM1 may lead to changes in kinesin association
(A) GRIP1 exon 21 is significantly mis-spliced in DM1 FC. (B) Schematic of GRIP1 kinesin binding domain (KBD) and the centrosome recruitment assay. The C-terminal tail of KIF5A is used as a bait to recruit GFP-GRIP1 fusions to the centrosome. (C) Representative images of the centrosome recruitment assay using GRIP1 KBD fluorescent fusion proteins, with and without exon 21, taken at 403 magnification. (D and E) Quantitation of recruitment efficiency (mean signal at the centrosome divided by mean cytoplasmic signal outside the centrosome) for each construct transfected either (D) independently or (E) competitively, in which the construct with exon 21 was fused to GFP and the construct without exon 21 was fused to mCherry. Significance is shown by an asterisk, and p < 0.01 is shown by a rank-sum test. Cells were quantitated from at least 3 independent transfections.
Figure 4.
Figure 4.. Across DM1 FC, skeletal muscle, and heart, most splicing events are tissue specific
(A) Venn diagram showing exons mis-spliced in 1, 2, or all 3 DM1 tissues. (B) ψ for specific exons in FC, skeletal muscle, and heart. Exons significantly mis-regulated in any given tissue are indicated with an asterisk. (C) Scatterplot of ψ for each pair of tissues analyzed. Exons that are significantly regulated (|Δψ| > 0.1, p < 0.01 by rank-sum test) in both tissues are highlighted in blue; 86 are shared between FC and skeletal muscle, and 38 are shared between FC and heart. Pearson correlations for blue points are shown.
Figure 5.
Figure 5.. The extent of mis-splicing shared between DM1 and DM2 FC is limited
(A) Venn diagram showing exons mis-spliced (|Δψ| > 0.1, p < 0.01 by rank-sum test) in DM1 or DM2 FC or both. (B) Scatterplot of Δψ for DM2 versus DM1. 62 exons identified to be significantly regulated in both DM1 and DM2 (|Δψ| > 0.1, p < 0.01 by rank-sum test) are highlighted in teal, and 162 exons identified to be significantly regulated uniquely in DM2 (|Δψ| > 0.1, p < 0.01 by rank-sum test) are highlighted in purple. DM1-specific events have been omitted for clarity. Pearson correlation for shared (teal) events is shown. (C) Heatmap showing enrichment of motifs around 35 DM2-regulated skipped exons relative to all other measured skipped exons. The columns denote the intronic region from +1 to +250 and −250 to −1 of the upstream intron, the skipped exon, and the intronic region +1 to +250 and −250 to −1 of the downstream intron. Bind-N-Seq enrichment values for MBNL and RBFOX are also shown; enrichments were derived from experiments using 1,080 nM MBNL1 or 1,100 nM RBFOX2. (D) Transcript per million (TPM) ratios of total RBFOX (RBFOX1, RBFOX2, and RBFOX3) versus CNBP, total MBNL (MBNL1, MBNL2, and MBNL3) versus CNBP, and total RBFOX versus total MBNL are shown across FC and skeletal muscle. Note the high concentration of RBFOX in FC relative to skeletal muscle.
Figure 6.
Figure 6.. Analysis of gene expression changes reveals neuroinflammation and potential biomarkers
(A) Gene Ontology analysis of genes upregulated (green) and downregulated (blue) in DM1 versus unaffected FC (top five categories shown for each, selected by fold change). (B) Proportions of neurons, microglia, endothelial cells, oligodendrocytes, and astrocytes in each FC sample were estimated by Bayesian inference using published transcriptome profiles (see STAR Methods) and plotted. Significance is shown by an asterisk. (C) Proportion of up-, non-, and downregulated genes derived from specific cell types is shown (left panel). The proportion of mis-spliced and unaffected genes derived from specific cell types is also shown (right panel). Cell-type specificity for genes was determined using publicly available single-cell sequencing data (see STAR Methods). Significance is shown by an asterisk. (D) TPM ratios for DMPK versus total MBNL (MBNL1, MBNL2, and MBNL3) across various CNS cell types. (E) Scatterplot of splicing dysregulation score versus gene expression dysregulation score (see STAR Methods). Pearson correlation is shown (p = 3e–10). (F) Pearson correlations between splicing dysregulation score and log2(TPM) for each dysregulated gene were computed and plotted as a histogram (teal). Samples were shuffled and correlations were recomputed and plotted (gray). A similar score was also computed between splicing dysregulation and all pairs of genes (blue) (see STAR Methods). Absolute values for all correlations were used for plotting. Similarities of distributions were assessed by a KS test; p < 1e–300 when comparing shuffled to single genes, and p < −200 when comparing shuffled to pairs of genes. (G) Scatterplot of the single-gene correlations computed in (F) versus log2(TPM) for those genes. Genes encoding proteins detectable in CSF, and those additionally found to have signal sequences (SignalP) (see STAR Methods) are highlighted in teal and blue, respectively.

References

    1. Andrews S (2010). FastQC: A Quality Control Tool for High Throughput Sequence Data. Babraham Bioinformatics http://www.bioinformatics.babraham.ac.uk/projects/fastqc.
    1. Antoury L, Hu N, Balaj L, Das S, Georghiou S, Darras B, Clark T, Breakefield XO, and Wheeler TM (2018). Analysis of extracellular mRNA in human urine reveals splice variant biomarkers of muscular dystrophies. Nat. Commun 9, 3906. - PMC - PubMed
    1. Arstikaitis P, Gauthier-Campbell C, Carolina Gutierrez Herrera R, Huang K, Levinson JN, Murphy TH, Kilimann MW, Sala C, Colicos MA, and El-Husseini A (2008). Paralemmin-1, a modulator of filopodia induction is required for spine maturation. Mol. Biol. Cell 19, 2026–2038. - PMC - PubMed
    1. Barseghyan H, Tang W, Wang RT, Almalvez M, Segura E, Bramble MS, Lipson A, Douine ED, Lee H, Délot EC, et al. (2017). Next-generation mapping: a novel approach for detection of pathogenic structural variants with a potential utility in clinical diagnosis. Genome Med 9, 90. - PMC - PubMed
    1. Begg BE, Jens M, Wang PY, Minor CM, and Burge CB (2020). Concentration-dependent splicing is enabled by Rbfox motifs of intermediate affinity. Nat. Struct. Mol. Biol 27, 901–912. - PMC - PubMed

Publication types