. 2021 Jan 19;34(3):108629.
doi: 10.1016/j.celrep.2020.108629.

VELCRO-IP RNA-seq reveals ribosome expansion segment function in translation genome-wide

Affiliations

VELCRO-IP RNA-seq reveals ribosome expansion segment function in translation genome-wide

Kathrin Leppek et al. Cell Rep. .

Abstract

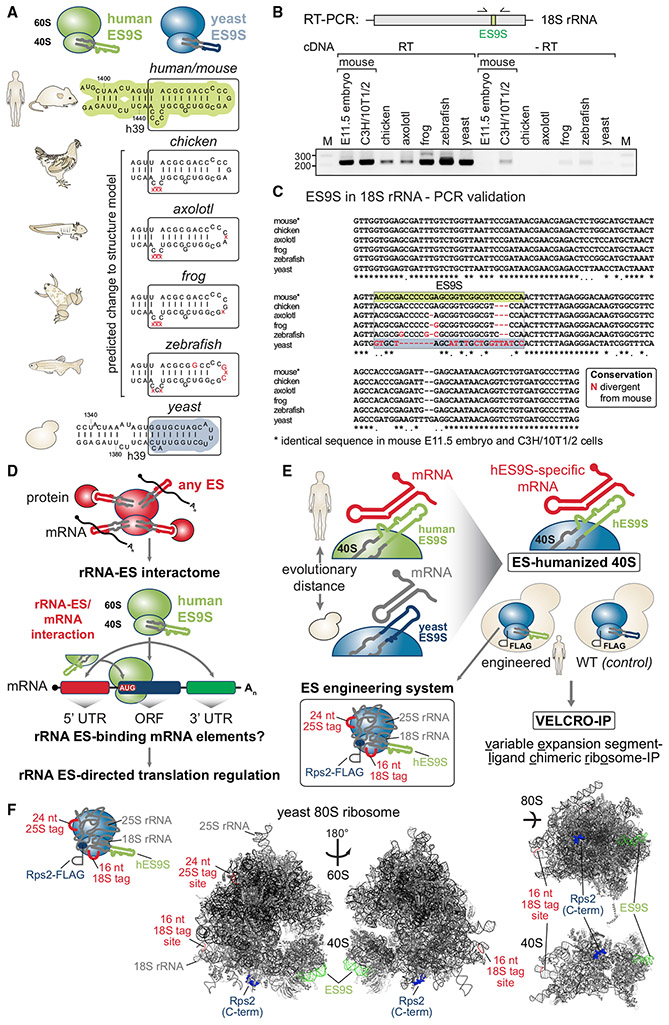
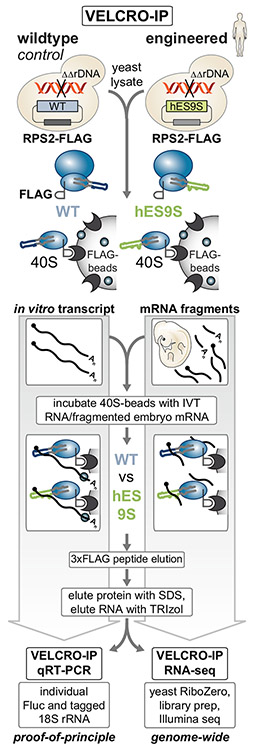
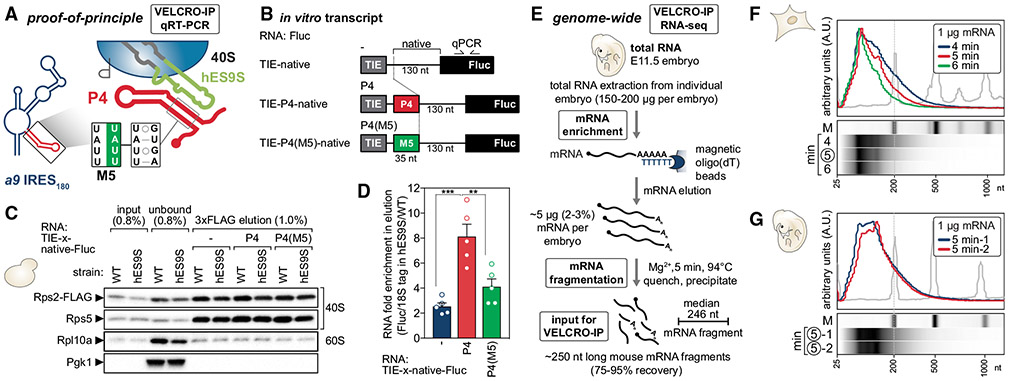
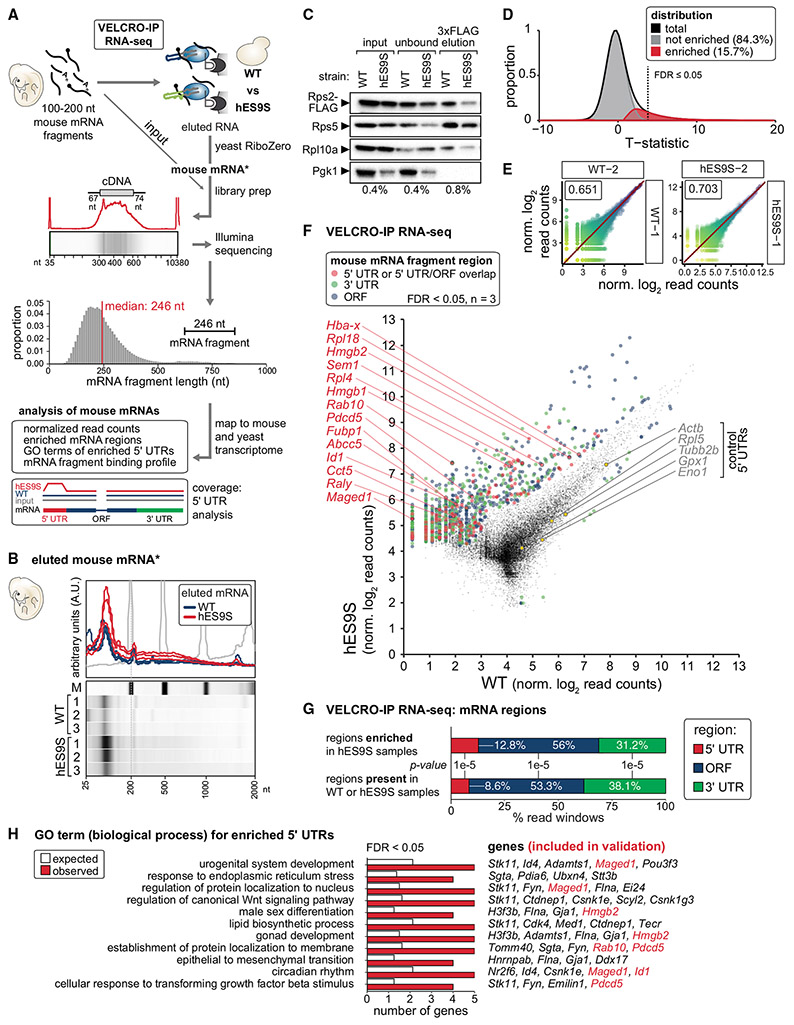
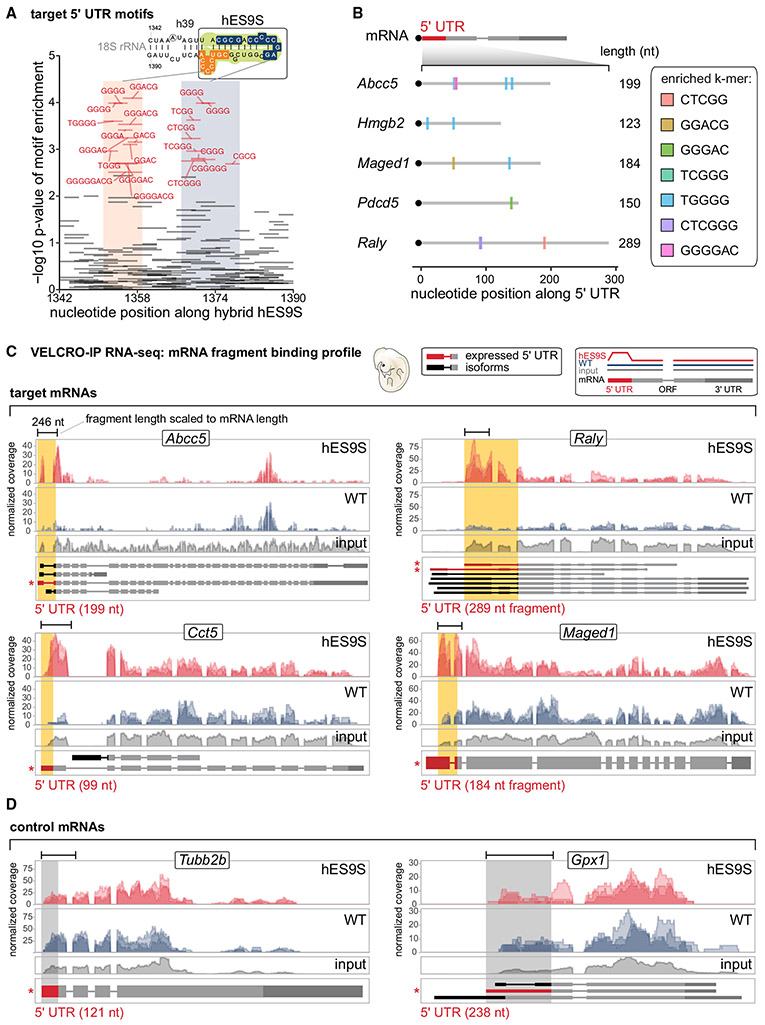
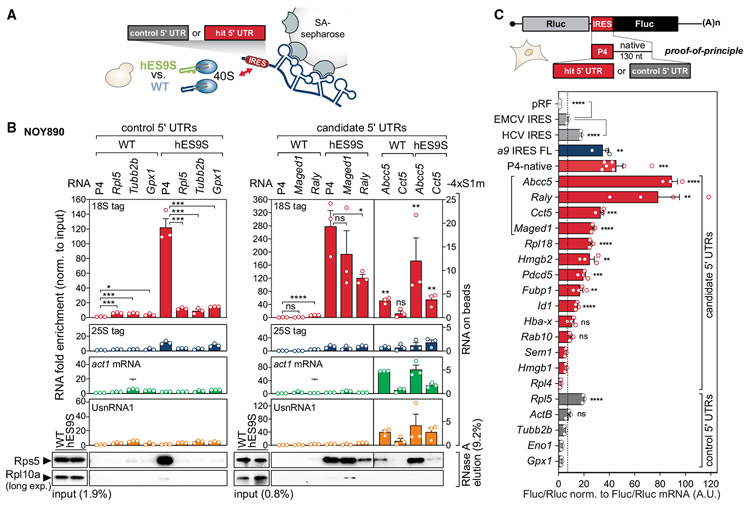
Roles for ribosomal RNA (rRNA) in gene regulation remain largely unexplored. With hundreds of rDNA units positioned across multiple loci, it is not possible to genetically modify rRNA in mammalian cells, hindering understanding of ribosome function. It remains elusive whether expansion segments (ESs), tentacle-like rRNA extensions that vary in sequence and size across eukaryotic evolution, may have functional roles in translation control. Here, we develop variable expansion segment-ligand chimeric ribosome immunoprecipitation RNA sequencing (VELCRO-IP RNA-seq), a versatile methodology to generate species-adapted ESs and to map specific mRNA regions across the transcriptome that preferentially associate with ESs. Application of VELCRO-IP RNA-seq to a mammalian ES, ES9S, identified a large array of transcripts that are selectively recruited to ribosomes via an ES. We further characterize a set of 5' UTRs that facilitate cap-independent translation through ES9S-mediated ribosome binding. Thus, we present a technology for studying the enigmatic ESs of the ribosome, revealing their function in gene-specific translation.

Keywords: ES9S; RNA fragment mapping; RNA sequencing; RNA stem-loop structure; internal initiation; mRNA translation; mouse embryo; rRNA expansion segment; ribosome engineering; yeast.


Conflict of interest statement

Declaration of interests K.L., G.W.B., and M.B. are inventors on patents and submitted provisional patent applications related to the Hoxa9 P4 stem-loop and RNA therapeutics and to their various uses.

Figures

Figure 1.
Figure 1.. Confirmation of interspecies sequence variation of the ES9S 18S rRNA region
(A) Secondary structure models of the human (H. sapiens) and baker’s yeast (S. cerevisiae) 18S rRNA region containing ES9S, highlighted in green and blue, respectively. Predicted structural changes in ES9S because of species-specific variation in sequence. Sequence divergence from the human/mouse ES9S are annotated in red. Secondary structure models of ES9S were predicted using Vienna RNAfold (http://rna.tbi.univie.ac.at) and visualized using VARNA (http://varna.lri.fr). See also Figure S1. (B) Schematic of the RT-PCR analysis of the ES9S region using cDNA generated from total RNA from six species (E11.5, stage E11.5 FVB mouse embryo; chicken, Gallus gallus; axolotl, Ambystoma mexicanum; frog, Xenopus laevis; zebrafish, Danio rerio; yeast, Saccharomyces cerevisiae) and primers specific for the 18S rRNA region containing ES9S (see Table S3). (C) Multiple sequence alignment of the variable ES9S region in highly conserved 18S rRNA. PCR product sequencing after RT-PCR spanning the ES9S region with the outer primers in (B) for six species confirms the annotated species-specific ES9S sequence. Nucleotides divergent from human/mouse ES9S are highlighted in red. (D) Concept of revealing extended rRNA ES interactions on the ribosome with mRNAs or proteins. This enables analysis of ES9S interactions, the ES of choice in this work, via the 40S ribosomal subunit with positional resolution to identify and map ES9S binding mRNA elements underlying unexplored ES-directed translation regulation. (E) Schematic of the VELCRO-IP (variable expansion segment-ligand chimeric ribosome-IP) approach to investigate ES-mediated translation regulation through mRNA interactions. Generating FLAG-tagged humanized ribosome strains that exclusively contain human ES9S in yeast 18S rRNA and tagged WT control yeast strains in parallel enables an ES engineering system that contains rRNA and protein tags and allows the manipulation of any ES. (F) Mapping of the components of the ES engineering system onto the cryoelectron microscopy (cryo-EM) structure of the yeast 80S and 40S ribosome (PDB: 4V6I). The sites of rRNA tag insertion,the last 10 amino acids of the C terminus of Rps2/uS5, and ES9S are highlighted according to the schematic representation.
Figure 2.
Figure 2.. Development of VELCRO-IP RNA-seq to identify global ES-mRNA interactions
Schematic representation of the VELCRO-IP approach. Yeast strains expressing chimeric (hES9S) orWT ribosomes are generated by rDNA complementation. The same strains also carry endogenously C-terminally FLAG-tagged RPS2/uS5. 40S ribosomal subunits from powderized lysates of each strain are isolated on FLAG agarose beads and washed. For VELCRO-IP qRT-PCR (proof of principle), in vitro transcripts (IVTs) (see Figure 3) are incubated with ribosome beads. Upon 3xFLAG peptide elution of 40S-RNA complexes, total RNA is eluted, and IVT RNA enrichment is determined by qRT-PCR specific for Fluc and the 18S rRNA tag. For VELCRO-IP RNA-seq (genome-wide), mRNAs from total RNA from stage E11.5 mouse embryos are purified and fragmented to 100–200 nt, and refolded RNA fragments are used as input for IP and FLAG elution of mRNA-ribosome complexes. After yeast rRNA depletion from eluted RNAs, ribosome-bound mRNA fragments are sequenced to identify hES9S-specific mouse mRNA elements.
Figure 3.
Figure 3.. VELCRO-IP qRT-PCR serves as a proof of principle and mouse embryo mRNA fragmentation
(A) VELCRO-IP qRT-PCR: a zoomed-in view on the interactions between hES9S and Hoxa9 P4 stem-loop (Leppek et al., 2020) or other target 5′ UTRs that can be identified by VELCRO-IP. The 4-nt inactive P4 mutant M5 (P4(M5)) serves as a negative control. (B) IVTs of 475–510 nt in length contain the native spacer (–, negative control), P4-native (P4), or P4(M5)-native (P4(M5)) embedded in flanking constant regions (5′ TIE and 3′ Fluc ORF sequence) (see Leppek et al., 2020). The Fluc ORF portion can be used for qPCR amplification to compare the three RNA constructs. TIE, translation inhibitory element. (C) Western blot (WB) analysis of same volumes of lysate (input), unbound fraction, and 3xFLAG peptide-eluted protein from beads to monitor ribosome enrichment of tagged (Rps2-FLAG) and untagged (Rps5) 40S and 60S (Rpl10a) components in IVT RNA samples, in combination with WT and hES9S yeast ribosomes. Cytoplasmic enzyme Pgk1 served as a negative control. The fraction loaded of input, unbound, and elution samples is expressed as a percentage of the original lysate volume. A representative experiment of n = 5 is shown. (D) Analysis of total RNA in the 3xFLAG peptide elution by qRT-PCR using the same volumes of RNA per sample for the RT. Fluc transcript enrichment was assessed by normalizing Ct values to those of the respective 18S rRNA tag to control for ribosome-IP efficiency per sample. Respective hES9S samples were compared with WT samples to assess RNA fold enrichment of IVT RNAs. Average RNA fold enrichment ± SEM, n = 5. See also Figures S2E-S2G. (E) Schematic of embryo mRNA fragmentation for VELCRO-IP RNA-seq. Total RNA extraction of stage E11.5 mouse embryos yields 2%–3% of mRNA isolated on oligo(dT) beads. mRNA is fragmented with magnesium ions to a length of 100–200 nt, which overall recovers >75% of input mRNAs as fragments. (F) Fragmented mouse mRNAs from C3H10T1/2 cells in 1-μg aliquots at different time points of fragmentation (4, 5, and 6 min) were analyzed on an mRNA Pico Chip (Agilent) on a Bioanalyzer (Agilent). A zoomed-in view of the Bioanalyzer quantification (top) and virtual gel images (bottom) is shown. The marker (gray line, lane M) is overlaid for reference. See also Figures S3A-S3C. (G) Fragmented mouse mRNAs from stage E11.5 embryos in 1-μg aliquots fragmented for 5 min at 94°C from two independent repeats of embryo harvest, RNA isolation, mRNA purification, and fragmentation (1 and 2). This yields fragments of 100–200 nt. RNAs were analyzed as in (F). See also Figure S3C.
Figure 4.
Figure 4.. VELCRO-IP RNA-seq identifies global ES-mRNA interactions with positional resolution on mRNAs
(A) For VELCRO-IP RNA-seq, mRNA was isolated from stage E11.5 mouse embryos, fragmented, and used as input. Eluted and yeast rRNA-depleted RNA obtains ribosome-bound mouse mRNA fragments for library preparation and Illumina sequencing, including the mRNA fragment input for reference. The distribution of mRNA fragment lengths for all sequenced libraries is plotted with a median fragment length of 246 nt. All reads were mapped to the mouse and yeast transcriptomes, and only reads exclusively mapping to mouse mRNAs were further analyzed. (B) Eluted and yeast rRNA-depleted mouse RNA from three independent replicates of WT and hES9S VELCRO-IP experiments were analyzed on an mRNA Pico Chip (Agilent) on a Bioanalyzer (Agilent) as in Figure 3F. See Figure S3D. (C) WB analysis as in Figure 3C to monitor efficient IP of 40S ribosomes after VELCRO-IP. A representative experiment of n = 3 is shown. (D) Kernel density of the distribution of t-statistics for the test of differential enrichment of mRNA fragments bound to hES9S versus WT ribosomes is plotted in black. Empirical estimates of the decomposition of the test statistics distribution to null and non-null tests are plotted in gray and red, respectively. The dotted line indicates local FDR of 0.05. (E) Comparison of individual VELCRO-IP RNA-seq samples (three replicate samples per hES9S and WT). Scatterplots of normalized log read counts, colored by expression level. Pearson correlation coefficients are shown in the top-right boxes. See Figure S4A. (F) RNA-seq results of independent replicates (n = 3) for each WT and hES9S sample. Normalized log read counts are presented for WT and hES9S-enriched mouse mRNA fragments. Fragments (FDR < 0.05) are colored according to the mRNA region to which they map (see legend): 5′ UTR or overlapping 5′ UTR/ORF (red), 3′ UTR (green), and ORF (blue). Mouse genes are labeled for which enriched fragments in the 5′ UTR and/or 5′ region of the ORF were identified and for which 5′ UTR validation experiments were performed. Five control 5′ UTRs are marked that are equally bound to both WT and hES9S 40S subunits and served as negative controls. See Figure S4B and Table S4. (G) Analysis of regions mapping to 5′ UTR, ORF, or 3′ UTR in hES9S-enriched samples compared with their presence in WT or hES9S samples, each n = 3, expressed as the percentage of total read windows identified. The indicated p value is calculated by a chi-square test. (H) Gene Ontology (GO) analysis for the biological process of 87 5′ UTR regions (FDR < 0.05, n = 3) enriched by hES9S. Displayed are the expected and observed frequency of genes for the significant terms (FDR < 0.05) (expressed mRNA regions were used as the background population; see STAR Methods for details of the thresholds used). See Figure S5 for GO terms of ORF, 3′ UTR, and full mRNA (all regions), as well as Table S5.
Figure 5.
Figure 5.. VELCRO-IP RNA-seq identifies hES9S-interacting 5′ UTRs with potential hES9S complementary and positional precision
(A) Potential regions of canonical base-pairing between hES9S and hES9S-enriched mRNAs. The k-mers (4 ≤ k ≤ 8) in the reverse complement sequence of hES9S are plotted as short horizontal lines along the x axis. The y axis shows the Wilcoxon rank-sum test p values between counts of each k-mer across hES9S-enriched versus all 5′ UTR windows. Lines in red are significant k-mers with FDR ≤ 0.05. The colored bases in the inset hES9S structure indicate the bases included by significantly overrepresented k-mers mapping to two clusters in hES9S highlighted on the structure and shaded in the graph in orange and blue. (B) Selected individual examples of hES9S-enriched 5′ UTRs, with the overrepresented k-mers mapped onto the 5′ UTR. Highly hES9S-enriched 5′ UTR windows of Abcc5, Hmgb2, Maged1, Pdcd5, and Raly are plotted as lines, and each rectangular block indicates the positions of the significantly overrepresented k-mer, colored by each k-mer (k ≥ 5). (C) mRNA binding profile as coverage plots for four genes whose 5′ UTR-overlapping windows are significantly enriched in the hES9S over WT samples (FDR < 0.05, n = 3). Normalized per base coverage of individual biological replicate libraries for WT (blue) and hES9S (red) samples is plotted. All mRNA isoforms annotated in the ENSEMBL database are displayed below. Exon lengths are to scale, whereas intron lengths are pseudo-scaled. The read coverage of the input mRNA fragments (gray) is plotted for reference. 5′ UTR regions for the most likely expressed mRNA isoform in embryos (red) and the corresponding regions in the tracks (yellow) are shaded. The 5′ UTR region used for experimental validation corresponds to the asterisk-marked isoform. The mRNA fragment length for each gene is scaled according to the mRNA length for the individual genes presented. The mRNA fragment length, and thus the positional resolution of the coverage tracks, is approximately 100–200 nt. See Figure S6A. (D) Same analysis as in (C) was performed for two 5′ UTRs for which no enrichment of hES9S interaction over WT was found. 5′ UTR regions for the most likely expressed mRNA isoform in embryos (red) and the corresponding regions in the tracks (gray) are shaded. See Figure S6B.
Figure 6.
Figure 6.. VELCRO-IP RNA-seq identifies hES9S-interacting 5′ UTRs with cap-independent translation initiation activity
(A) Based on the analysis in Figures 5 and S6, full 5′ UTRs (as annotated in ENSEMBL) were experimentally validated. Schematic of the 4xS1m pulldown to probe the interactions of control and candidate 5′ UTR-4xS1m in vitro-transcribed RNAs with WT and hES9S yeast ribosomes. (B) 4xS1m pulldown of candidate 5′ UTR-4xS1m RNA with WT and hES9S yeast ribosomes for three control 5′ UTRs as negative controls and four candidate 5′ UTRs were tested alongside Hoxa9 P4 as a positive control. After the formation of ribosome-RNA RNPs in vitro, beads are split in half for total RNA and protein. Ribosome-RNA RNP enrichment in vitro is monitored by qRT-PCR for tagged 18S and 25S rRNA and other RNA classes normalized to the input (RNA on beads) and by WB. Fold enrichment of RNAs was determined by qRT-PCR using the same volumes of eluted RNA and normalizing Ct values of each sample to their respective RNA input (WT or hES9S). Yeast actin (act1) mRNA and yeast UsnRNA1 serve as negative controls. WB analysis was performed for 40S and 60S subunit RPs of the same volumes of protein released from beads by RNase A. The fraction loaded of input and elution samples is expressed as a percentage of the original lysate volume. The P4-4xS1m/WT sample was used to normalize for RNA fold enrichment (set to 1). Average RNA fold enrichment, SEM, n = 3; ns, not significant; long exp., long exposure. See Figure S6C. (C) Bicistronic mRNA reporter genes containing no insert in the intergenic region (pRF, vector) and candidate or control 5′ UTRs were transiently transfected into mouse C3H10T1/2 cells. Cells were split in half for protein lysates for luciferase activity measurement and total RNA extraction for qRT-PCR analysis. Relative luciferase activity is expressed as a Fluc(IRES)/Rluc(cap-initiation) ratio normalized to respective Fluc/Rluc mRNA levels and expressed as average activity ± SEM, n = 3–8. pRF serves as negative control, the encephalomyocarditis virus (EMCV) and hepatitis C virus (HCV) IRESs serve as IRES controls, EMCV IRES activity was used as a cutoff, and the full-length (FL) Hoxa9 IRES-like element and P4-native served as Hoxa9 IRES-like references.

References

    1. Alasoo K, Martinez FO, Hale C, Gordon S, Powrie F, Dougan G, Mukhopadhyay S, and Gaffney DJ (2015). Transcriptional profiling of macrophages derived from monocytes and iPS cells identifies a conserved response to LPS and novel alternative transcription. Sci. Rep 5, 12524. - PMC - PubMed
    1. Alexa A, Rahnenfiihrer J, and Lengauer T (2006). Improved scoring of functional groups from gene expression data by decorrelating GO graph structure. Bioinformatics 22, 1600–1607. - PubMed
    1. Anger AM, Armache JP, Berninghausen O, Habeck M, Subklewe M, Wilson DN, and Beckmann R (2013). Structures of the human and Drosophila 80S ribosome. Nature 497, 80–85. - PubMed
    1. Appels R, Gerlach WL, Dennis ES, Swift H, and Peacock WJ (1980). Molecular and chromosomal organization of DNA sequences coding for the ribosomal RNAs in cereals. Chromosoma 78, 293–311.
    1. Armache J-P, Jarasch A, Anger AM, Villa E, Becker T, Bhushan S, Jossinet F, Habeck M, Dindar G, Franckenberg S, et al. (2010). Cryo-EM structure and rRNA model of a translating eukaryotic 80S ribosome at 5.5-A resolution. Proc. Natl. Acad. Sci. USA 107, 19748–19753. - PMC - PubMed

Publication types