. 2021 Jan 19;34(3):108640.
doi: 10.1016/j.celrep.2020.108640.

Acute stress drives global repression through two independent RNA polymerase II stalling events in Saccharomyces

Affiliations

Acute stress drives global repression through two independent RNA polymerase II stalling events in Saccharomyces

Nitika Badjatia et al. Cell Rep. .

Abstract

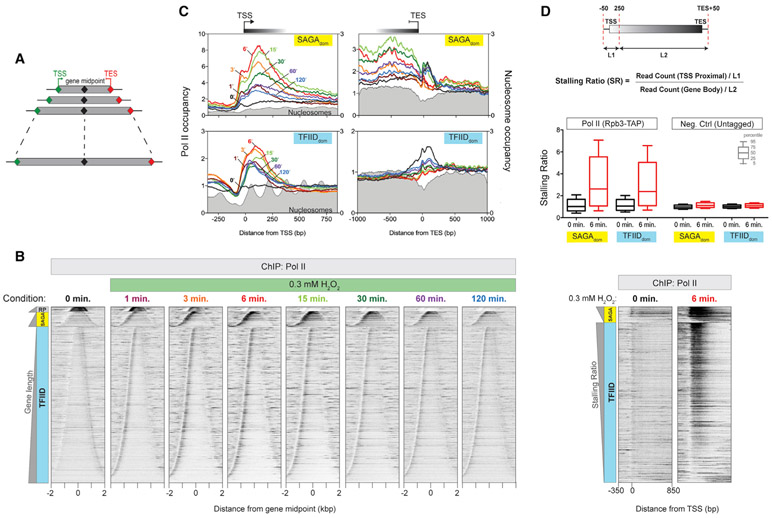
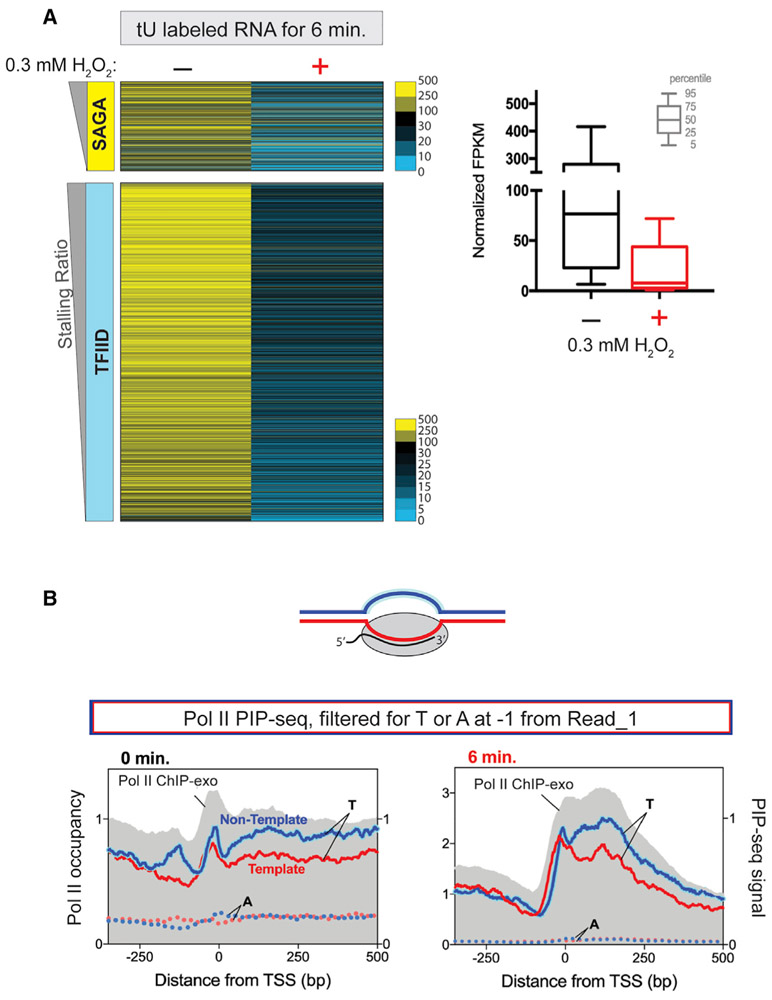
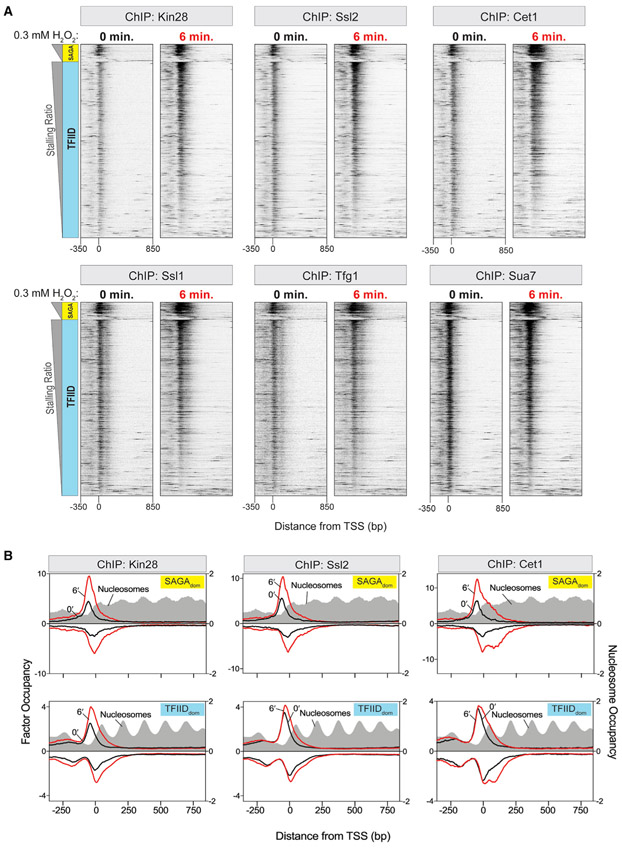
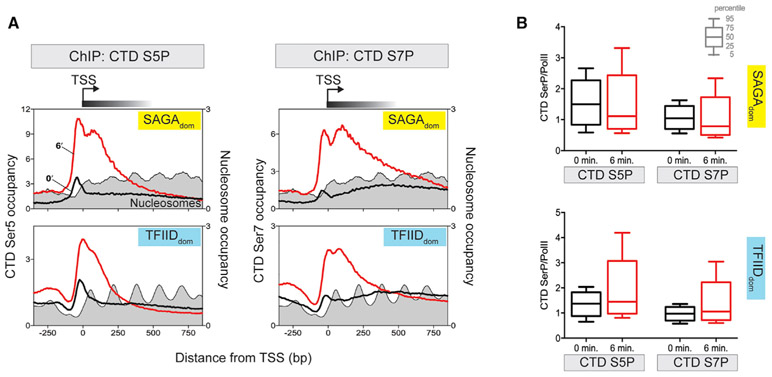
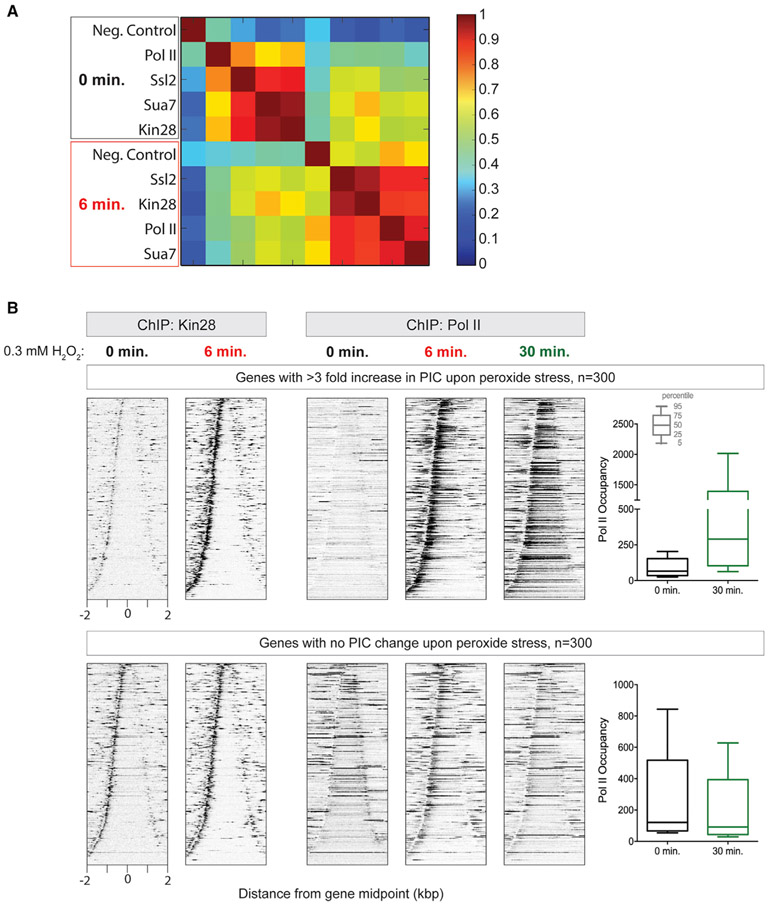
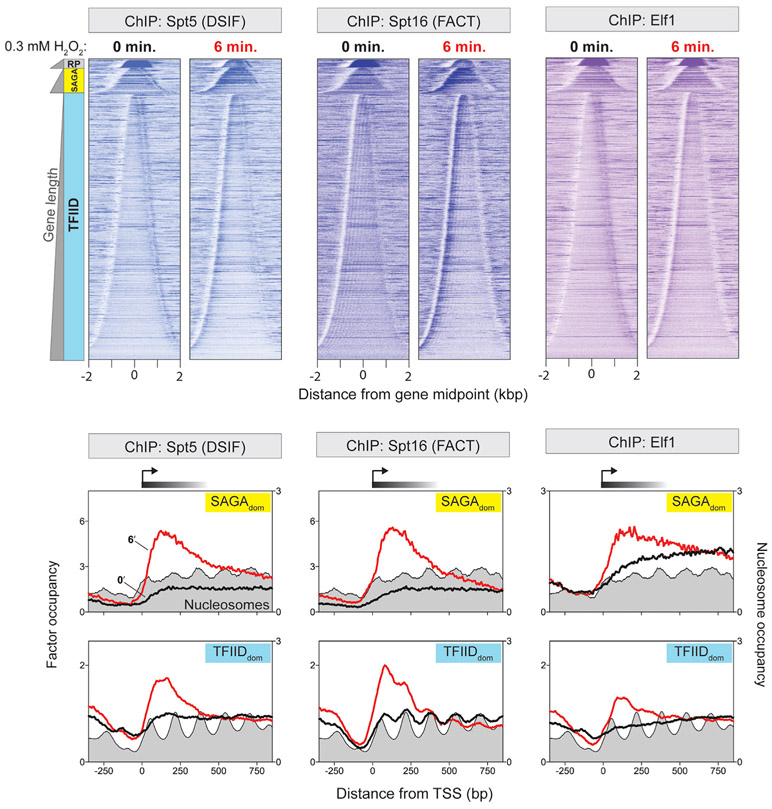
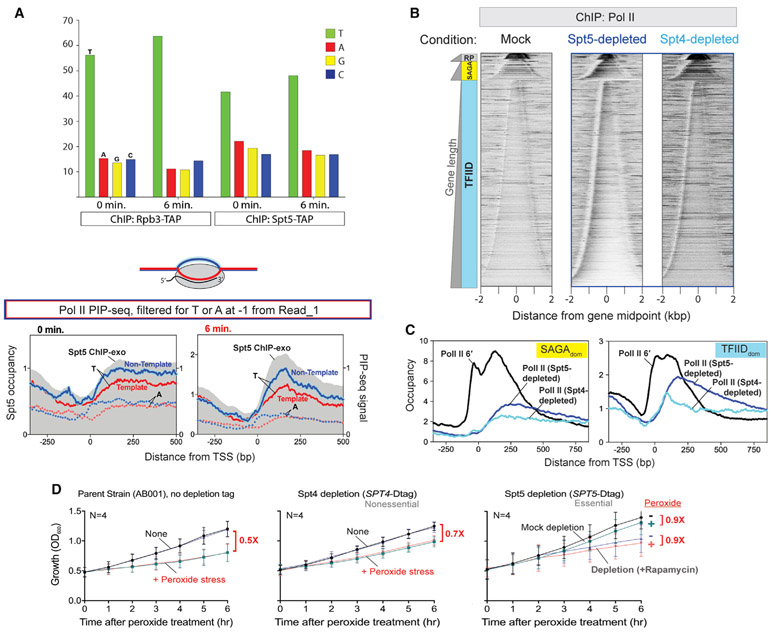
In multicellular eukaryotes, RNA polymerase (Pol) II pauses transcription ~30-50 bp after initiation. While the budding yeast Saccharomyces has its transcription mechanisms mostly conserved with other eukaryotes, it appears to lack this fundamental promoter-proximal pausing. However, we now report that nearly all yeast genes, including constitutive and inducible genes, manifest two distinct transcriptional stall sites that are brought on by acute environmental signaling (e.g., peroxide stress). Pol II first stalls at the pre-initiation stage before promoter clearance, but after DNA melting and factor acquisition, and may involve inhibited dephosphorylation. The second stall occurs at the +2 nucleosome. It acquires most, but not all, elongation factor interactions. Its regulation may include Bur1/Spt4/5. Our results suggest that a double Pol II stall is a mechanism to downregulate essentially all genes in concert.

Keywords: DSIF; Pol II pausing; peroxide stress; promoter-proximal pausing; transcription elongation.


Conflict of interest statement

Declaration of interests B.F.P. is an owner of and has a financial interest in Peconic, which uses the ChIP-exo technology (U.S. Patent 20100323361A1) implemented in this study and could potentially benefit from the outcomes of this research. All other authors declare no competing interests.

Figures

Figure 1.
Figure 1.. RNA Pol II accumulates at the 50′ end of genes upon acute oxidative stress
(A) Illustration of gene-length order in heatmap “bell plots.” (B) Time course for treatment of yeast cells with 0.3 mM H2O2. 50′ ends of Rpb3 ChIP-exo tags are plotted relative to each transcription unit TSS-TES midpoint. Rows are sorted by transcription unit length and grouped by class: ribosomal protein (RP) genes, SAGAdom genes (SAGA), and TFIIDdom genes (TFIID). All rows across datasets are linked. Datasets are normalized using total tag count. (C) Composite plots comparing the datasets shown in (B) at the TSS (left) and TES (right) of SAGAdom and TFIIDdom genes, respectively. Only tail-to-tail (convergently transcribed, sharing the same termination region) genes are shown at the bottom right. Midpoints of micrococcal nuclease (MNase) ChIP-seq paired-end reads for nucleosomes are indicated in filled gray plots. Datasets are normalized using total tag counts. (D) Top: calculation of the stalling ratio, where “L” denotes the indicated genomic interval in base pairs. Middle: boxplot for the SR of Pol II and negative controls at SAGAdom and TFIIDdom genes, before and after 6 min of treatment with 0.3 mM H2O2. Calculations are based on three independent replicates. Percentile values are indicated by the key. Bottom: heatmaps of Pol II at 0 and 6 min post-treatment of yeast cells with 0.3 mM H2O2. 5′ ends of Rpb3 ChIP-exo tags were plotted. Rows are sorted by high to low stalling ratio (SR) and grouped by SAGAdom and TFIIDdom gene class. All rows across datasets are linked. Datasets are normalized using total tag count. See also Figure S1.
Figure 2.
Figure 2.. Nascent transcription is reduced upon acute peroxide stress
(A) The heatmap panel indicates FPKM values of 4-tU-labeled nascent RNA for 6 min with or without treatment with 0.3 mM H2O2 for SAGAdom and TFIIDdom genes. The boxplot indicates FPKM aggregated values for untreated and peroxidetreated cells for all protein coding genes. Percentile values are indicated by the key. (B) The cartoon depicts Pol II engaged in a transcription bubble. Composite plots are indicated for PIP-seq reads at the TSSs of all coding genes (except RP), filtered for T (or A as a negative control) at −1 from the sequenced Read_1 5′ end, under normal (left panel) and stress (right panel) conditions. Single-stranded non-template DNA is highlighted in blue. 5′ ends of Pol II ChIP-exo reads are indicated in gray.
Figure 3.
Figure 3.. Promoter Stalling Is Not due to Loss of Promoter Binding Factors
(A) Heatmaps of various PIC subunits (and capping enzyme Cet1) at 0 and 6 min post-treatment of yeast cells with 0.3 mM H2O2. 5′ ends of ChIP-exo tags were plotted. Rows are sorted by high to low stalling ratio (SR) and grouped by class: SAGAdom (SAGA) and TFIIDdom genes (TFIID). All rows across datasets are linked. Datasets are normalized using total tag count. (B) Strand-separated composites of PIC subunit occupancy at the TSS. Data from the non-transcribed strand are plotted on an inverted scale. Midpoints of MNase ChIP-seq reads for nucleosomes are indicated as filled gray plots. Datasets are normalized using total tag count.
Figure 4.
Figure 4.. CTD S5P and S7P are maintained at stalled Pol II
(A) Composite plots comparing Pol II CTD S5P and S7P at the TSSs of SAGAdom and TFIIDdom genes, respectively, at 0 and 6 min post-treatment with 0.3 mM H2O2. 5′ ends of ChIP-exo tags were plotted. Midpoints of paired-end MNase ChIP-seq reads for nucleosomes are indicated in filled gray plots. Datasets are normalized using total tag count. (B) Boxplot for the fold change in the TSS-proximal (−50 to +250 bp from the TSS) occupancy of S5P and S7P normalized to Pol II (Rpb3) upon 6 min of treatment with 0.3 mM H2O2. Calculations are based on three independent replicates of CTD S5P and S7P and Rpb3 ChIP-exo. Percentile values are indicated by the key.
Figure 5.
Figure 5.. Increased PIC occupancy leads to more Pol II stalling early and more Pol II elongation later in the stress response
(A) Heatmap representing Pearson correlation coefficient (r2) for TSS-proximal (−250 bp to +250 bp from the TSS) occupancy of PIC components and Pol II before and after 6 min of treatment with 0.3 mM H2O2. (B) Heatmap distributions of Kin28 and Pol II at genes with increased PIC (top) or no change in PIC (bottom) occupancy upon stress. 5′ ends of ChIP-exo tags were plotted relative to transcription unit midpoints. Rows are sorted by unit length. Datasets are normalized using total tag count. Boxplots for the gene body occupancy of Pol II before and after 30 min of treatment with 0.3 mM H2O2 for genes indicated in the top and bottom heatmaps. Percentile values are indicated by the key. A ratio between Ssl2 tag counts from ±250 bp from the TSS in unstressed versus stressed cells was used to identify the top 300 genes in Ssl2 occupancy change upon stress (Ssl26min/Ssl20min) and 300 genes that had the highest Ssl2 occupancy (Ssl20min) but also little or no change in Ssl2 upon stress (Ssl26min/Ssl20min = 0.8–1.2).
Figure 6.
Figure 6.. Recruitment of elongation factors to stalled Pol II
Heatmaps show the distribution of Spt5, Spt16, and Elf1 relative to transcription unit midpoints at 0 and 6 min post-treatment with 0.3 mM H2O2. 5′ ends of ChIP-exo tags were plotted. Rows are sorted by unit length and grouped by class: Ribosomal protein genes (RP), SAGAdom (SAGA), and TFIIDdom genes (TFIID). All rows across datasets are linked. Composite plots for SAGAdom and TFIIDdom genes aligned by TSS are indicated. Midpoints of MNase ChIP-seq reads for nucleosome are indicated as gray-filled plots. See also Figures S2 and S3.
Figure 7.
Figure 7.. Spt5/Spt4 nuclear depletion largely phenocopies peroxide-induced Pol II stalling
(A) Bar graph indicating relative distribution of nucleotides at the −1 position relative to the 5′ end of Read_1. Below are composite plots of Spt5 PIP-seq reads (filtered for T or A at −1 from Read_1 5′ ends) under normal and stress conditions aligned by TSSs of all coding genes (except RP). Non-template (transcribed) strands are highlighted in blue, and template strands are highlighted in red. 5′ ends of Spt5 ChIP-exo reads are indicated in gray. (B) Distribution of Pol II by ChIP-exo upon Mock Spt5 depletion or upon depletion of Spt5 or Spt4 from the nucleus (30 min with rapamycin; Spt4 depletion additionally contained indoleacetic acid). Tag 5′ ends were plotted relative to transcription unit midpoints. Rows are sorted by unit length and grouped by gene class: ribosomal protein (RP), SAGAdom (SAGA), and TFIIDdom (TFIID). All rows across datasets are linked. (C) Composite plots from data in (B) are compared to plots of Pol II stalling (6 min of 0.3 mM peroxide) aligned by TSSs of SAGAdom and TFIIDdom genes. (D) Effect of Spt4/5 depletion and oxidative stress on growth rate. Growth time course is given for the indicated strains in each panel, in response to 0.3 mM hydrogen peroxide (“+ Peroxide stress”) or mock controls (“None” or “-”). Strains were either depleted of the indicated protein using rapamycin anchor away (blue and red traces) or had no deletion (black and green traces). Values indicated in red reflect growth rates upon peroxide treatment relative to mock controls, calculated using the LINEST function in Excel for ln OD600 (optical density 600) values measured in the linear range of the spectrophotometer (empirically determined to be below OD600 = 1.1). Actual values from left to right are (no rapamycin, plus rapamycin): 0.507, 0.521, 0.654, 0.764, 0.938, and 0.852. See also Figures S4-S7.

References

    1. Adelman K, and Lis JT (2012). Promoter-proximal pausing of RNA polymerase II: emerging roles in metazoans. Nat. Rev. Genet 13, 720–731. - PMC - PubMed
    1. Akoulitchev S, Mäkelä TP, Weinberg RA, and Reinberg D (1995). Requirement for TFIIH kinase activity in transcription by RNA polymerase II. Nature 377, 557–560. - PubMed
    1. Allen TA, Von Kaenel S, Goodrich JA, and Kugel JF (2004). The SINE-encoded mouse B2 RNA represses mRNA transcription in response to heat shock. Nat. Struct. Mol. Biol 11, 816–821. - PubMed
    1. Baptista T, and Devys D (2018). Saccharomyces cerevisiae Metabolic Labeling with 4-thiouracil and the Quantification of Newly Synthesized mRNA As a Proxy for RNA Polymerase II Activity. J. Vis. Exp (140), 57982. - PMC - PubMed
    1. Bataille AR, Jeronimo C, Jacques PE, Laramée L, Fortin ME, Forest A, Bergeron M, Hanes SD, and Robert F (2012).A universal RNA polymerase II CTD cycle is orchestrated by complex interplays between kinase, phosphatase, and isomerase enzymes along genes. Mol. Cell 45, 158–170. - PubMed

Publication types

MeSH terms

Substances