

Heat shock protein 22 modulates NRF1/TFAM-dependent mitochondrial biogenesis and DRP1-sparked mitochondrial apoptosis through AMPK-PGC1α signaling pathway to alleviate the early brain injury of subarachnoid hemorrhage in rats
- PMID: 33472123
- PMCID: PMC7816003
- DOI: 10.1016/j.redox.2021.101856
Heat shock protein 22 modulates NRF1/TFAM-dependent mitochondrial biogenesis and DRP1-sparked mitochondrial apoptosis through AMPK-PGC1α signaling pathway to alleviate the early brain injury of subarachnoid hemorrhage in rats
Abstract
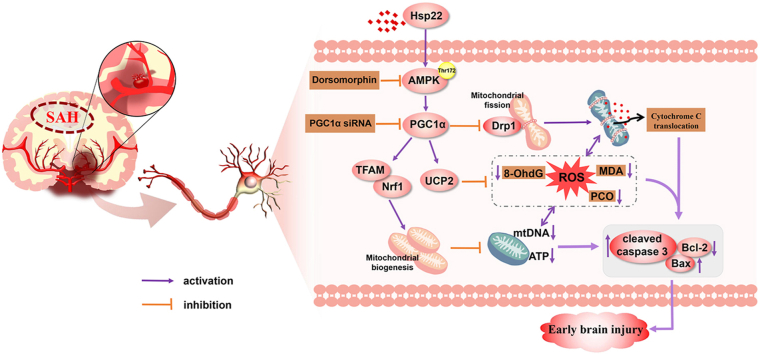
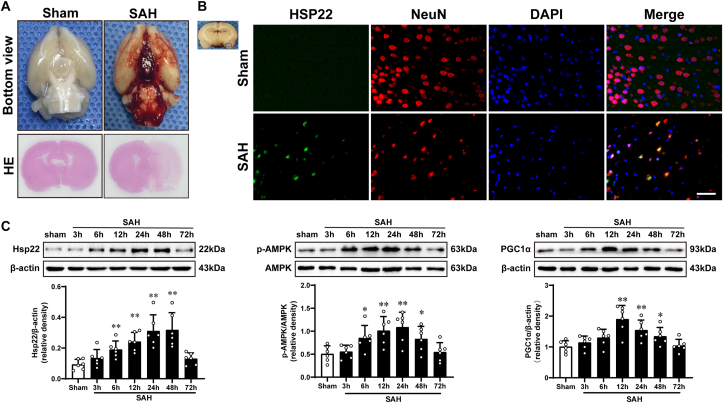
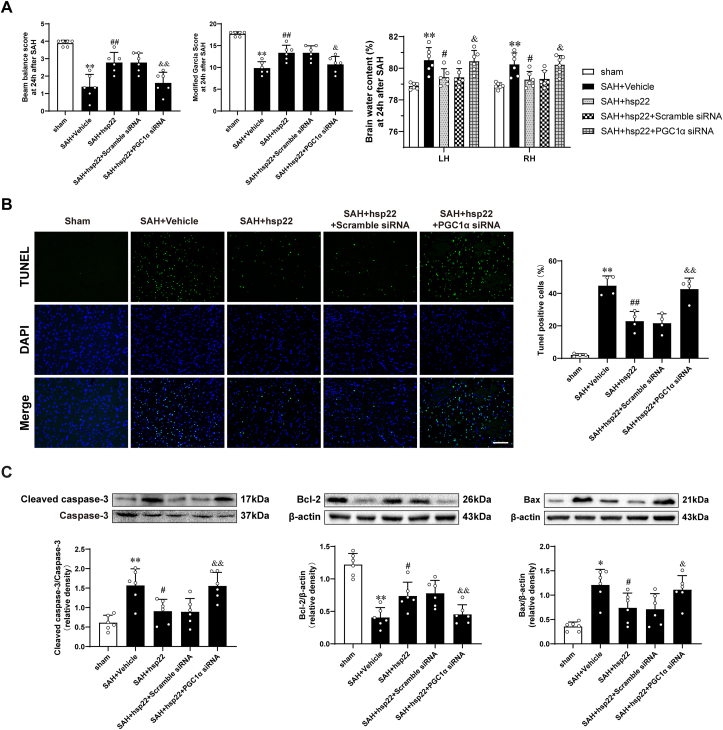
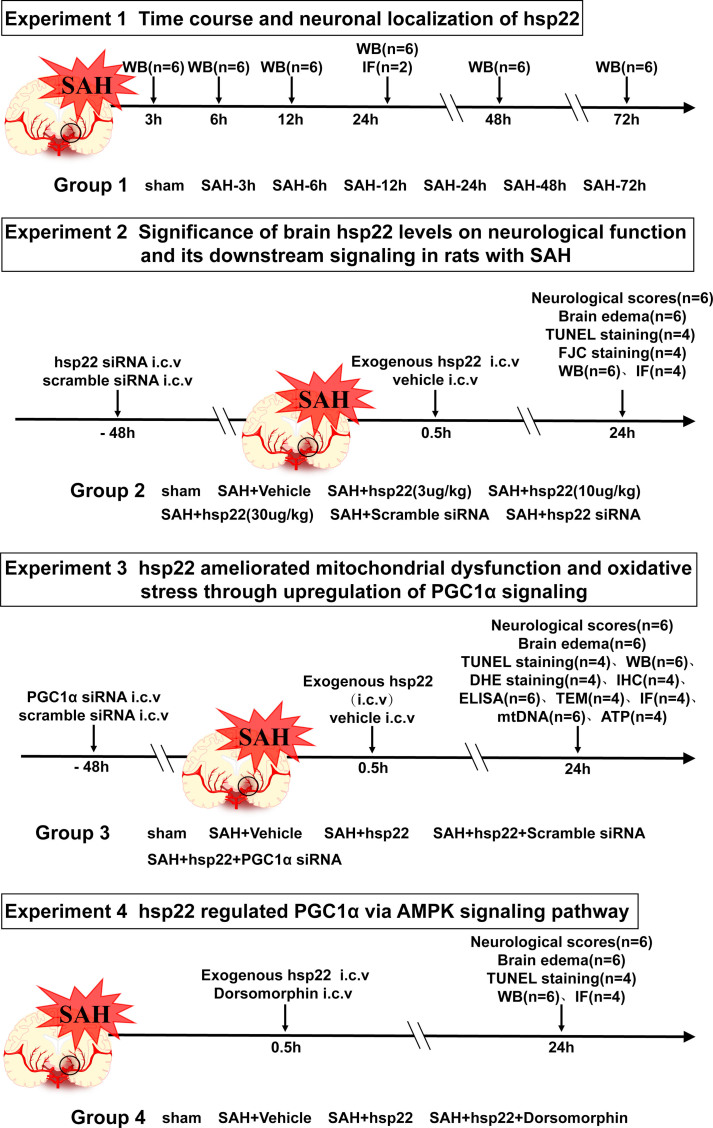
Mitochondrial dysfunction has been widely accepted as a detrimental factor in subarachnoid hemorrhage (SAH)-induced early brain injury (EBI), which is eminently related to poor neurologic function outcome. Previous studies have revealed that enhancement of heat shock protein 22 (hsp22) under conditions of stress is a friendly mediator of mitochondrial homeostasis, oxidative stress and apoptosis, thus accelerating neurological recovery. However, no study has confirmed whether hsp22 attenuates mitochondrial stress and apoptosis in the setting of SAH-induced EBI. Our results indicated that endogenous hsp22, p-AMPK/AMPK, PGC1α, TFAM, Nrf1 and Drp1 were significantly upregulated in cortical neurons in response to SAH, accompanied by neurologic impairment, brain edema, neuronal degeneration, lower level of mtDNA and ATP, mitochondria-cytosol translocation of cytochrome c, oxidative injury and caspase 3-involved mitochondrial apoptosis. However, exogenous hsp22 maintained neurological function, reduced brain edema, improved oxidative stress and mitochondrial apoptosis, these effects were highly dependent on PGC1α-related mitochondrial biogenesis/fission, as evidenced by co-application of PGC1α siRNA. Furthermore, we demonstrated that blockade of AMPK with dorsomorphin also compromised the neuroprotective actions of hsp22, along with the alterations of PGC1α and its associated pathway molecules. These data revealed that hsp22 exerted neuroprotective effects by salvaging mitochondrial function in an AMPK-PGC1α dependent manner, which modulates TFAM/Nrf1-induced mitochondrial biogenesis with positive feedback and DRP1-triggered mitochondrial apoptosis with negative feedback, further reducing oxidative stress and brain injury. Boosting the biogenesis and repressing excessive fission of mitochondria by hsp22 may be an efficient treatment to relieve SAH-elicited EBI.
Keywords: AMPK-PGC1α; Heat shock protein 22; Mitochondria; Subarachnoid hemorrhage.
Copyright © 2021 The Authors. Published by Elsevier B.V. All rights reserved.
Conflict of interest statement
The authors report no conflicts of interest in this work.
Figures


Similar articles
-
Heat Shock Protein 22 Attenuates Nerve Injury-induced Neuropathic Pain Via Improving Mitochondrial Biogenesis and Reducing Oxidative Stress Mediated By Spinal AMPK/PGC-1α Pathway in Male Rats.J Neuroimmune Pharmacol. 2024 Feb 6;19(1):5. doi: 10.1007/s11481-024-10100-6. J Neuroimmune Pharmacol. 2024. PMID: 38319409
-
Melanocortin 1 receptor attenuates early brain injury following subarachnoid hemorrhage by controlling mitochondrial metabolism via AMPK/SIRT1/PGC-1α pathway in rats.Theranostics. 2021 Jan 1;11(2):522-539. doi: 10.7150/thno.49426. eCollection 2021. Theranostics. 2021. PMID: 33391490 Free PMC article.
-
Dopamine-D2-agonist targets mitochondrial dysfunction via diminishing Drp1 mediated fission and normalizing PGC1-α/SIRT3 pathways in a rodent model of Subarachnoid Haemorrhage.Neuroscience. 2025 Jan 9;564:60-78. doi: 10.1016/j.neuroscience.2024.11.028. Epub 2024 Nov 13. Neuroscience. 2025. PMID: 39542343
-
PGC1α and mitochondrial metabolism--emerging concepts and relevance in ageing and neurodegenerative disorders.J Cell Sci. 2012 Nov 1;125(Pt 21):4963-71. doi: 10.1242/jcs.113662. J Cell Sci. 2012. PMID: 23277535 Review.
-
PPARγ/PGC1α signaling as a potential therapeutic target for mitochondrial biogenesis in neurodegenerative disorders.Pharmacol Ther. 2021 Mar;219:107705. doi: 10.1016/j.pharmthera.2020.107705. Epub 2020 Oct 9. Pharmacol Ther. 2021. PMID: 33039420 Free PMC article. Review.
Cited by
-
Mitochondrial Quality Control in Health and Disease.MedComm (2020). 2025 Aug 15;6(8):e70319. doi: 10.1002/mco2.70319. eCollection 2025 Aug. MedComm (2020). 2025. PMID: 40821693 Free PMC article. Review.
-
Microglial STING activation promotes neuroinflammation and pathological changes in experimental mice with intracerebral haemorrhage.Acta Pharmacol Sin. 2025 Sep;46(9):2376-2392. doi: 10.1038/s41401-025-01540-8. Epub 2025 Apr 8. Acta Pharmacol Sin. 2025. PMID: 40200123
-
Exercise activates Sirt1-mediated Drp1 acetylation and inhibits hepatocyte apoptosis to improve nonalcoholic fatty liver disease.Lipids Health Dis. 2023 Mar 7;22(1):33. doi: 10.1186/s12944-023-01798-z. Lipids Health Dis. 2023. PMID: 36882837 Free PMC article.
-
Quercetin, Engelitin and Caffeic Acid of Smilax china L. Polyphenols, Stimulate 3T3-L1 Adipocytes to Brown-like Adipocytes Via β3-AR/AMPK Signaling Pathway.Plant Foods Hum Nutr. 2022 Dec;77(4):529-537. doi: 10.1007/s11130-022-00996-x. Epub 2022 Aug 20. Plant Foods Hum Nutr. 2022. PMID: 35986845
-
Chaperones vs. oxidative stress in the pathobiology of ischemic stroke.Front Mol Neurosci. 2024 Dec 11;17:1513084. doi: 10.3389/fnmol.2024.1513084. eCollection 2024. Front Mol Neurosci. 2024. PMID: 39723236 Free PMC article. Review.
References
-
- Xin Z., Tamrakar K., Zhi-Qiang Y., Chuan-Zhi D. High wall shear stress beyond a certain range in the parent artery could predict the risk of anterior communicating artery aneurysm rupture at follow-up. J. Neurosurg. 2018;131:868–875. - PubMed
-
- Macdonald R.L., Schweizer T.A. Spontaneous subarachnoid haemorrhage. Lancet. 2017;389(10069):655–666. - PubMed
-
- Cahill W.J., Calvert J.H., Zhang J.H. Mechanisms of early brain injury after subarachnoid hemorrhage. J. Cerebr. Blood Flow Metabol. 2006;26(11):1341–1353. - PubMed
Publication types
MeSH terms
Substances
LinkOut - more resources
Full Text Sources
Other Literature Sources
Molecular Biology Databases
Research Materials
Miscellaneous
