

No detectable alloreactive transcriptional responses under standard sample preparation conditions during donor-multiplexed single-cell RNA sequencing of peripheral blood mononuclear cells
- PMID: 33472616
- PMCID: PMC7816397
- DOI: 10.1186/s12915-020-00941-x
No detectable alloreactive transcriptional responses under standard sample preparation conditions during donor-multiplexed single-cell RNA sequencing of peripheral blood mononuclear cells
Abstract
Background: Single-cell RNA sequencing (scRNA-seq) provides high-dimensional measurements of transcript counts in individual cells. However, high assay costs and artifacts associated with analyzing samples across multiple sequencing runs limit the study of large numbers of samples. Sample multiplexing technologies such as MULTI-seq and antibody hashing using single-cell multiplexing kit (SCMK) reagents (BD Biosciences) use sample-specific sequence tags to enable individual samples to be sequenced in a pooled format, markedly lowering per-sample processing and sequencing costs while minimizing technical artifacts. Critically, however, pooling samples could introduce new artifacts, partially negating the benefits of sample multiplexing. In particular, no study to date has evaluated whether pooling peripheral blood mononuclear cells (PBMCs) from unrelated donors under standard scRNA-seq sample preparation conditions (e.g., 30 min co-incubation at 4 °C) results in significant changes in gene expression resulting from alloreactivity (i.e., response to non-self). The ability to demonstrate minimal to no alloreactivity is crucial to avoid confounded data analyses, particularly for cross-sectional studies evaluating changes in immunologic gene signatures.
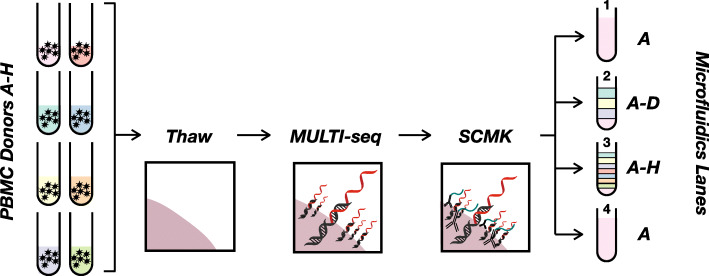
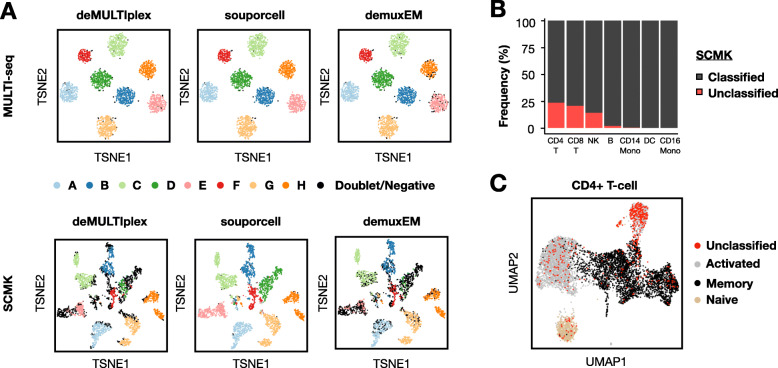
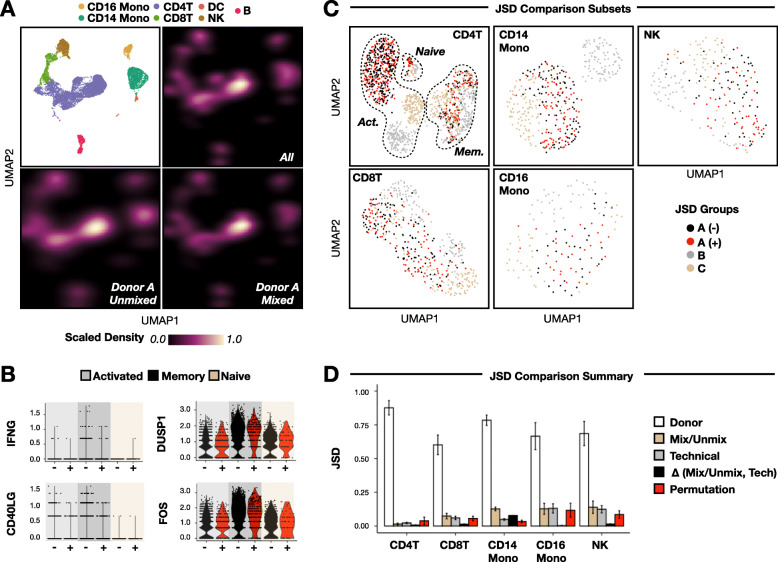
Results: Here, we applied the 10x Genomics scRNA-seq platform to MULTI-seq and/or SCMK-labeled PBMCs from a single donor with and without pooling with PBMCs from unrelated donors for 30 min at 4 °C. We did not detect any alloreactivity signal between mixed and unmixed PBMCs across a variety of metrics, including alloreactivity marker gene expression in CD4+ T cells, cell type proportion shifts, and global gene expression profile comparisons using Gene Set Enrichment Analysis and Jensen-Shannon Divergence. These results were additionally mirrored in publicly-available scRNA-seq data generated using a similar experimental design. Moreover, we identified confounding gene expression signatures linked to PBMC preparation method (e.g., Trima apheresis), as well as SCMK sample classification biases against activated CD4+ T cells which were recapitulated in two other SCMK-incorporating scRNA-seq datasets.
Conclusions: We demonstrate that (i) mixing PBMCs from unrelated donors under standard scRNA-seq sample preparation conditions (e.g., 30 min co-incubation at 4 °C) does not cause an allogeneic response, and (ii) that Trima apheresis and PBMC sample multiplexing using SCMK reagents can introduce undesirable technical artifacts into scRNA-seq data. Collectively, these observations establish important benchmarks for future cross-sectional immunological scRNA-seq experiments.
Keywords: Alloreactivity; PBMCs; Sample multiplexing; Sample preparation; scRNA-seq.
Conflict of interest statement
Z.J.G. and C.S.M. have filed patent applications related to the MULTI-seq barcoding method.
Figures
References
Publication types
MeSH terms
Grants and funding
LinkOut - more resources
Full Text Sources
Other Literature Sources
Molecular Biology Databases
Research Materials
