Review
. 2021 Jan 20;9(1):16.
doi: 10.1186/s40168-020-00955-1.

Understanding the host-microbe interactions using metabolic modeling

Affiliations
Review

Understanding the host-microbe interactions using metabolic modeling

Jack Jansma et al. Microbiome. .

Abstract

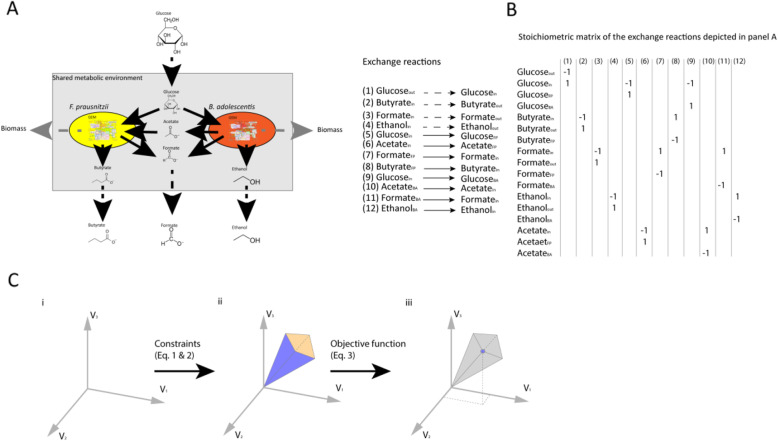
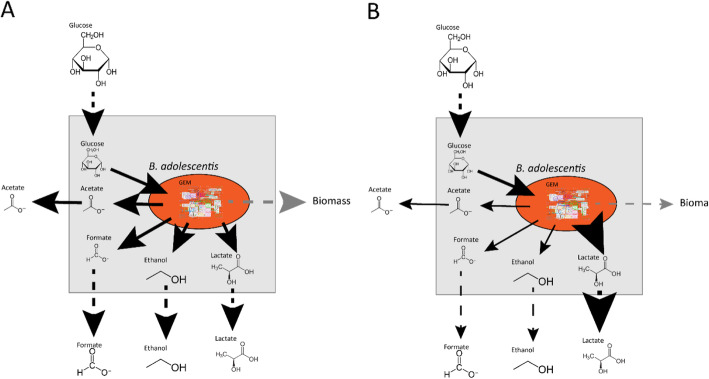
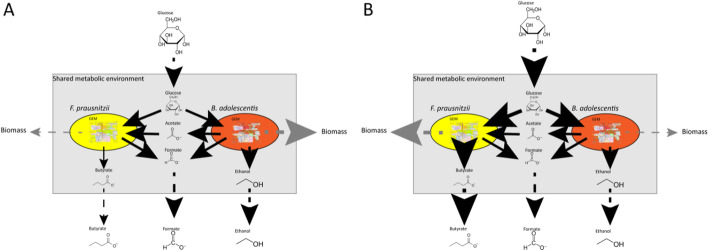
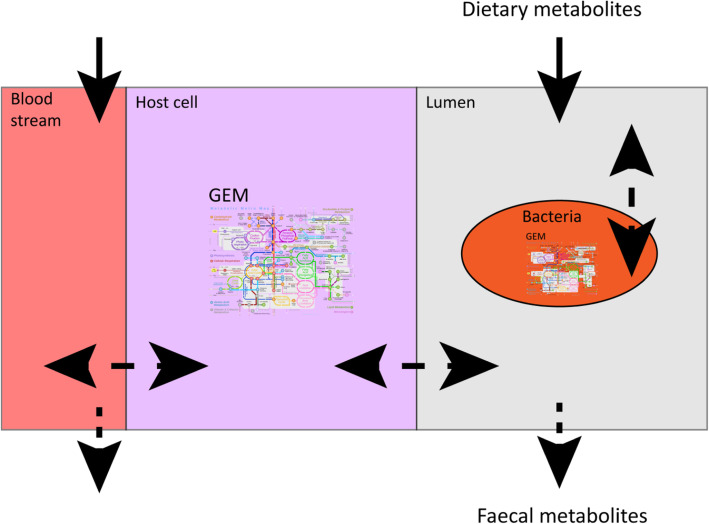
The human gut harbors an enormous number of symbiotic microbes, which is vital for human health. However, interactions within the complex microbiota community and between the microbiota and its host are challenging to elucidate, limiting development in the treatment for a variety of diseases associated with microbiota dysbiosis. Using in silico simulation methods based on flux balance analysis, those interactions can be better investigated. Flux balance analysis uses an annotated genome-scale reconstruction of a metabolic network to determine the distribution of metabolic fluxes that represent the complete metabolism of a bacterium in a certain metabolic environment such as the gut. Simulation of a set of bacterial species in a shared metabolic environment can enable the study of the effect of numerous perturbations, such as dietary changes or addition of a probiotic species in a personalized manner. This review aims to introduce to experimental biologists the possible applications of flux balance analysis in the host-microbiota interaction field and discusses its potential use to improve human health. Video abstract.

Keywords: Flux balance analysis; Gut microbiota; Metabolic model; Microbial community; Probiotics.


Conflict of interest statement

The authors declare no conflicts of interest.

Figures

Fig. 1
Fig. 1
Application of flux balance analysis to simulate a metabolic interaction among multiple bacteria. a A metabolic network of a bacterial community consisting of Faecalibacterium prausntizii and Bifidobacterium adolescentis (adapted after El-Semman et al. [20]). Fluxes of the exchange reactions are represented by arrows. Solid black arrows indicate uptake, and secretion reactions of the bacteria, dashed black arrows indicate the flow of metabolites in or out of the system, and dashed grey arrows indicate the formation of new biomass, where metabolites cannot be secreted by the bacteria anymore, thus leaving the system. b Stoichiometric matrix of the exchange reactions depicted in panel a. BA depicts B. adolescentis and FP depicts F. prausnitzii. c Visual representation of the concept of flux balance analysis; (i) A solution space of the flux distribution in a system; (ii) The allowable solution space is the result of addition of constraints depicted in Eqs. 1 and 2, which equations limit the available flux distributions; (iii) Addition of an objective function as depicted in Eq. 3 determines the optimal solution for the flux distribution in the system. Adapted after Orth et al. [3].
Fig. 2
Fig. 2
Representation of the use of FBA in metabolic modeling of an organism. The OF in panels a and b is maximizing the production of the biomass. The thickness of the arrows indicate the amount of flux, where a thicker arrow indicates a higher flux. When the production of lactate is manually altered in panel b, the flux distribution changes, whereby the flux of acetate, formate, ethanol, and biomass is lowered compared to panel a. Adapted after El-Semman et al. [20]
Fig. 3
Fig. 3
Representation of the use of FBA in the modeling of a bacterial community consisting of two gut bacteria: F. prausnitzii and B. adolescentis. Fluxes are represented by arrows. Solid black arrows indicate uptake and secretion reactions of the bacteria, dashed black arrows indicate the flow of metabolites in and out of the system and dashed grey arrows indicate the formation of new biomass, where metabolites can no longer be secreted by the bacteria, thus leaving the system. The amount of flux is represented by the thickness of the arrows, a higher flux is a thicker arrow. The ratio of the produced biomass is used as a measure for the number of F. prausnitzii and B. adolescentis in the system, whereby the total biomass is kept constant. A higher flux through the biomass reaction represents more bacteria of that species in the system. The OF is the minimization of glucose uptake for both bacteria. Adapted after El-Semman et al. [20]
Fig. 4
Fig. 4
Representation of the use of FBA to study the complex host-microbe interactions. A bacterial metabolic compartment is placed in a compartment which is connected to a metabolic compartment representing a host cell. The host cell compartment is connected to another compartment representing the bloodstream of the host. Arrows between the different compartments indicate exchange reactions. Solid arrows represent influx of metabolites into the system, which represents metabolites originating from the diet and/or metabolites present in the bloodstream. Dashed arrows represent efflux of metabolites out of the system symbolizing metabolites excreted in feces and/or translocating in the bloodstream
Fig. 5
Fig. 5
Representation of the use of empty compartments in studying the gut microbiota. The metabolic compartments indicated with grey squares are organized in a two-dimensional grid. Each bacterium has its own metabolic compartment. Exchange of metabolites takes place between the bacterium and its own metabolic compartment. Metabolic exchange can also take place between adjacent metabolic compartments. The metabolic compartments without any bacterium can still exchange metabolites with the adjacent compartments. In this way, metabolic gradients occur. Introduction of a time step to a grid of compartments gives the opportunity to include movement and division of bacteria. a Bacterial community at the start of a simulation, movement is indicated with black, curved arrows and division is indicated with grey arrows. b After a time step, some cells move and others divide, resulting in a different distribution of bacteria in the grid
Fig. 6
Fig. 6
Representation of the application of FBA to study the effect of adding probiotic species in a bacterial community consisting of two gut bacteria, F. prausnitzii and B. adolescentis. Fluxes are represented by arrows. Solid black arrows indicate uptake and secretion reactions of the bacteria, dashed black arrows indicate the flow of metabolites in and out of the system and dashed grey arrows indicate the formation of new biomass, where metabolites can no longer be secreted by the bacteria, thus leaving the system. The amount of flux is represented by the thickness of the arrows, a higher flux is a thicker arrow. a The community depicted in Fig. 3Adapted after El-Semman et al. [20]. b Addition of another species to the shared metabolic environment will change the flux distribution of the whole system. The added species might produce a metabolite, which the other species can use, resulting in new products. Similarly, the abundance distribution of the community may change in response to the addition of a new bacterium. A change in abundance distribution of the community is depicted an altered flux through each biomass function

Similar articles

Cited by

References

    1. Li M, Wang B, Zhang M, Rantalainen M, Wang S, Zhou H, et al. Symbiotic gut microbes modulate human metabolic phenotypes. Proc Natl Acad Sci. 2008;105(6):2117–2122. doi: 10.1073/pnas.0712038105. - DOI - PMC - PubMed
    1. Ahmed I, Roy B, Khan S, Septer S, Umar S. Microbiome, metabolome and inflammatory bowel disease. Microorganisms. 2016;4(2):20. doi: 10.3390/microorganisms4020020. - DOI - PMC - PubMed
    1. Grigorescu I, Dumitrascu DL. Implication of gut microbiota in diabetes mellitus and obesity, vol. 12, Acta Endocrinologica Foundation. 2016. pp. 206–214. - PMC - PubMed
    1. Xu M, Xu X, Li J, Li F. Association between gut microbiota and autism spectrum disorder: a systematic review and meta-analysis, vol. 10, Frontiers media S.a. 2019. - PMC - PubMed
    1. Cheung SG, Goldenthal AR, Uhlemann AC, Mann JJ, Miller JM, Sublette ME. Systematic review of gut microbiota and major depression, vol. 10, Frontiers media S.a. 2019. - PMC - PubMed