. 2021 Jan 20;9(1):12.
doi: 10.1186/s40560-020-00516-6.

Advanced echocardiographic phenotyping of critically ill patients with coronavirus-19 sepsis: a prospective cohort study

Affiliations

Advanced echocardiographic phenotyping of critically ill patients with coronavirus-19 sepsis: a prospective cohort study

François Bagate et al. J Intensive Care. .

Abstract

Background: Sepsis is characterized by various hemodynamic alterations which could happen concomitantly in the heart, pulmonary and systemic circulations. A comprehensive demonstration of their interactions in the clinical setting of COVID-19 sepsis is lacking. This study aimed at evaluating the feasibility, clinical implications, and physiological coherence of the various indices of hemodynamic function and acute myocardial injury (AMI) in COVID-19 sepsis.

Methods: Hemodynamic and echocardiographic data of septic critically ill COVID-19 patients were prospectively recorded. A dozen hemodynamic indices exploring contractility and loading conditions were assessed. Several cardiac biomarkers were measured, and AMI was considered if serum concentration of high-sensitive troponin T (hs-TNT) was above the 99th percentile, upper reference.

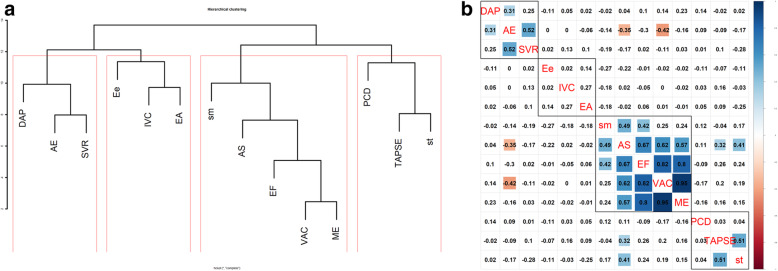
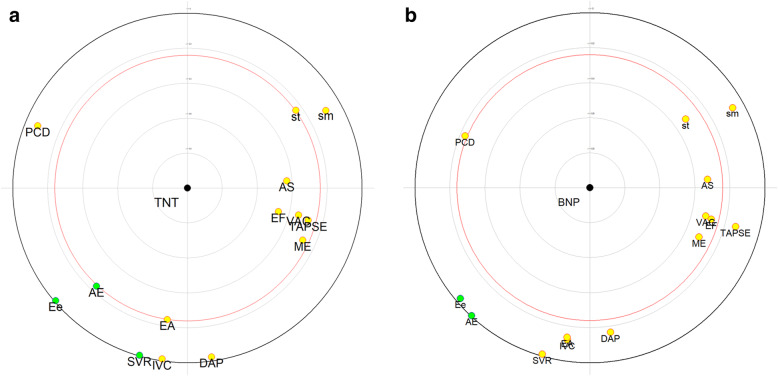
Results: Sixty-seven patients were assessed (55 males), with a median age of 61 [50-70] years. Overall, the feasibility of echocardiographic parameters was very good, ranging from 93 to 100%. Hierarchical clustering method identified four coherent clusters involving cardiac preload, left ventricle (LV) contractility, LV afterload, and right ventricle (RV) function. LV contractility indices were not associated with preload indices, but some of them were positively correlated with RV function parameters and negatively correlated with a single LV afterload parameter. In most cases (n = 36, 54%), echocardiography results prompted therapeutic changes. Mortality was not influenced by the echocardiographic variables in multivariable analysis. Cardiac biomarkers' concentrations were most often increased with high incidence of AMI reaching 72%. hs-TNT was associated with mortality and inversely correlated with most of LV and RV contractility indices.

Conclusions: In this comprehensive hemodynamic evaluation in critically ill COVID-19 septic patients, we identified four homogeneous and coherent clusters with a good feasibility. AMI was common and associated with alteration of LV and RV functions. Echocardiographic assessment had a clinical impact on patient management in most cases.

Keywords: Afterload; COVID-19; Cardiac dysfunction; Sepsis.


Conflict of interest statement

The authors declare that they have no competing interests.

Figures

Fig. 1
Fig. 1
Feasibility of measuring echocardiographic parameters in critically ill patients with coronavirus-19 sepsis. VAC, ventricular-arterial coupling; EF, LV ejection fraction in %; IVC, maximal diameter of inferior vena cava in mm; SVR, systemic vascular resistance in mmHg L−1 min; ME, LV end-systolic maximal elastance in mmHg mL−1; AE, end-systolic arterial elastance in mmHg mL−1; sm, tissue Doppler peak systolic wave at lateral mitral annulus in cm s−1; Ee, ratio of early pulsed-wave Doppler to early tissue Doppler diastolic wave velocity at the lateral mitral valve annulus; st, tissue Doppler peak systolic wave at tricuspid lateral annulus in cm s−1; TAPSE, tricuspid annulus plane systolic excursion in mm; EA, ratio of early to late diastolic wave velocity at the mitral valve; AS, absolute values of global LV longitudinal peak systolic strain in %; PCD, pulmonary circulatory dysfunction
Fig. 2
Fig. 2
Hierarchical clustering (a) and matrix correlation (b) of contractility and loading condition indices in critically ill patients with coronavirus-19 sepsis. In a, the parameters were reordered using computerized hierarchical clustering with the corrplot package of R statistical environment. Hierarchical clustering is a statistical method for finding comparatively homogeneous clusters of cases based on measured characteristics. The analysis starts with each case as a separate cluster (i.e., there are as many clusters as cases), and then combines the clusters sequentially, reducing the number of clusters at each step. The clustering method uses the dissimilarities between objects. The algorithm uses a set of dissimilarities or distances between cases when constructing the clusters and proceeds iteratively to join the most similar cases. Distances between clusters were recomputed by the Lance-Williams dissimilarity update formula according to the complete linkage method. In b, the four big squares drawn in the chart are based on the results of hierarchical clustering and each contains the members of a cluster (LV afterload cluster in the upper-left corner, cardiac preload cluster in the middle upper-left, LV contractility cluster in the middle lower-right, and RV function cluster in the lower-right corner). Numbers and the blue-white-red color spectrum denote the Spearman correlation coefficients (with Benjamini-Hochberg correction to control the false discovery rate at 0.05 level); positive correlations are represented in a blue scale; negative correlations are in a red scale. The surface areas of the colored pixels and their color intensity show the absolute value of corresponding correlation coefficients; non-significant coefficients are left blank. There was a strong correlation between most indices within the LV contractility cluster (blue pixels in the middle lower-right cluster) and within the LV afterload cluster (blue pixels in the upper-left cluster). In addition, some LV contractility indices were negatively correlated with an afterload parameter (red pixels above and to the left of the middle lower-right cluster), and positively correlated with RV function indices (blue pixels below and to the right of the middle lower-right cluster), but not with preload indices. IVC, maximal diameter of inferior vena cava in mm; EA, ratio of early to late diastolic wave velocity at the mitral valve; Ee, ratio of early pulsed-wave Doppler to early tissue Doppler diastolic wave velocity at the lateral mitral valve annulus; EF, LV ejection fraction in %; AS, absolute values of global LV longitudinal peak systolic strain in %; sm, tissue Doppler peak systolic wave at lateral mitral annulus in cm s−1; VAC, ventricular-arterial coupling; ME, LV end-systolic maximal elastance in mmHg mL−1; AE, end-systolic arterial elastance in mmHg mL−1; SVR, systemic vascular resistance in mmHg L−1 min; DAP, diastolic arterial pressure in mmHg; PCD, pulmonary circulatory dysfunction; TAPSE, tricuspid annulus plane systolic excursion in mm; st, tissue Doppler peak systolic wave at tricuspid lateral annulus in cm s−1
Fig. 3
Fig. 3
Focused principal component analysis for the association between echocardiographic parameters and cardiac biomarkers: [troponin (a) and NT-proBNP (b)] in critically ill patients with coronavirus-19 sepsis. Focused principal component analysis (FPCA) is a simple graphical display of correlation structures focusing on a particular dependent variable. The display reflects primarily the correlations between the dependent variable and all other variables (covariates), and secondarily the correlations between the covariates. The dependent variable [high-sensitive troponin T (TNT) in a and N-terminal pro b-type natriuretic peptide (BNP) in b] is at the center of the each diagram, and the distance of this point to a covariate faithfully represents their pairwise Spearman correlation coefficient (using ranked values of continuous variables). Variables positively and negatively correlated with each dependent variable (TNT and BNP) are in green and yellow, respectively. Covariates significantly correlated with the dependent variable (i.e., p value < 0.05) are inside the red circle. The diagram also shows relationships between covariates as follows: correlated covariates are close (for positive correlations, allowing identification of clusters) or diametrically opposite vis-à-vis the origin (for negative correlations), whereas independent covariates form a right angle with the origin. IVC, maximal diameter of inferior vena cava in mm; EA, ratio of early to late diastolic wave velocities at the mitral valve; Ee, ratio of early pulsed-wave Doppler to early tissue Doppler diastolic wave velocity at the lateral mitral valve annulus; EF, LV ejection fraction in %; AS, absolute values of global LV longitudinal peak systolic strain in %; sm, tissue Doppler peak systolic wave at lateral mitral annulus in cm s−1; VAC, ventricular-arterial coupling; ME, LV end-systolic maximal elastance in mmHg mL−1; AE, end-systolic arterial elastance in mmHg mL−1; SVR, systemic vascular resistance in mmHg L−1 min; DAP, diastolic arterial pressure in mmHg; PCD, pulmonary circulatory dysfunction; TAPSE, tricuspid annulus plane systolic excursion in mm; st, tissue Doppler peak systolic wave at tricuspid lateral annulus in cm s−1

Similar articles

Cited by

References

    1. Wu C, Chen X, Cai Y, Xia J, Zhou X, Xu S, et al. Risk factors associated with acute respiratory distress syndrome and death in patients with coronavirus disease 2019 pneumonia in Wuhan. China. JAMA Intern Med. 2020;180(7):934–943. doi: 10.1001/jamainternmed.2020.0994. - DOI - PMC - PubMed
    1. Boissier F, Razazi K, Seemann A, Bedet A, Thille A, de Prost N, et al. Left ventricular systolic dysfunction during septic shock: the role of loading conditions. Intensive Care Med. 2017;43:633–642. doi: 10.1007/s00134-017-4698-z. - DOI - PubMed
    1. Boissier F, Katsahian S, Razazi K, Thille A, Roche-Campo F, Leon R, et al. Prevalence and prognosis of cor pulmonale during protective ventilation for acute respiratory distress syndrome. Intensive Care Med. 2013;39:1725–1733. doi: 10.1007/s00134-013-2941-9. - DOI - PubMed
    1. Jardin F, Vieillard-Baron A. Monitoring of right-sided heart function. Curr Opin Crit Care. 2005;11:271–279. doi: 10.1097/01.ccx.0000158847.56107.55. - DOI - PubMed
    1. Aneman A, Vieillard-Baron A. Cardiac dysfunction in sepsis. Intensive Care Med. 2016;42:2073–2076. doi: 10.1007/s00134-016-4503-4. - DOI - PubMed

LinkOut - more resources