. 2021 Feb 16;96(7):e1045-e1053.
doi: 10.1212/WNL.0000000000011425. Epub 2021 Jan 20.

Population-Based Prevalence of Myotonic Dystrophy Type 1 Using Genetic Analysis of Statewide Blood Screening Program

Affiliations

Population-Based Prevalence of Myotonic Dystrophy Type 1 Using Genetic Analysis of Statewide Blood Screening Program

Nicholas E Johnson et al. Neurology. .

Abstract

Objective: To determine whether the genetic prevalence of the CTG expansion in the DMPK gene associated with myotonic dystrophy type 1 (DM1) in an unbiased cohort is higher than previously reported population estimates, ranging from 5 to 20 per 100,000 individuals.

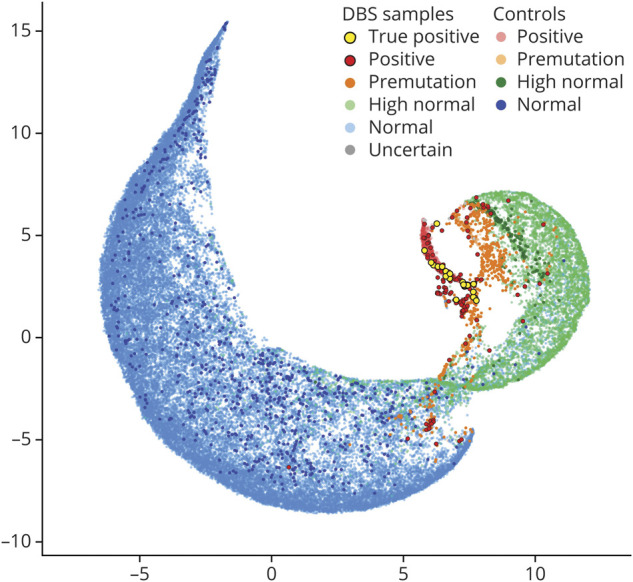
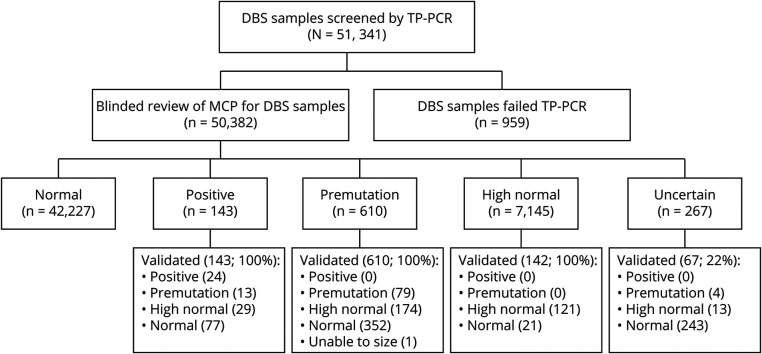
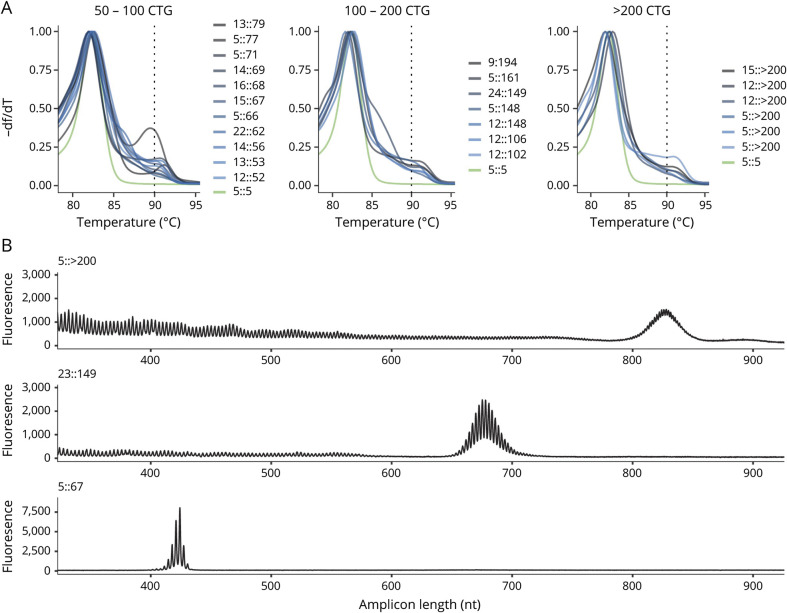
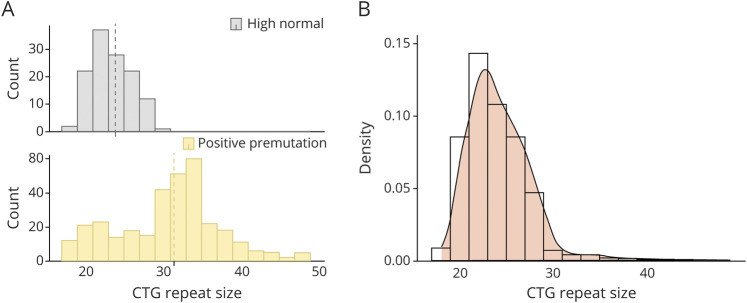
Methods: This study used a cross-sectional cohort of deidentified dried blood spots from the newborn screening program in the state of New York, taken from consecutive births from 2013 to 2014. Blood spots were screened for the CTG repeat expansion in the DMPK gene using triplet-repeat primed PCR and melt curve analysis. Melt curve morphology was assessed by 4 blinded reviewers to identify samples with possible CTG expansion. Expansion of the CTG repeat was validated by PCR fragment sizing using capillary electrophoresis for samples classified as positive or premutation to confirm the result. Prevalence was calculated as the number of samples with CTG repeat size ≥50 repeats compared to the overall cohort.

Results: Of 50,382 consecutive births, there were 24 with a CTG repeat expansion ≥50, consistent with a diagnosis of DM1. This represents a significantly higher DM1 prevalence of 4.76 per 10,000 births (95% confidence interval 2.86-6.67) or 1 in every 2,100 births. There were an additional 96 samples (19.1 per 10,000 or 1 in 525 births) with a CTG expansion in the DMPK gene in the premutation range (CTG)35-49.

Conclusion: The prevalence of individuals with CTG repeat expansions in DMPK is up to 5 times higher than previous reported estimates. This suggests that DM1, with multisystemic manifestations, is likely underdiagnosed in practice.


Figures

Figure 1
Figure 1. Clustering and Variability of Blinded Review of Melt Curves From DBS Samples
The −dF/dT data from 87.25°C to 96.70°C were clustered by Uniform Manifold Approximation and Projection and visualized as a 2-dimensional representation. Fifty thousand three hundred eighty-two dried blood spot (DBS) samples and 1,038 expanded (5::75, 5::80, 5::480, and 5::2,530), 259 premutation (12::37), 258 high normal (14::30), and 779 normal (5::5, 5::13, and 5::14) control melt profiles were used with sample points colored by the consensus call of blinded reviewers.
Figure 2
Figure 2. Sample Flow Diagram
Results of blinded review of melt curve profiles (MCPs) and validation assay to estimate CTG repeat size for dried blood spot (DBS) samples. TP = triplet primed.
Figure 3
Figure 3. Screening Melt Curve Analysis and Secondary Screening for 24 Samples Positive for DMPK CTG Repeat Expansions
(A) Overlay of normalized derivative melt curves from each of the 24 positive samples with CTG repeat size confirmed by secondary screening. Melt curves are grouped by CTG repeat size, and each plot includes a melt curve from normal control (green). (B) Representative capillary electropherograms from the secondary screening of 3 representative samples with >200, 149, and 67 CTG repeats using Amplidex DM1 Dx kit.
Figure 4
Figure 4. Genetic Ancestry Structure for Samples With DMPK Repeat Expansions
(A) Plot of ADMIXTURE clustering for K = 8 source populations. In the upper plot, 21 study samples are ordered by the largest (>200) to the smallest (49) DMPK CTG repeat number. Each individual is represented by a rectangle with colored segments that represent the proportions of genetic ancestry from each of 8 hypothetical source populations. The lower plot has the K = 8 clustering of 2,490 individuals from 26 different populations found in the 1000 Genomes Project (1KGP) sample resource. Each individual is represented by a vertical line with color heights proportional to the hypothetical source populations. Black vertical lines separate 1KGP population groups, which are annotated with 3-letter 1KGP population code and description. (B) Ancestry decomposition for the 21 study samples computed from principal component analysis using the 1KGP reference populations. Heat map shows the population membership for the 10 nearest reference individuals to each study sample, ordered by CTG repeat size as in panel (A). (C) Circles represent the geographic distribution of the 210 nearest neighbor 1KGP reference individuals with their individual counts displayed by population.
Figure 5
Figure 5. CTG Repeat Distribution on the Risk Haplotype
(A) Plots of CTG repeat sizes ≥18 inferred from the sampled high normal group (gray histogram) versus the size-validated premutation group (orange histogram). Size ranges on the x-axis are 2-repeat bins starting at 18 repeats, and the dashed lines show the mean size of 24 repeats for the high normal group and 31 repeats for the premutation group. (B) Combined histogram and density plot for the high normal and premutation samples. The high normal group has been scaled to 7,145 observations.

References

    1. Mahadevan M, Tsilfidis C, Sabourin L, et al. . Myotonic dystrophy mutation: an unstable CTG repeat in the 3' untranslated region of the gene. Science 1992;255:1253–1255. - PubMed
    1. Fu YH, Pizzuti A, Fenwick RG Jr, et al. . An unstable triplet repeat in a gene related to myotonic muscular dystrophy. Science 1992;255:1256–1258. - PubMed
    1. Brook JD, McCurrach ME, Harley HG, et al. . Molecular basis of myotonic dystrophy: expansion of a trinucleotide (CTG) repeat at the 3' end of a transcript encoding a protein kinase family member. Cell 1992;68:799–808. - PubMed
    1. Harper PS. Myotonic Dystrophy, 3rd ed. London: WB Saunders; 2001.
    1. Norwood FL, Harling C, Chinnery PF, Eagle M, Bushby K, Straub V. Prevalence of genetic muscle disease in Northern England: in-depth analysis of a muscle clinic population. Brain 2009;132:3175–3186. - PMC - PubMed

Publication types

Substances