. 2021 Feb 22;96(8):e1227-e1236.
doi: 10.1212/WNL.0000000000011467.

Incidence, Prevalence, and Geographical Clustering of Motor Neuron Disease in the Netherlands

Affiliations

Incidence, Prevalence, and Geographical Clustering of Motor Neuron Disease in the Netherlands

Adriaan D de Jongh et al. Neurology. .

Abstract

Objective: To assess time trends in motor neuron disease (MND) incidence, prevalence, and mortality and to investigate geographic clustering of MND cases in the Netherlands from 1998 to 2017, we analyzed data from the Netherlands Personal Records database, the Netherlands MND Center, and the Netherlands Patient Association of Neuromuscular Diseases.

Methods: In this prospective cohort study, Poisson regression was used to assess time trends in MND risk. We calculated age- and sex-standardized, observed, and expected cases for 1,694 areas. Bayesian smoothed risk mapping was used to investigate geographic MND risk.

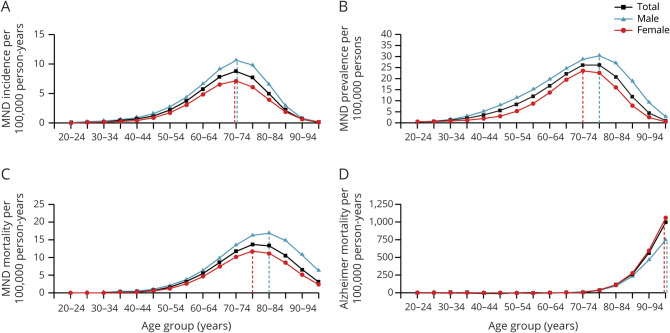
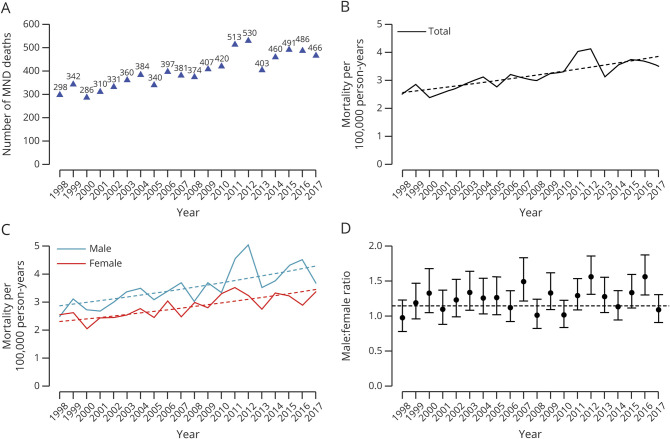
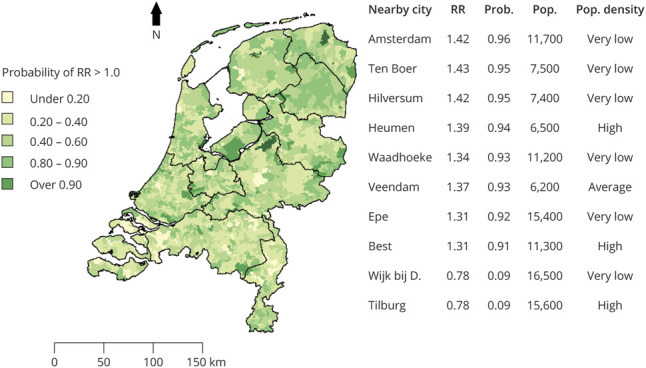
Results: We identified 7,992 MND cases, reflecting an incidence of 2.64 (95% confidence interval [CI] 2.62-2.67) per 100,000 person-years and a prevalence of 9.5 (95% CI 9.1-10.0) per 100,000 persons. Highest age-standardized prevalence and mortality rates occurred at a later age in men than in women (p < 0.001). Unadjusted mortality rates increased by 53.2% from 2.57 per 100,000 person-years in 1998 to 3.86 per 100,000 person-years in 2017. After adjustment for age and sex, an increase in MND mortality rate of 14.1% (95% CI 5.7%-23.2%, p < 0.001) remained. MND relative risk ranged from 0.78 to 1.43 between geographic areas; multiple urban and rural high-risk areas were identified.

Conclusions: We found a significant national increase in MND mortality from 1998 through 2017, explained only partly by an aging Dutch population, and a geographic variability in MND risk, suggesting a role for environmental or demographic risk factors.


Figures

Figure 1
Figure 1. Age- and Sex-Adjusted MND Incidence, Prevalence, and Mortality and Alzheimer Mortality
This panel plot shows motor neuron disease (MND) (A) incidence, (B) prevalence, and (C) mortality and (D) Alzheimer mortality in the Netherlands from 1998 through 2017 determined via Poisson regression. Dashed lines indicate the age group with maximum rates. There was a differential effect of age for men and women on incidence (p < 0.01 for interaction term), prevalence, and mortality (both p < 0.001). For example, highest MND prevalence and mortality rates occurred at later ages for men than for women. In contrast, highest Alzheimer mortality rates occurred in the oldest age group (>95 years) for both men and women. This suggests that MND risk is not merely a result of aging. Age- and sex-stratified MND incidence was determined on the basis of data from the Netherlands MND registry. MND prevalence was determined by capture-recapture methodology using data from the Netherlands MND registry and Netherlands Patient Association for Neuromuscular Diseases. MND mortality and Alzheimer mortality were determined from mortality records in the Netherlands Personal Records database.
Figure 2
Figure 2. Time Trends in MND Mortality and Sex Ratios in the Netherlands From 1998 Through 2017
(A) Number of motor neuron disease (MND) deaths observed in the Netherlands between 1998 and 2017. Absolute number of MND deaths increased from 299 in 1998 to 466 in 2017 with an average annual increase of 2.6%. (B) Adjusted for population size, mortality rates increased by 53.2% or by 14.1% After additional age and sex adjustment (both p < 0.001) in the time period of 1998 to 2017, dashed lines indicate regression lines. (C) MND mortality rates are provided separately for men (blue) and women (red). Annual increase in MND mortality rates was not different for men and women (p = 0.62 for interaction term). (D) Similar to panel C, we provide the annual male:female ratio, revealing a stable sex ratio of 1.19 (dashed line) over time (p = 0.09 for time trend).
Figure 3
Figure 3. ENCALS Risk Profiles and Adjusted Survival Trends in the Netherlands From 2006 Through 2017
(A) Annual distribution of the 5 prognostic subgroups defined by the European Network for the Cure of ALS (ENCALS) personalized prediction model. Ideally, each prognostic subgroup should have a prevalence of ≈20%/y. As can be seen, in 2006, the Netherlands motor neuron disease (MND) registry enrolled relatively more very long- and long-surviving patients, indicating that the registry recruited mainly prevalent cases. Fortunately, as recruitment strategies improved to register also short- and very short-surviving subgroups, the Netherlands MND registry has become more population based. (B) Effect of year of diagnosis on survival time was modeled with a Cox proportional hazards model adjusted for the ENCALS risk prediction. Risk of death during follow-up decreased by 16.2% between 2006 and 2017 (hazard ratio per 5 years 0.93, 95% confidence interval [CI] 0.88–0.98, p = 0.006). Adjusted median survival increased from 19.6 months (95% CI 18.7–20.9) in 2006 to 22.4 months (95% CI 21.1–23.7) in 2017.
Figure 4
Figure 4. Probability of Elevated MND Risk in the Netherlands by Geographic Area
Motor neuron disease (MND) relative risk for 1,694 areas was calculated and subsequently smoothed based on data from the Dutch Personal Records database from 1998 to 2017. This map shows the probability (Prob) that MND relative risk (RR) per area is greater than expected according to the national rate of MND (i.e., the probability of RR >1.0 based on 10,000 draws from the posterior distribution). Population (Pop) density was estimated as number of residents per 1 km2; the following definitions from Statistics Netherlands were used: <500 (very low), 500 to 1,000 (low), 1,000 to 1,500 (average), 1,500 to 2,500 (high), and >2,500 (very high). Wijk bij D. = Wijk bij Duurstede.

References

    1. Al-Chalabi A, Fang F, Hanby MF, et al. . An estimate of amyotrophic lateral sclerosis heritability using twin data. J Neurol Neurosurg Psychiatry 2010;81:1324–1326. - PMC - PubMed
    1. van Es MA, Hardiman O, Chio A, et al. . Amyotrophic lateral sclerosis. Lancet 2017;390:2084–2098. - PubMed
    1. GBD 2016 Motor Neuron Disease Collaborators. Global, regional, and national burden of motor neuron diseases 1990-2016: a systematic analysis for the Global Burden of Disease Study 2016. Lancet Neurol 2018;17:1083–1097. - PMC - PubMed
    1. Chio A, Mora G, Moglia C, et al. . Secular trends of amyotrophic lateral sclerosis: the Piemonte and Valle d'Aosta register. JAMA Neurol 2017;74:1097–1104. - PMC - PubMed
    1. Moore A, Young CA, Hughes DA. Health utilities and costs for motor neurone disease. Value Health 2019;22:1257–1265. - PubMed

LinkOut - more resources