. 2021 Jan 20;12(1):487.
doi: 10.1038/s41467-020-20679-y.

BNIP3L/NIX-mediated mitophagy protects against glucocorticoid-induced synapse defects

Affiliations

BNIP3L/NIX-mediated mitophagy protects against glucocorticoid-induced synapse defects

Gee Euhn Choi et al. Nat Commun. .

Abstract

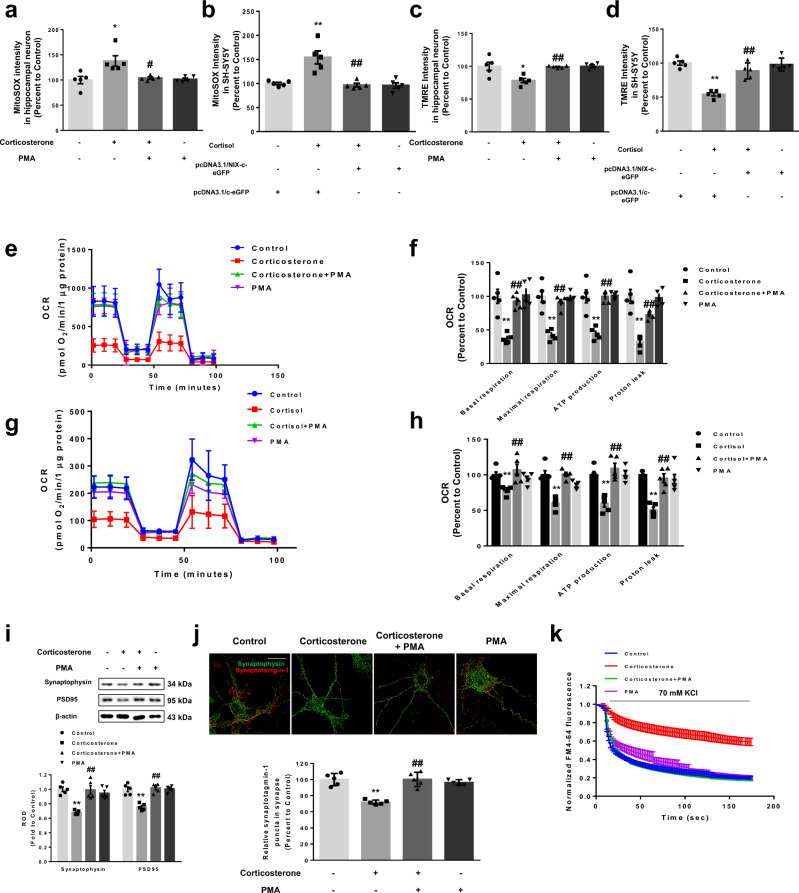
Stress-induced glucocorticoids disturb mitochondrial bioenergetics and dynamics; however, instead of being removed via mitophagy, the damaged mitochondria accumulate. Therefore, we investigate the role of glucocorticoids in mitophagy inhibition and subsequent synaptic defects in hippocampal neurons, SH-SY5Y cells, and ICR mice. First, we observe that glucocorticoids decrease both synaptic density and vesicle recycling due to suppressed mitophagy. Screening data reveal that glucocorticoids downregulate BNIP3-like (BNIP3L)/NIX, resulting in the reduced mitochondrial respiration function and synaptic density. Notably, we find that glucocorticoids direct the glucocorticoid receptor to bind directly to the PGC1α promoter, downregulating its expression and nuclear translocation. PGC1α downregulation selectively decreases NIX-dependent mitophagy. Consistent with these results, NIX enhancer pre-treatment of a corticosterone-exposed mouse elevates mitophagy and synaptic density in hippocampus, improving the outcome of a spatial memory task. In conclusion, glucocorticoids inhibit mitophagy via downregulating NIX and that NIX activation represents a potential target for restoring synapse function.


Conflict of interest statement

The authors declare no competing interests.

Figures

Fig. 1
Fig. 1. Glucocorticoids induce mitochondrial mislocalization, synaptic dysfunction, and cell death.
ac Hippocampal neurons and SH-SY5Y cells were treated with corticosterone and cortisol for 24 h, respectively. Hippocampal neurons were immunostained with MAP2 (green), Tau (blue), and Mitotracker red (MTR, red). Relative ratio of Pearson’s correlation coefficient was quantified in distal neurites (100 μm). Scale bars, 20 μm (magnification, ×1000). n = 5. b Hippocampal neurons were immunostained with synaptophysin (green), DAPI (blue), and TOMM20 (red). Mitochondrial intensity around perinuclear regions and Pearson’s correlation coefficient between synaptophysin and TOMM20 were quantified. Scale bars, 100 μm (magnification, ×200). n = 5. c SH-SY5Y cells were immunostained with TOMM20 (green) and DAPI (blue). Mitochondrial intensity was quantified around nucleus and extremities. Scale bars, 20 μm (magnification, ×1000). n = 5. dh Hippocampal neurons were treated with corticosterone for 48 h. d Hippocampal neurons were immunostained with MAP2 (green) and DAPI (blue) for measuring lengths of dendrites. Scale bars, 100 μm (magnification, ×200). n = 5. e Hippocampal neurons were immunostained with synaptophysin (green) and PSD95 (red). Pearson’s correlation coefficient was quantified for detecting synaptic density. Scale bars, 100 μm (magnification, ×200). n = 5. f Western blot was performed. n = 5. g After stimulation with depolarization buffer, cells were incubated with synaptotagmin-1 antibody and then fixed. Synaptophysin (green) was used to visualize synapse and synaptotagmin-1 (red) was used for measuring uptake of synaptic vesicles. Scale bars, 100 μm (magnification, ×200). n = 5. h Conditioned hippocampal neurons were stained with FM4-64 dye and stimulated with high K+ buffer for destaining. Time-lapse imaging was done over 180 sec at 1 sec intervals. n = 5. i SH-SY5Y cells were treated with cortisol for 72 h. The percentages of apoptotic cells (Annexin V positive cells) were analyzed by Annexin V/PI analysis, measured by flowcytometer. n = 5. All blot and immunofluorescence images are representative. n = 5 from independent experiments with two technical replicates each. Quantitative data are presented as a mean ± S.E.M. The representative images were acquired by SRRF imaging system. Two-sided unpaired student’s t test was conducted. *, ** indicates p < 0.05, p < 0.01 versus control, respectively. Data are provided as a Source data file.
Fig. 2
Fig. 2. Corticosterone and cortisol suppress mitophagy.
a, b Hippocampal neurons were transfected with mitophagy reporter mitochondria-targeted Keima (mt-Keima) at DIV 5 whereas SH-SY5Y cells were transfected with mt-Keima 48 h prior to treatment. Carbonyl cyanide 3-chlorophenylhydrazone (CCCP, 10 μM) and antimycin A1 (1 μM) were pretreated for 2 h. And corticosterone and cortisol were treated for 24 h in hippocampal neurons at DIV 14 and SH-SY5Y cells, respectively. Green and red fluorescence of mt-Keima were visualized. DAPI was used for nuclear counterstaining (blue). Ratio of red to sum of red and green was quantified. Scale bars, 20 μm (magnification, ×1000). n = 5. c, d Hippocampal neurons were transfected with Autophagsense (GFP) and DsRed2-Mito (RFP) at DIV 5. SH-SY5Y was transfected with two same vectors 48 h prior to treatment. Corticosterone and cortisol were treated for 24 h in hippocampal neurons at DIV 14 and SH-SY5Y cells, respectively. Scale bars, 20 μm (magnification, ×1000). n = 5. Pearson’s correlation coefficient between GFP and RFP fluorescence was quantified. ei Hippocampal neurons and SH-SY5Y cells were treated with corticosterone and cortisol for 24 h, respectively. e, f Both cell types were stained with MTR (red) for 30 min and then fixed with formaldehyde. TUNEL assay was subsequently done. DNA breaks were detected with FITC filter. FITC fluorescence in mitochondria was quantified as mitochondrial death. Scale bars, 20 μm (magnification, ×1000). n = 5. g, h DNA levels of mitochondrial DNA (mtDNA) and nDNA were analyzed by real-time PCR. ACTB was used as a loading control. n = 5. i Bafilomycin A1 (10 nM) was applied for 2 h prior to harvest. TOMM20 expression and LC3II/I ratio in hippocampal neuron were analyzed by western blot. Loading control is β-actin. n = 5. All blots and immunofluorescence images are representative. n = 5 from independent experiments with two technical replicates each. Quantitative data are presented as a mean ± S.E.M. The representative images were acquired by SRRF imaging system. Two-sided unpaired student’s t test was conducted except Figs. 2a, b and 2i, data of which were analyzed by two-way ANOVA. ** indicates p < 0.01 versus control. NS means not significant. Data are provided as a Source data file.
Fig. 3
Fig. 3. Glucocorticoids suppress NIX expression independent from PINK1-parkin pathway.
a SH-SY5Y cells were incubated with cortisol for 12 h and mRNA expressions were analyzed by real-time PCR. n = 5. b, c Hippocampal neurons and SH-SY5Y cells were treated with corticosterone for 24 h and with cortisol for various time, respectively. Expression of NIX, PTEN-induced kinase 1 (PINK1), and BCL2 interacting protein 3 (BNIP3) were detected via western blot. n = 5. d, e Hippocampal neurons and SH-SY5Y cells were treated with corticosterone and cortisol, respectively, for 24 h. NIX (green), TOMM20 (red), and DAPI (nuclear counterstaining, blue) were visualized. Scale bars, 20 μm (magnification, ×1000). n = 5. f Nontargeting (NT) or PARK2 siRNA was transfected to SH-SY5Y cells for 24 prior to cortisol for 24 h. NIX was co-immunoprecipitated with parkin. Parkin levels in immunoprecipitated samples were quantified. n = 5. g, h Both hippocampal neurons and SH-SY5Y cells were transfected with mitochondria-targeted Keima (mt-Keima)-Red-Parkin for 24 h prior to corticosterone and cortisol for 24 h, respectively. Western blot was performed. n = 5. il Both hippocampal neurons and SH-SY5Y cells were pretreated with phorbol 12-myristate 13-acetate (PMA, 10 nM) for 30 min before corticosterone and cortisol for 24 h, respectively. i, j Hippocampal neurons and SH-SY5Y cells were transfected with mt-Keima at DIV 5 and 48 h prior to treatment, respectively. DAPI was used for nuclear counterstaining (blue). Ratio of red to sum of red and green was quantified. Scale bars, 20 μm (magnification, ×1000). n = 5. k, l TOMM20 levels were detected by western blot. n = 5. m SH-SY5Y cells were transfected with pcDNA3.1/c-eGFP or pcDNA3.1/NIX-c-eGFP vector for 24 h prior to cortisol for 24 h. TOMM20 levels were detected by western blot. n = 5. All blots and immunofluorescence images are representative. n = 5 from independent experiments with two technical replicates each. Quantitative data are presented as a mean ± S.E.M. The representative images were acquired by SRRF imaging. Two-sided unpaired student’s t test: Figs. 3a, b, d, e. Two-sided one-way ANOVA: Fig. 3c. Two-sided two-way ANOVA: Figs. 3f–m. ** indicates p < 0.01 versus control. ## indicates p < 0.01 versus corticosterone in hippocampal neurons and cortisol in SH-SY5Y. Data are provided as a Source data file.
Fig. 4
Fig. 4. NIX upregulation recovers glucocorticoid-induced mitochondrial dysfunction.
a, b Hippocampal neurons were pretreated with phorbol 12-myristate 13-acetate (PMA, 10 nM) for 30 min prior to corticosterone for 24 h. SH-SY5Y cells were transfected with pcDNA3.1/c-eGFP or pcDNA3.1/NIX-c-eGFP vector for 24 h prior to cortisol treatment for 24 h. The level of mtROS was measured via MitoSOX staining with luminometer. n = 5. cd Hippocampal neurons were pretreated with PMA (10 nM) for 30 min prior to corticosterone for 48 h. SH-SY5Y cells were transfected with pcDNA3.1/c-eGFP or pcDNA3.1/NIX-c-eGFP vector for 24 h prior to cortisol treatment for 48 h. Mitochondrial membrane potential was measured via tetramethylrhodamine ethyl ester (TMRE) staining with luminometer. n = 5. eh Both hippocampal neurons and SH-SY5Y cells were pretreated with PMA for 30 min before corticosterone and cortisol treatment for 48 h, respectively. Oxygen consumption rate (OCR) changes under mitochondrial stress test were measured by using Seahorse SF24 Extracelluar Flux analyzer where oligomycin, carbonyl cyanide-4-(trifluoromethoxy)phenylhydrazone (FCCP), and antimycin A/rotenone mixture were treated. n = 5. Statistics of basal respiration, maximal respiration, ATP production, and proton leak were also presented. ik Hippocampal neurons were pretreated with PMA for 30 min prior to corticosterone for 48 h. i Synaptophysin and PSD95 were detected by western blot. Loading control is β-actin. n = 5. j After stimulation with depolarization buffer, cells were incubated with synaptotagmin-1 antibody. Synaptophysin (green) was used to visualize synapse and synaptotagmin-1 (red) was used for measuring uptake of synaptic vesicles. Scale bars, 20 μm (magnification, ×1000). n = 5. k Conditioned hippocampal neurons were stained with FM4-64 dye and stimulated with high K+ buffer for destaining. Time-lapse imaging was performed over 180 sec at 1 sec intervals with an Eclipse Ts2TM fluorescence microscopy. n = 5. All blots and immunofluorescence images are representative. n = 5 from independent experiments with two technical replicates each. Quantitative data are presented as a mean ± S.E.M. The representative images were acquired by SRRF imaging system. Two-sided two-way ANOVA was conducted. *, ** indicates p < 0.05, p < 0.01 versus control, respectively. #, ## indicates p < 0.05, p < 0.01 versus corticosterone in hippocampal neurons and cortisol in SH-SY5Y, respectively. Data are provided as a Source data file.
Fig. 5
Fig. 5. GR-dependent inhibition of mitophagy.
ad Nontargeting (NT) or GR siRNA was transfected to hippocampal neurons and SH-SY5Y cells for 24 h prior to corticosterone and cortisol for 24 h, respectively. a, b Hippocampal neurons were transfected with mitochondria-targeted Keima (mt-Keima) at DIV 5, whereas SH-SY5Y cells were transfected with mt-Keima 48 h prior to treatment. Green and red fluorescence of mt-Keima were visualized. DAPI was used for nuclear counterstaining (blue). Ratio of red to sum of red and green was quantified. Scale bars, 20 μm (magnification, ×1000). n = 5. cd TOMM20 levels were detected by western blot. Loading control is β-actin. n = 5. All blots and immunofluorescence images are representative. n = 5 from independent experiments with two technical replicates each, respectively. Quantitative data are presented as a mean ± S.E.M. The representative images were acquired by SRRF imaging system. Two-sided two-way ANOVA was conducted. *, ** indicates p < 0.05, p < 0.01 versus control, respectively. #, ## indicates p < 0.05, p < 0.01 versus corticosterone in hippocampal neurons and cortisol in SH-SY5Y, respectively. Data are provided as a Source data file.
Fig. 6
Fig. 6. GR-dependent downregulation of NIX expression via PGC1α.
a, b Nontargeting (NT) or GR siRNA was transfected to hippocampal neurons and SH-SY5Y cells for 24 h prior to corticosterone and cortisol for 24 h, respectively. NIX expression was detected in western blot where β-actin was used as a loading control. n = 5. c SH-SY5Y cells were incubated with cortisol for 6 h. The mRNA expression levels of genes associated with nuclear receptors and coregulators were assessed by RT2 Profiler PCR array. Heat maps with hierarchical clustering were acquired by using the GeneGlobe Data analysis Center on Qiagen website. n = 3. d A thousand base pair upstream of the first codon of the PPARGC1A was described and the putative GRE binding sequence was emphasized with yellow labeling. e SH-SY5Y cells were incubated with cortisol for 6 h. DNA was immunoprecipitated with IgG, RNA polymerase (RNAPol), and glucocorticoid receptor (GR) antibody. The immunoprecipitation and input samples were amplified with primers of GAPDH and PPARGC1A gene. n = 5. All blots are representative. n = 3 or 5 from independent experiments with two technical replicates each, respectively. Quantitative data are presented as a mean ± S.E.M. Two-sided two-way ANOVA was conducted in Fig. 6a, b. Two-sided unpaired student’s t test was conducted in Fig. 6e. ** indicates p < 0.01 versus control. ## indicates p < 0.01 versus corticosterone in hippocampal neurons and cortisol in SH-SY5Y, respectively. Data are provided as a Source data file.
Fig. 7
Fig. 7. Role of PGC1α in NIX-dependent mitophagy.
ae Nontargeting (NT) or GR siRNA was transfected to hippocampal neurons and SH-SY5Y cells for 24 h prior to corticosterone and cortisol for 12 h, respectively. a, b Peroxisome proliferator-activated receptor gamma coactivator 1-alpha (PGC1α) expression was detected in western blot where β-actin was used as a loading control in both cell types. n = 5. c Colocalization of PGC1α (red) and DAPI (blue) in hippocampal neurons was visualized with SRRF imaging system. Scale bars, 20 μm (magnification, ×1000). n = 5. d Colocalization of PGC1α (green) and DAPI (blue) in SH-SY5Y was visualized with SRRF imaging system. Scale bars, 20 μm (magnification, ×1000). n = 5. e PGC1α protein expressions in subcellular fraction samples were detected by western blotting. Lamin A/C and α-tubulin were used as a nuclear and cytosolic loading control, respectively. n = 5. f, g SH-SY5Y cells were transfected with pcDNA3.1/c-eGFP or pcDNA3.1/PPARGC1A-c-eGFP vector for 24 h prior to cortisol treatment for 24 h. f NIX expression was detected in western blot where β-actin was used as a loading control. n = 5. g TOMM20 levels were detected by western blot. Loading control for western blot is β-actin. n = 5. All blots and immunofluorescence images are representative. n = 5 from independent experiments with two technical replicates each. Quantitative data are presented as a mean ± S.E.M. Two-sided two-way ANOVA was conducted. ** indicates p < 0.01 versus control. #, ## indicates p < 0.05, p < 0.01 versus corticosterone in hippocampal neurons and cortisol in SH-SY5Y, respectively. Data are provided as a Source data file.
Fig. 8
Fig. 8. Corticosterone affects NIX-dependent mitophagy through decreasing PGC1α in vivo.
af Mice were exposed to vehicle, corticosterone (10 mg/kg), corticosterone with phorbol 12-myristate 13-acetate (PMA pretreatment, 200 μg/kg), or PMA alone for 7 days. a Slide samples for IHC were immunostained with LAMP1 (green), TOMM20 (red), and DAPI (blue). Scale bars, 100 μm (magnification, ×200). n = 5. b The expressions of NIX, PTEN-induced kinase 1 (PINK1), and BCL2 interacting protein 3 (BNIP3) were detected with western blot where β-actin was used as a loading control. n = 5. c Slide samples for IHC were immunostained with synpatophysin (green), PSD95 (red), and DAPI (blue). Scale bars, 100 μm (magnification, ×200). n = 5. d Synaptophysin and PSD95 were detected by western blot. Loading control is β-actin. n = 5. e The mice were subjected to Y-maze test to evaluate spatial memory function. n = 6. f The mice were subjected to forced swim test to evaluate depression-like behavior. n = 5. g Vehicle or RU 486 (5 mg/kg) injected mice were presented with/without corticosterone (10 mg/kg) for 3 days. The expressions of peroxisome proliferator-activated receptor gamma coactivator 1-alpha (PGC1α) and NIX were visualized via western blotting. Loading control is β-actin. n = 5. h The schematic model for mechanisms of inhibition in NIX-dependent mitophagy by glucocorticoid was shown. All blots and immunofluorescence images are representative. n = 5 or 6 from each animal with two technical replicates each in results of IHC and western blot. Quantitative data are presented as a mean ± S.E.M. The representative images were acquired by SRRF imaging system. Two-sided two-way ANOVA was conducted except Fig. 8b, data of which were analyzed by two-sided unpaired student’s t test. ** indicates p < 0.01 versus control and ## indicates p < 0.01 versus corticosterone, respectively. Data are provided as a Source data file.

References

    1. Green KN, Billings LM, Roozendaal B, McGaugh JL, LaFerla FM. Glucocorticoids increase amyloid-β and tau pathology in a mouse model of Alzheimer’s disease. J. Neurosci. 2006;26:9047–9056. doi: 10.1523/JNEUROSCI.2797-06.2006. - DOI - PMC - PubMed
    1. Hernández-Alvarez MI, et al. Glucocorticoid modulation of mitochondrial function in hepatoma cells requires the mitochondrial fission protein Drp1. Antioxid. Redox Signal. 2013;19:366–378. doi: 10.1089/ars.2011.4269. - DOI - PMC - PubMed
    1. Bhujabal Z, et al. FKBP8 recruits LC3A to mediate parkin‐independent mitophagy. EMBO Rep. 2017;18:947–961. doi: 10.15252/embr.201643147. - DOI - PMC - PubMed
    1. Ashrafi G, Schwarz TL. PINK1-and PARK2-mediated local mitophagy in distal neuronal axons. Autophagy. 2015;11:187–189. - PMC - PubMed
    1. Choi GE, et al. Glucocorticoid-mediated ER-mitochondria contacts reduce AMPA receptor and mitochondria trafficking into cell terminus via microtubule destabilization. Cell Death Dis. 2018;9:1137. doi: 10.1038/s41419-018-1172-y. - DOI - PMC - PubMed

Publication types

MeSH terms