. 2021 Jan 20;12(1):490.
doi: 10.1038/s41467-020-20707-x.

Short H2A histone variants are expressed in cancer

Affiliations

Short H2A histone variants are expressed in cancer

Guo-Liang Chew et al. Nat Commun. .

Abstract

Short H2A (sH2A) histone variants are primarily expressed in the testes of placental mammals. Their incorporation into chromatin is associated with nucleosome destabilization and modulation of alternate splicing. Here, we show that sH2As innately possess features similar to recurrent oncohistone mutations associated with nucleosome instability. Through analyses of existing cancer genomics datasets, we find aberrant sH2A upregulation in a broad array of cancers, which manifest splicing patterns consistent with global nucleosome destabilization. We posit that short H2As are a class of "ready-made" oncohistones, whose inappropriate expression contributes to chromatin dysfunction in cancer.


Conflict of interest statement

The authors declare no competing interests.

Figures

Fig. 1
Fig. 1. H2A.B possesses oncohistone features that are conserved throughout primates.
a Schematic of common oncomutations found in human core H2A and their status in H2A.B. Marked sites on core H2A show WT amino acid position followed by its most common cancer-specific substitution in TCGA (pink). Associated sites found in WT short H2As are shown in purple. b Protein alignment of core H2A, testis-specific H2A (TH2A), and H2A.B paralogs from Human and representative primates. Substitutions corresponding to oncohistone mutations in H2A (see Fig. 1.) are shown in pink.
Fig. 2
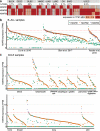
Fig. 2. H2A.B is expressed in a broad array of cancers.
a Heat map illustrating the co-expression of H2A.B paralogues in individual tumors that express any one H2A.B paralogue (at >1.5 TPM as measured by RNA-seq), for cancer types with at least 10 tumors expressing any H2A.B paralogue. Percentages of tumors for each cancer type that express any H2A.B paralogue are shown. b Expression levels (TPM) of H2A.B-encoding transcripts in three independent B-acute lymphoblastic leukemia data sets, horizontal line demarcates 1.5 TPM as measured by RNA-seq. Only samples with non-zero expression of any H2A.B paralog are shown: 18, 5, and 1 samples are omitted from Liu et al. 2016, Qian et al. 2017, and Yasuda et al. 2016, respectively. c As in b, but for cancer cell lines from CCLE, grouped by their lineage. Only lineages with any sample >1.5 TPM, and samples with non-zero expression of any H2A.B paralog are shown.
Fig. 3
Fig. 3. Gene expression analyses in H2A.B-reactivated cancers.
a Scatter plot of gene expression differences (expressed as fold-change), comparing H2AFB1-positive against negative tumors (x axes), and H2AFB2/3-positive against negative tumors (y axes). The red and blue borders show genes that are commonly up- or downregulated at >1.19-fold. Pearson correlation coefficient is also shown. b Boxplots comparing levels of H2A.Z (H2AFZ), H3.3 (H3F3A), H2A.X (H2AFX), and NAP1 (NAP1L1) transcripts in H2A.B-positive (green) vs negative (orange) cancers from TCGA and B-ALL data sets. Asterisks show the statistical significance of the difference in TPMs by a two-sided Mann–Whitney U test. *p < 0.05; **p < 0.01; ******p < 0.000001; *******p < 0.0000001. Number of cancer samples in each group are listed in Supplementary Table 2. Boxplots indicate the 1st quartile, median and 3rd quartile, whereas the whiskers extend from the box-ends to values no larger/smaller than 1.5 times of the inter-quartile range. All data points are additionally plotted. c Boxplots as in b, comparing CTAs scores in H2A.B-positive (green) and negative (orange) cancers in TCGA and B-ALL cancers. For each tumor, the expression of CTAs is summarized as a CTA score: the sum Z-normalized log expression of the top 40 most variably expressed CTAs (within each cancer type). Asterisks show the statistical significance of the difference in CTA scores by a one-sided Mann–Whitney U test. *p < 0.05; **p < 0.01. Outlier points beyond the whiskers are additionally plotted.
Fig. 4
Fig. 4. Splicing analyses in H2A.B-reactivated cancers.
a Bar graphs showing the percentage of up- and downregulated splicing events (constitutive and alternative) when comparing H2A.B-positive to negative tumors, for cancer types with at least 10 tumors expressing any H2A.B paralogue. b Scatter plots of alternative cassette exon inclusion for various cancers, comparing individual events from H2A.B-positive (y axes) to negative tumors (x axes). Axes units are fraction of transcripts that include the alternative cassette exon (Psi). Red and blue points indicate events that are significantly up- or downregulated (respectively) in H2A.B-positive tumors, at a threshold of p < 0.05 (one-sided Mann–Whitney test) and the difference in Psi >0.1. The number of significantly up- and downregulated events are tallied in the bottom of each panel. c As in a, but for B-ALL data sets.

References

    1. Luger K, Mader AW, Richmond RK, Sargent DF, Richmond TJ. Crystal structure of the nucleosome core particle at 2.8 A resolution. Nature. 1997;389:251–260. doi: 10.1038/38444. - DOI - PubMed
    1. Bennett, R. L. et al. A mutation in histone H2B represents a new class of oncogenic driver. Cancer Discov.9, 1438–1451 (2019). - PMC - PubMed
    1. Nacev BA, et al. The expanding landscape of ‘oncohistone’ mutations in human cancers. Nature. 2019;567:473–478. doi: 10.1038/s41586-019-1038-1. - DOI - PMC - PubMed
    1. Lehnertz B, et al. H3(K27M/I) mutations promote context-dependent transformation in acute myeloid leukemia with RUNX1 alterations. Blood. 2017;130:2204–2214. doi: 10.1182/blood-2017-03-774653. - DOI - PubMed
    1. Lewis PW, et al. Inhibition of PRC2 activity by a gain-of-function H3 mutation found in pediatric glioblastoma. Science. 2013;340:857–861. doi: 10.1126/science.1232245. - DOI - PMC - PubMed

Publication types