. 2021 Mar;31(3):272-290.
doi: 10.1038/s41422-020-00455-9. Epub 2021 Jan 21.

Discriminating mild from critical COVID-19 by innate and adaptive immune single-cell profiling of bronchoalveolar lavages

Collaborators, Affiliations

Discriminating mild from critical COVID-19 by innate and adaptive immune single-cell profiling of bronchoalveolar lavages

Els Wauters et al. Cell Res. 2021 Mar.

Abstract

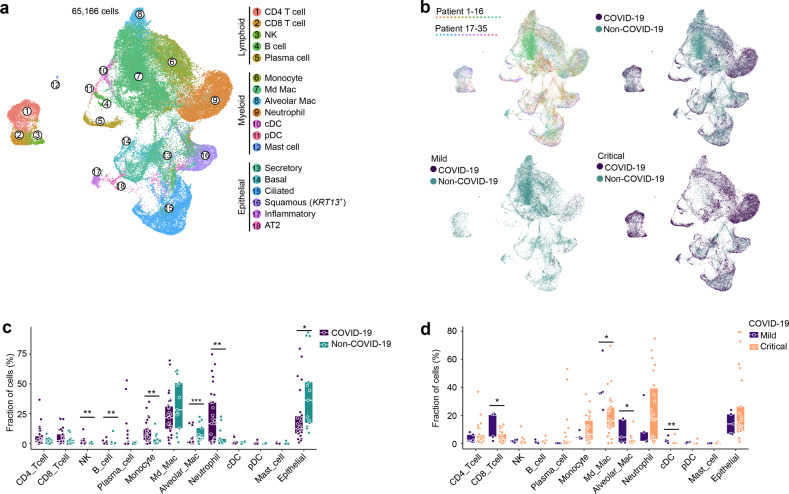
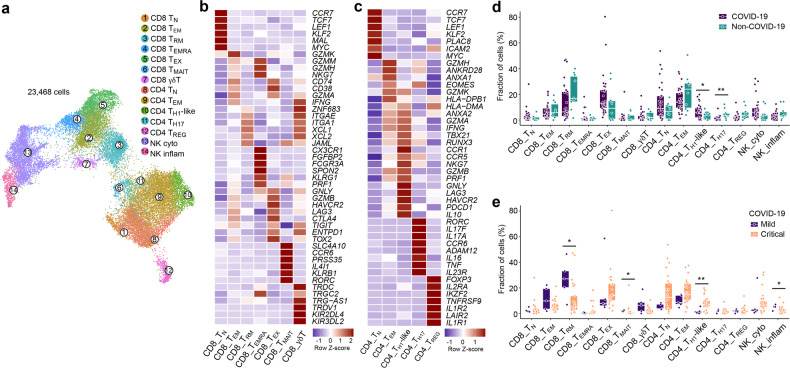
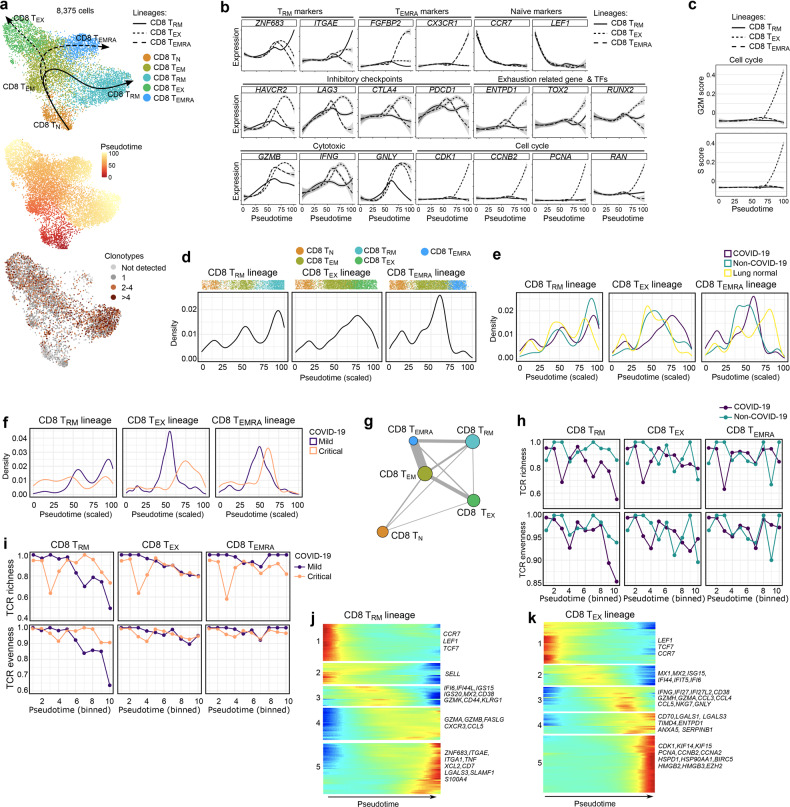
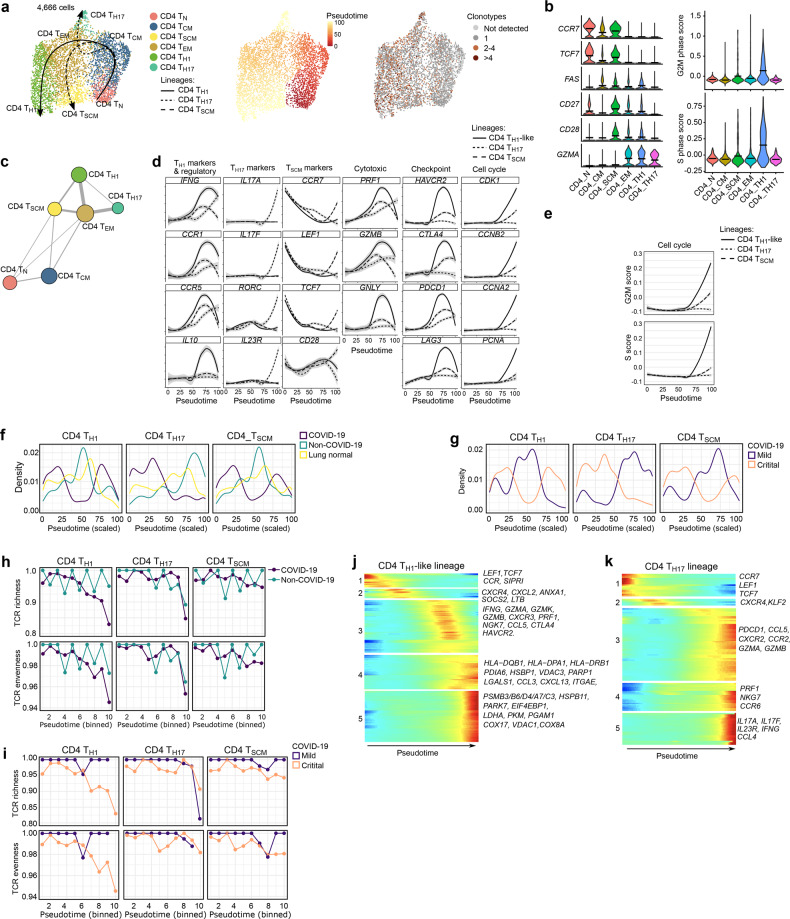
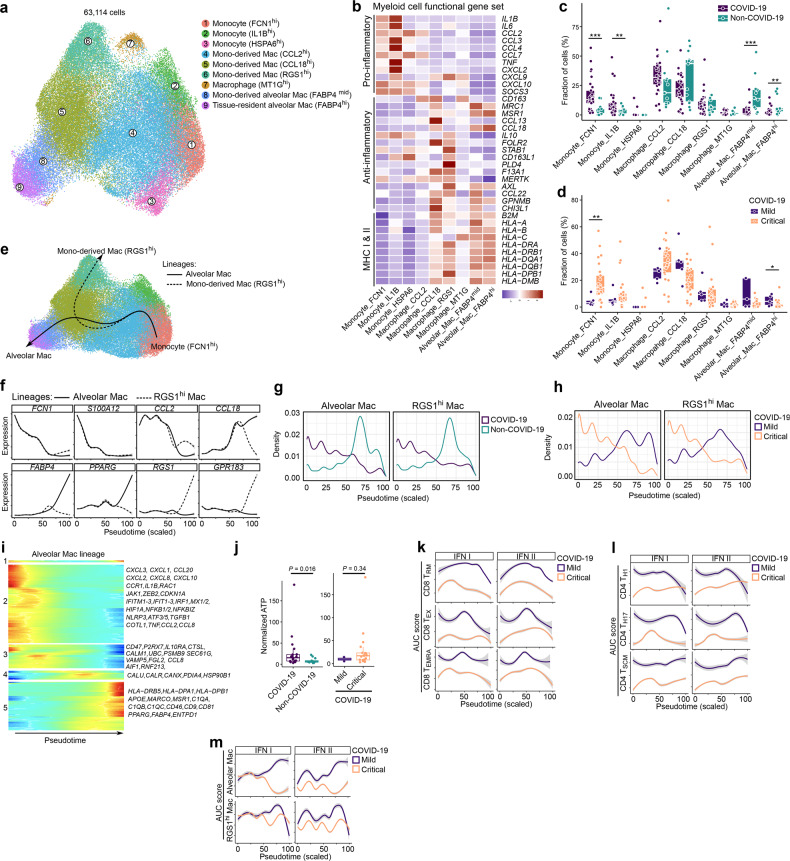
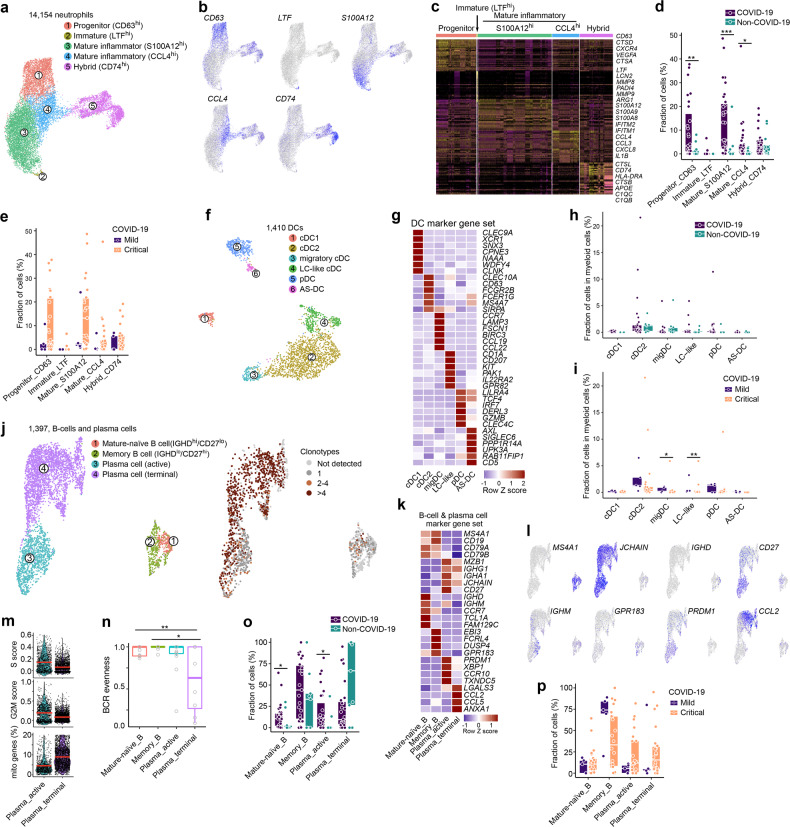
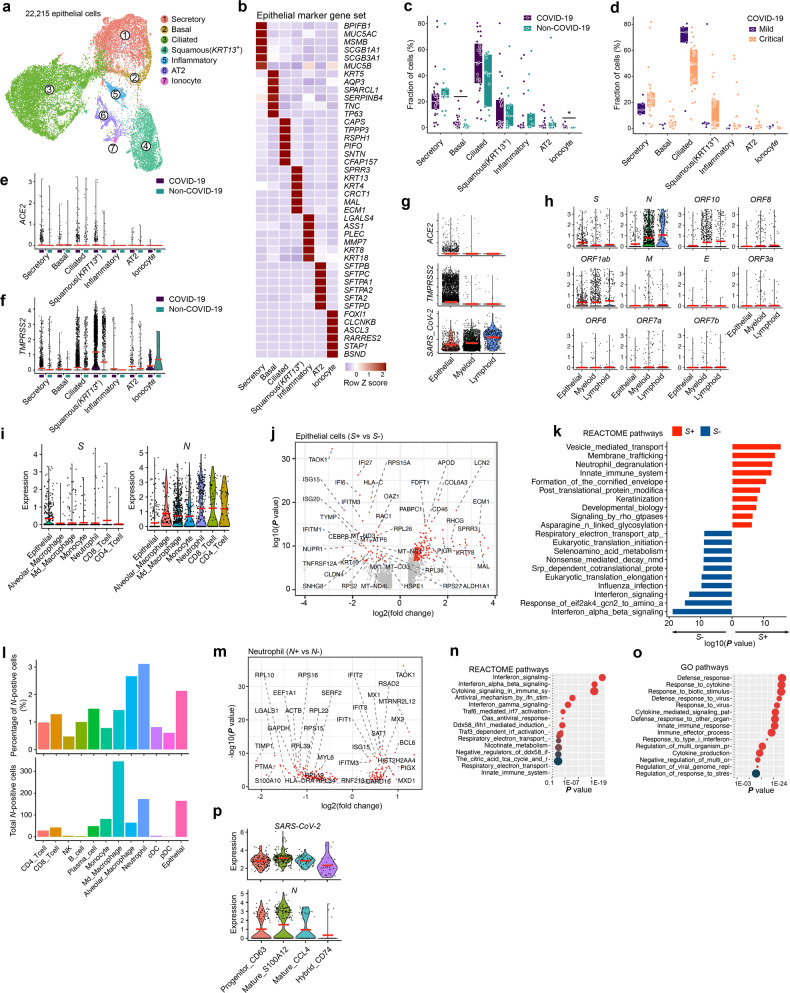
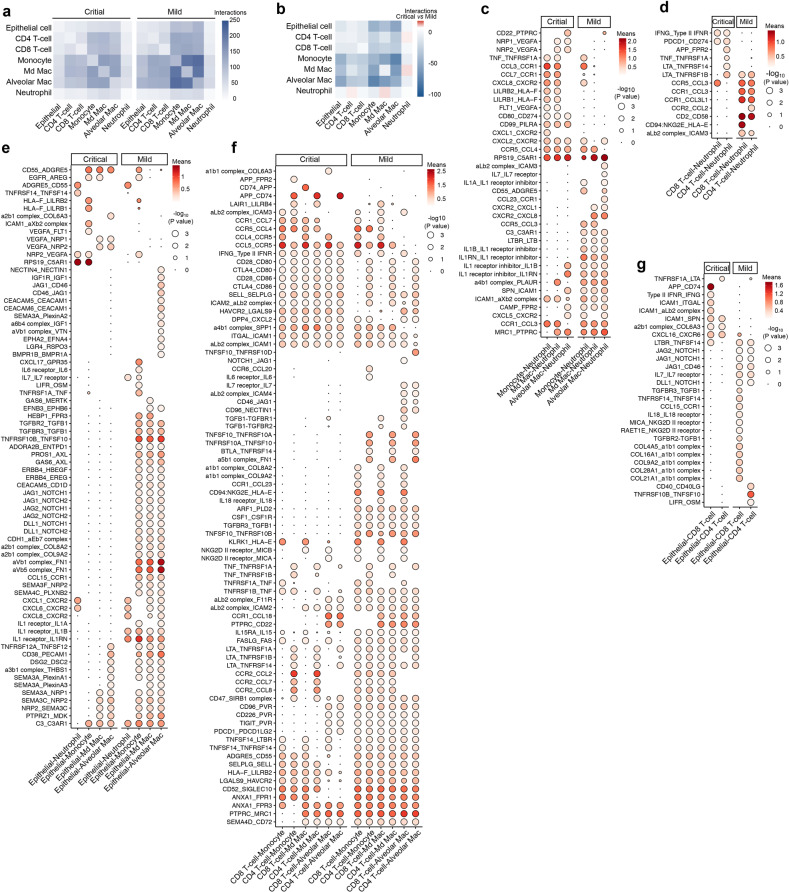
How the innate and adaptive host immune system miscommunicate to worsen COVID-19 immunopathology has not been fully elucidated. Here, we perform single-cell deep-immune profiling of bronchoalveolar lavage (BAL) samples from 5 patients with mild and 26 with critical COVID-19 in comparison to BALs from non-COVID-19 pneumonia and normal lung. We use pseudotime inference to build T-cell and monocyte-to-macrophage trajectories and model gene expression changes along them. In mild COVID-19, CD8+ resident-memory (TRM) and CD4+ T-helper-17 (TH17) cells undergo active (presumably antigen-driven) expansion towards the end of the trajectory, and are characterized by good effector functions, while in critical COVID-19 they remain more naïve. Vice versa, CD4+ T-cells with T-helper-1 characteristics (TH1-like) and CD8+ T-cells expressing exhaustion markers (TEX-like) are enriched halfway their trajectories in mild COVID-19, where they also exhibit good effector functions, while in critical COVID-19 they show evidence of inflammation-associated stress at the end of their trajectories. Monocyte-to-macrophage trajectories show that chronic hyperinflammatory monocytes are enriched in critical COVID-19, while alveolar macrophages, otherwise characterized by anti-inflammatory and antigen-presenting characteristics, are depleted. In critical COVID-19, monocytes contribute to an ATP-purinergic signaling-inflammasome footprint that could enable COVID-19 associated fibrosis and worsen disease-severity. Finally, viral RNA-tracking reveals infected lung epithelial cells, and a significant proportion of neutrophils and macrophages that are involved in viral clearance.


Conflict of interest statement

The authors declare no competing interests.

Figures

Fig. 1
Fig. 1. Annotation of cell types by scRNA-seq in COVID-19 and non-COVID-19 BAL.
a UMAP representation of 65,166 cells (obtained from BAL from n = 13 non-COVID-19, n = 2 mild and n = 22 critical COVID-19 patients) by scRNA-seq color-coded for the indicated cell type. pDC, plasmacytoid dendritic cell; cDC, conventional dendritic cell; NK, natural-killer cell; Md_Mac, monocyte-derived macrophage; Alveolar_Mac, alveolar macrophage; AT2, alveolar type II epithelial cell. b UMAP panels stratified per individual patient, COVID-19 vs non-COVID-19 and mild vs critical COVID-19. c Relative contribution of each cell type (in %) in COVID-19 vs non-COVID-19. d Relative contribution of each cell type (in %) in mild vs critical COVID-19. P values were assessed by Mann–Whitney test. *P < 0.05, **P < 0.01, ***P < 0.001. After correction for disease severity, gender, age and underlying disorders (hypertension and type II diabetes), only neutrophils and epithelial cells differed significantly (P = 0.031 and P = 0.014, respectively).
Fig. 2
Fig. 2. 14 T-cell phenotypes in mild and critical COVID-19 BAL.
a Subclustering of 23,468 T-/NK-cells into 14 T-/NK-cell phenotypes, as indicated by the color-coded legend. NK_cyto, cytotoxic NK cell; NK_inflam, inflammatory NK cell. b, c Heatmap showing marker genes for CD8+ (b) and CD4+ (c) T-cell phenotypes. d Relative contribution of each T-/NK-cell phenotype (in %) in COVID-19 vs non-COVID-19. e Relative contribution of each T-/NK-cell phenotype (in %) in mild vs critical COVID-19. P values were assessed by Mann–Whitney test. *P < 0.05, **P < 0.01, ***P < 0.001.
Fig. 3
Fig. 3. CD8+ T-cell phenotypes in mild and critical COVID-19 BAL.
a Pseudotime trajectories for CD8+ T-cells based on Slingshot, showing 3 lineages (TRM-lineage, TEX-lineage and TEMRA-lineage), color-coded for the CD8+ T-cell phenotypes (upper panel), the pseudotime (middle panel) and the number of clonotypes (lower panel). Since no scTCR-seq data were available from healthy lung tissue, the number of TEMRA-cells is very low in the clonotype analysis. b Profiling of marker and functional genes along these trajectories to confirm their functional annotation. c Dynamics of T-cell proliferation along the CD8+ T-cell lineages are depicted by plotting cell cycle G2M and S scores. d Density plots reflecting the number of T-cells along the 3 CD8+ T-cell lineages. e Density plots reflecting the number of T-cells along the 3 CD8+ T-cell lineages stratified for non-COVID-19, COVID-19 and normal lung. f Density plots reflecting the number of T-cells along the 3 CD8+ T-cell lineages stratified for mild vs critical COVID-19. g Analysis of clonotype sharing (thickness indicates proportion of sharing, circle size indicates clonotype counts) between the CD8+ T-cells. h, i TCR richness and TCR evenness along the 3 T-cell lineages for non-COVID-19 vs COVID-19 (h), and mild vs critical COVID-19 (i). j, k Gene expression dynamics along the CD8+ TRM- (j) and TEX-lineage (k). Genes cluster into 5 gene sets, each of them characterized by specific expression profiles, as depicted by a selection of marker gene characteristic for each set. Differences in trajectories were assessed by Mann–Whitney test. For CD8+ TRM: COVID-19 vs non-COVID-19 (P = 1.0E-6), mild vs critical COVID-19 (P = 5.9E-102). For CD8+ TEX: COVID-19 vs non-COVID-19 and normal lung (P = 2.3E-67), mild vs critical (P = 1.1E-39). For CD8+ TEMRA: normal lung vs COVID-19 and non-COVID-19 (P = 3.8E-39).
Fig. 4
Fig. 4. CD4+ T-cell developmental trajectories in mild and critical COVID-19 BAL.
a UMAP with pseudotime trajectories based on Slingshot, showing 3 lineages (TH1-lineage, TH17-lineage and TSCM-lineage), color-coded for the CD4+ T-cell phenotypes (left), the pseudotime (middle) and the number of clonotypes (right). TSCM-cells represent a subset of minimally differentiated T-cells characterized by phenotypic and functional properties that bridge naïve and conventional memory T-cells. TSCM-cells include cells that show high expression of naïve (or precursor) markers (CCR7, TCF7), but not of activation markers (GZMA), high expression of memory markers (CD27, CD28 and CD95), are more proliferative compared to TN- and TCM-cells (increased G2M and S scores), increased TCR clonotype expansion compared to TN- and TCM-cells. b Naïve and memory-related marker gene expression (left), and cell cycle scoring (right) reveal additional CD4+ T-cell subclusters. TSCM-cells are characterized by naïve marker genes (CCR7, TCF7), memory markers (CD27), cell proliferation but no GZMA expression. c Analysis of clonotype sharing (thickness indicates proportion of sharing, circle size indicates clonotype counts) between the CD4+ T-cell subclusters. d Profiling of marker and functional genes along these trajectories to confirm their functional annotation. e Dynamics of T-cell proliferation along the CD4+ T-cell lineages are depicted by plotting cell cycle G2M and S scores. f Density plots reflecting the number of T-cells along the 3 CD4+ T-cell lineages stratified for non-COVID-19, COVID-19 and normal lung. g Density plots reflecting the number of T-cells along the 3 CD4+ T-cell lineages stratified for mild vs critical COVID-19. h, i TCR richness and TCR evenness along the 3 CD4+ T-cell lineages comparing non-COVID-19 vs COVID-19 (h) and mild vs critical COVID-19 (i). j, k Gene expression dynamics along the CD4+ TH1- (j) and TH17-lineage (k). Genes cluster into 5 gene sets, each of them characterized by specific expression profiles, as depicted by a selection of marker genes characteristic for each set. Differences in trajectories were assessed by Mann–Whitney test. For CD4+ TH1 and CD4+ TSCM: COVID-19 vs non-COVID-19 and lung normal (P = 1.4E-6 and 5.9E-37), For CD4+ TTh17: COVID-19 vs non-COVID-19 (P = 9.7E-12), mild vs critical COVID-19 (P = 1.3E-121).
Fig. 5
Fig. 5. Monocyte-to-macrophage differentiation in COVID-19 BAL.
a Subclustering of myeloid cells into 9 phenotypes, as indicated by the color-coded legend. b Heatmap showing myeloid cell phenotypes with corresponding functional gene sets. c Relative contribution of each cell type (in %) to COVID-19 vs non-COVID-19 BAL. d Relative contribution of each cell type (in %) to mild vs critical COVID-19 BAL. e Pseudotime trajectories for myeloid cells based on Slingshot, showing the common branch of FCN1hi monocytes differentiating into either RGS1hi monocyte-derived macrophages (RGS1hi-lineage) or FABP4hi tissue-resident alveolar macrophages (alveolar lineage). f Profiling of marker genes along these trajectories to confirm their functional annotation: FCN1, S100A12, CCL2, CCL18 for the common branch, FABP4 and PPARG for the alveolar lineage, RGS1 and GPR183 for the RGS1-lineage. g Density plots reflecting the number of myeloid cells along the 2 lineages stratified for non-COVID-19 vs COVID-19. h Density plots reflecting the number of myeloid cells along the 2 lineages stratified for mild vs critical COVID-19. i Gene expression dynamics along the alveolar lineage. Genes cluster into 5 gene sets, each of them characterized by specific expression profiles, as depicted by a selection of genes characteristic for each cluster. j Normalized ATP level measured from BAL supernatans comparing COVID-19 vs non-COVID-19 (left) and mild vs critical COVID-19 patients (right). k–m Profiling of IFN type I and II signaling along the 3 CD8+ (k) and CD4+ (l) T-cell lineages, and along the monocyte-macrophage lineage (m), comparing mild vs critical COVID-19. All P values were assessed by a Mann–Whitney test. *P < 0.05, **P < 0.01, ***P < 0.001. P values comparing COVID-19 vs non-COVID-19, and mild vs critical COVID-19 for density plots were all < 10E-50.
Fig. 6
Fig. 6. Neutrophil, dendritic cell and B-cell phenotypes in COVID-19 BAL.
a Subclustering of neutrophils into 5 phenotypes, as indicated by the color-coded legend. b UMAP showing expression of a marker gene for each neutrophil phenotype. c Heatmap showing neutrophil phenotypes with corresponding marker genes and functional gene sets. d Relative contribution of each neutrophil phenotype (in %) to COVID-19 vs non-COVID-19. e Relative contribution of each neutrophil phenotype (in %) to mild vs critical COVID-19. f Subclustering of DCs into 6 phenotypes, as indicated by the color-coded legend. g Heatmap showing DC phenotypes with corresponding marker genes and functional gene sets. h Relative contribution of each DC phenotype (in %) to COVID-19 vs non-COVID-19. i Relative contribution of each DC phenotype (in %) to mild vs critical COVID-19. j Subclustering of B-cells and plasma cells into 4 phenotypes, as indicated by the color-coded legend. k Heatmap showing B-cell and plasma cell phenotypes with corresponding marker genes and functional gene sets. l Feature plots of marker gene expression for each B-cell and plasma cell subcluster. m Violin plots showing cell cycle scores and mitochondrial gene expression by plasma cell subcluster. n B-cell receptor evenness in B-cell and plasma cell subclusters. o Relative contribution of each B-cell and plasma cell phenotype (in %) to COVID-19 vs non-COVID-19. p Relative contribution of each B-cell and plasma cell phenotype (in %) to mild vs critical COVID-19. P values were assessed by a Mann–Whitney test. *P < 0.05, **P < 0.01, ***P < 0.001.
Fig. 7
Fig. 7. SARS-CoV-2 RNA detection in epithelial and immune cells.
a Subclustering of epithelial cells into 7 phenotypes, as indicated by the color-coded legend. b Heatmap showing epithelial cell phenotypes with corresponding marker genes. c Relative contribution of each epithelial cell phenotype (in %) to COVID-19 vs non-COVID-19. d Relative contribution of each epithelial cell phenotype (in %) to mild vs critical COVID-19. e, f Expression level of ACE2 (e) and TMPRSS2 (f) by epithelial cell subclusters, comparing COVID-19 vs non-COVID-19. g Expression levels of ACE2, TMPRSS2 and SARS-CoV-2 (cells with viral reads) RNA in epithelial, myeloid and lymphoid cells from COVID-19. h Detection of 11 SARS-CoV-2 open-reading frames in epithelial, myeloid and lymphoid cells from COVID-19. i Detection of spike protein (S) and nucleocapsid protein (N) encoding viral RNA in epithelial cells and immune cell subclusters from COVID-19. Cell types with < 50 positive cells are not shown. j Differential gene expression of S+ vs S epithelial cells from 17 COVID-19 patients in which viral reads were detected. k REACTOME pathway analysis based on differentially expressed genes between S+ vs S- virus infected epithelial cells. l Relative percentage of cells containing reads mapping to the viral N gene (upper panel) and total number of cells that contain reads mapping to the N gene (lower panel) stratified for each of the cell types. m Differential gene expression of N+ vs N neutrophils from 17 COVID-19 patients in which viral reads were detected. n, o REACTOME (n) and GO (o) pathway analysis on IFN-signaling and response-to-virus signaling, comparing N+ vs N neutrophils from 17 COVID-19 patients in which viral reads were detected. p Detection of reads mapping to SARS-CoV-2 and to N in neutrophil subclusters from COVID-19 BAL. P values were assessed by a Mann–Whitney test. *P < 0.05, **P < 0.01, ***P < 0.001.
Fig. 8
Fig. 8. Cell-to-cell communication between epithelial and immune cells.
a Number of predicted interactions (P ≤ 0.05) between monocytes, macrophages, T-cells, neutrophils and epithelial cells based on CellPhoneDB in critical (left panel) and mild (right panel) COVID-19. b Differences in the number of predicted interactions, comparing mild vs critical COVID-19, showing generally more interactions in mild COVID-19. c Predicted interactions between monocytes/macrophages and neutrophils, comparing critical vs mild COVID-19. d Predicted interactions between T-cells and neutrophils, comparing critical vs mild COVID-19. e Predicted interactions between epithelial and myeloid cells, comparing critical vs mild COVID-19. f Predicted interactions between T-cells and monocytes/macrophages, comparing critical vs mild COVID-19. g Predicted interactions between T-cells and epithelial cells, comparing critical vs mild COVID-19.

References

    1. World Health Organization. WHO Coronavirus Disease (COVID-19) Dashboard. Covid-19 Dashboard 1–1 (2020).
    1. Fu L, et al. Clinical characteristics of coronavirus disease 2019 (COVID-19) in China: a systematic review and meta-analysis. J. Infect. 2020;80:656–665. doi: 10.1016/j.jinf.2020.03.041. - DOI - PMC - PubMed
    1. Chen G, et al. Clinical and immunological features of severe and moderate coronavirus disease 2019. J. Clin. Investig. 2020;130:2620–2629. doi: 10.1172/JCI137244. - DOI - PMC - PubMed
    1. Liu K, et al. Clinical characteristics of novel coronavirus cases in tertiary hospitals in Hubei Province. Chin. Med. J. (Engl). 2020;133:1025–1031. doi: 10.1097/CM9.0000000000000744. - DOI - PMC - PubMed
    1. Wen W, et al. Immune cell profiling of COVID-19 patients in the recovery stage by single-cell sequencing. Cell Discov. 2020;6:31. doi: 10.1038/s41421-020-0168-9. - DOI - PMC - PubMed

Publication types

MeSH terms