. 2021 Feb;590(7844):122-128.
doi: 10.1038/s41586-020-03160-0. Epub 2021 Jan 20.

Restoring metabolism of myeloid cells reverses cognitive decline in ageing

Affiliations

Restoring metabolism of myeloid cells reverses cognitive decline in ageing

Paras S Minhas et al. Nature. 2021 Feb.

Abstract

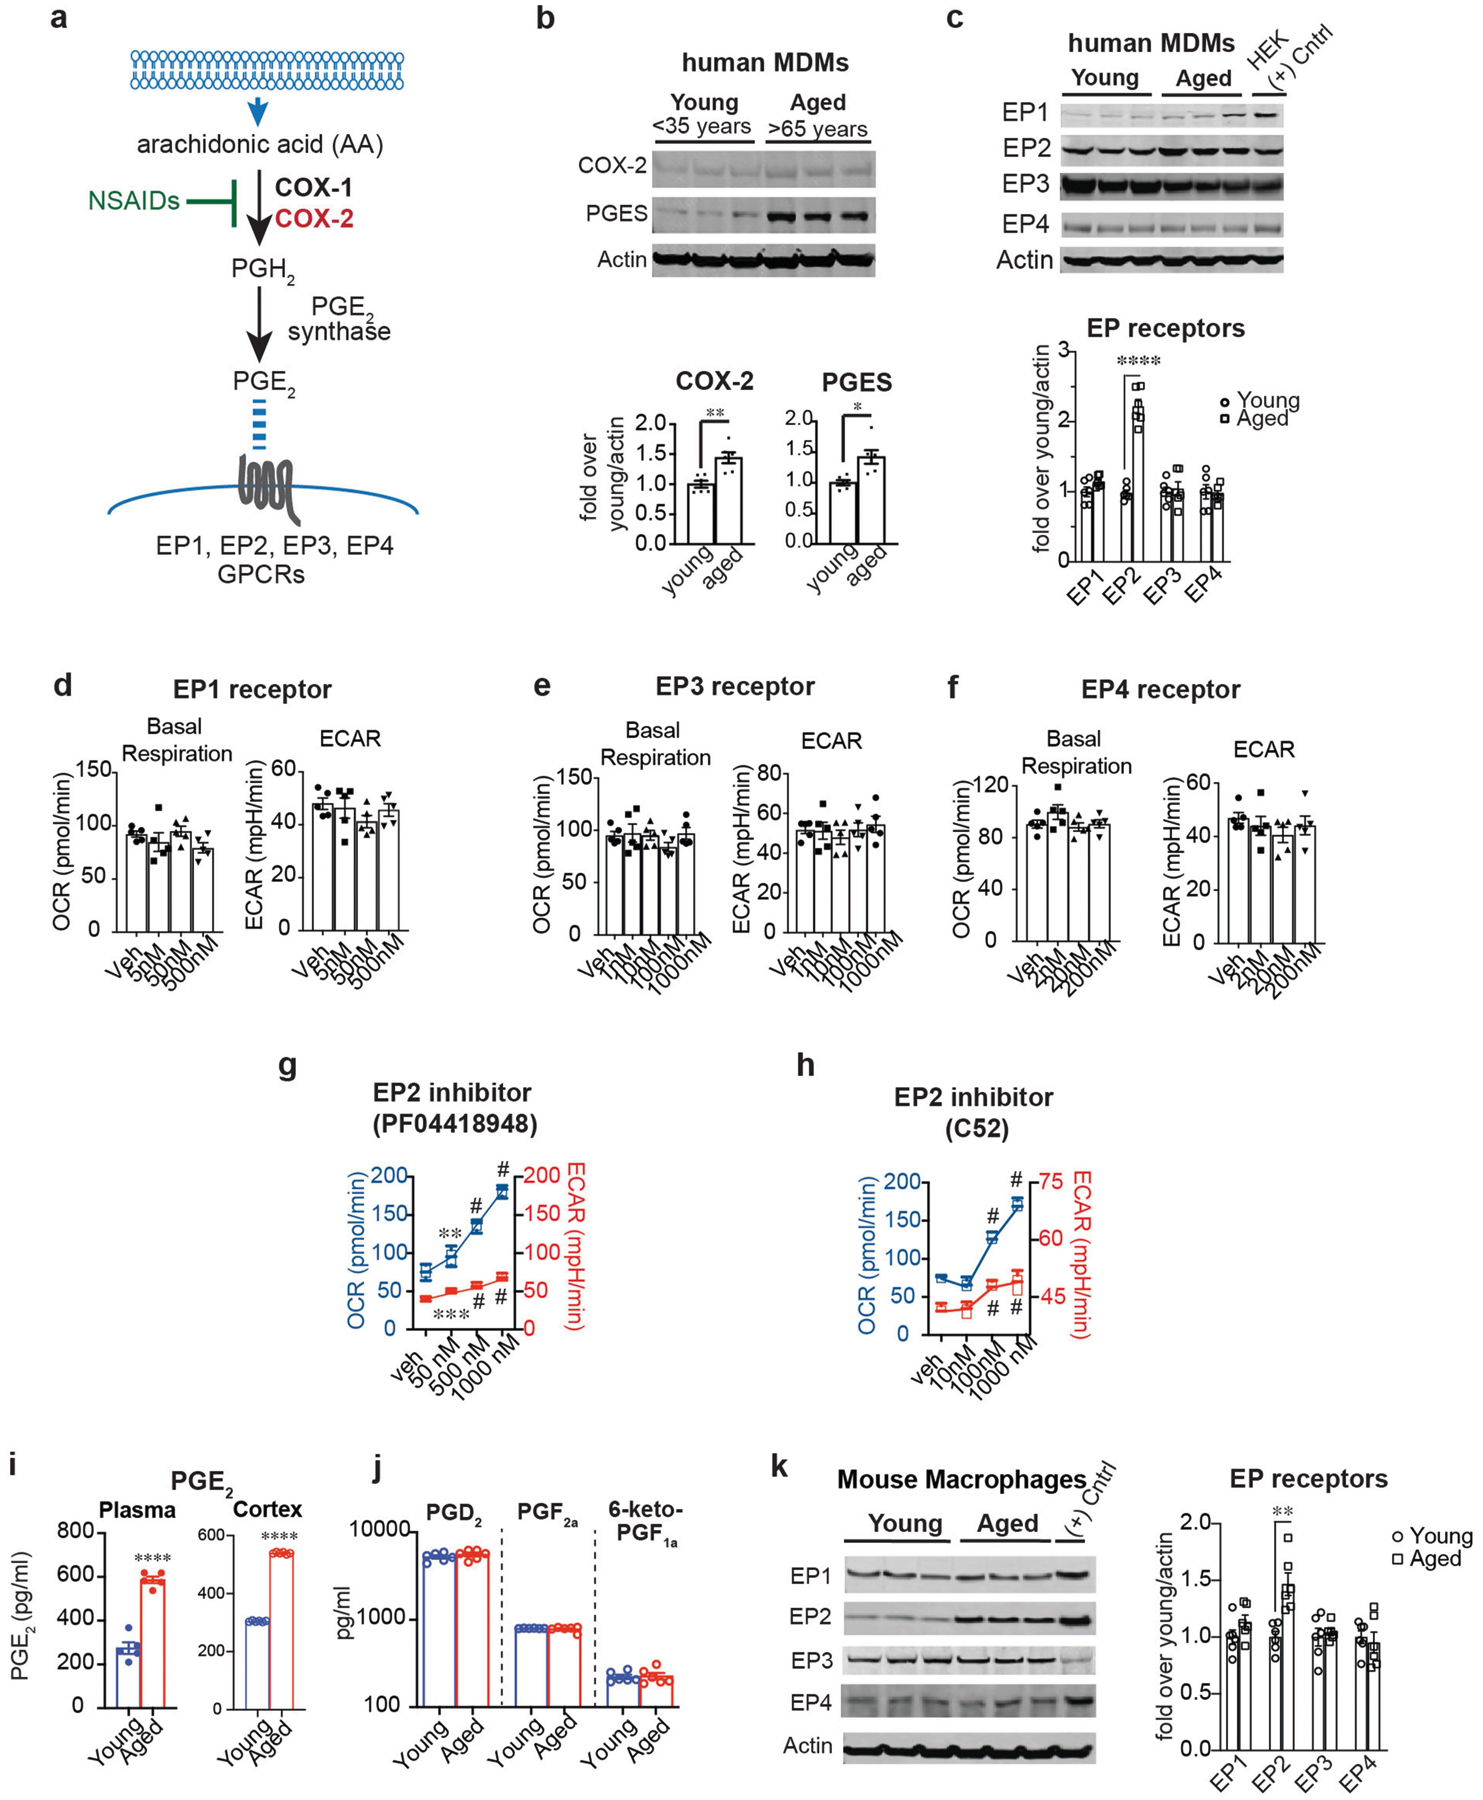
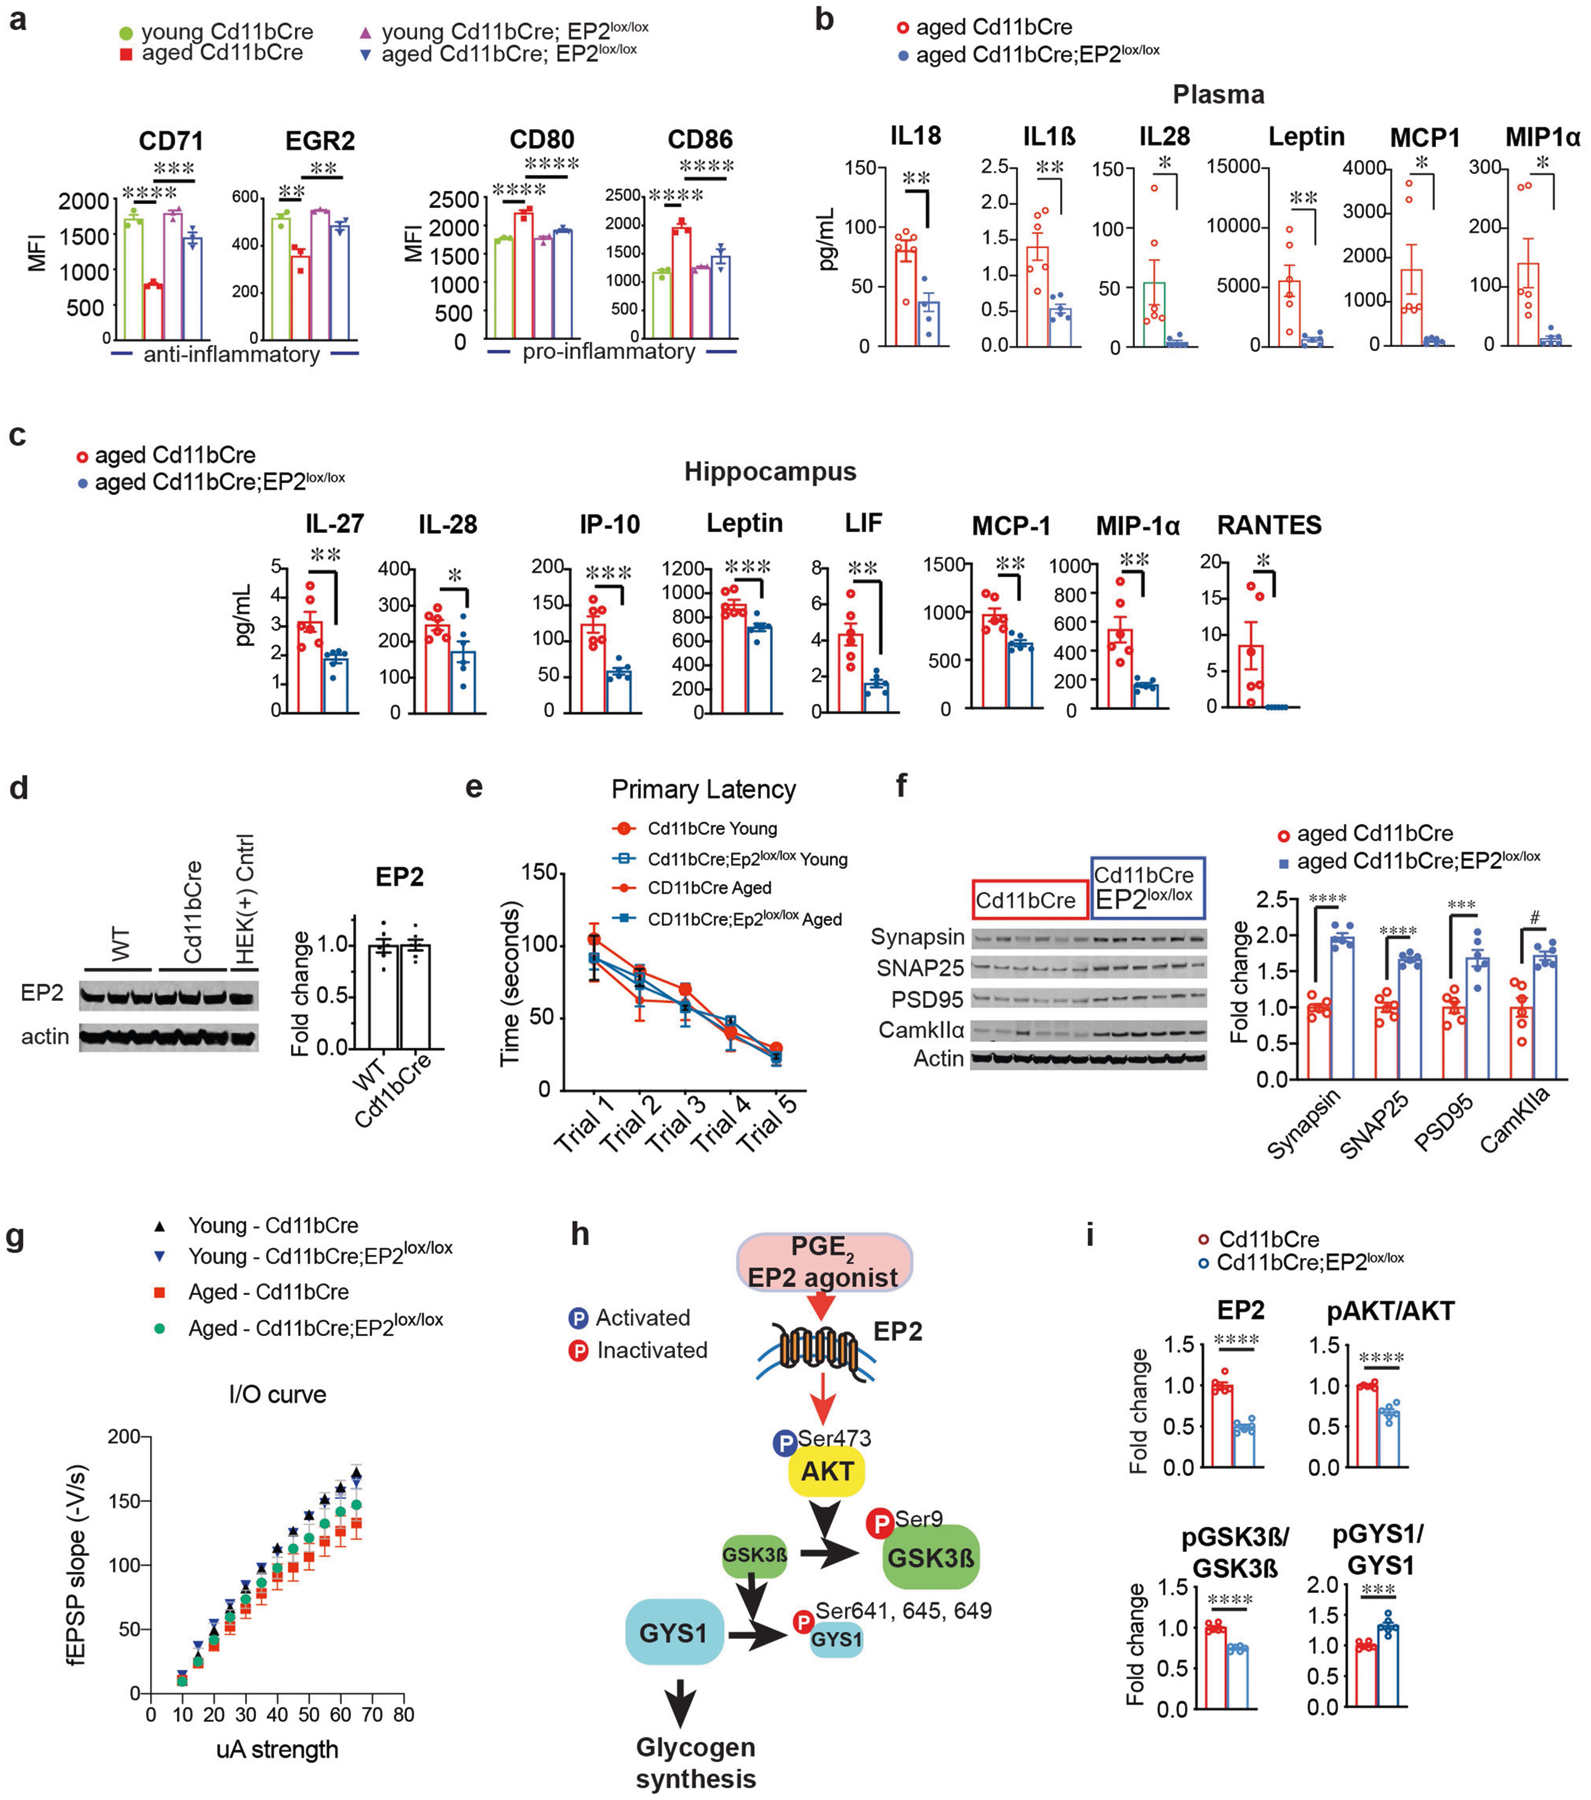
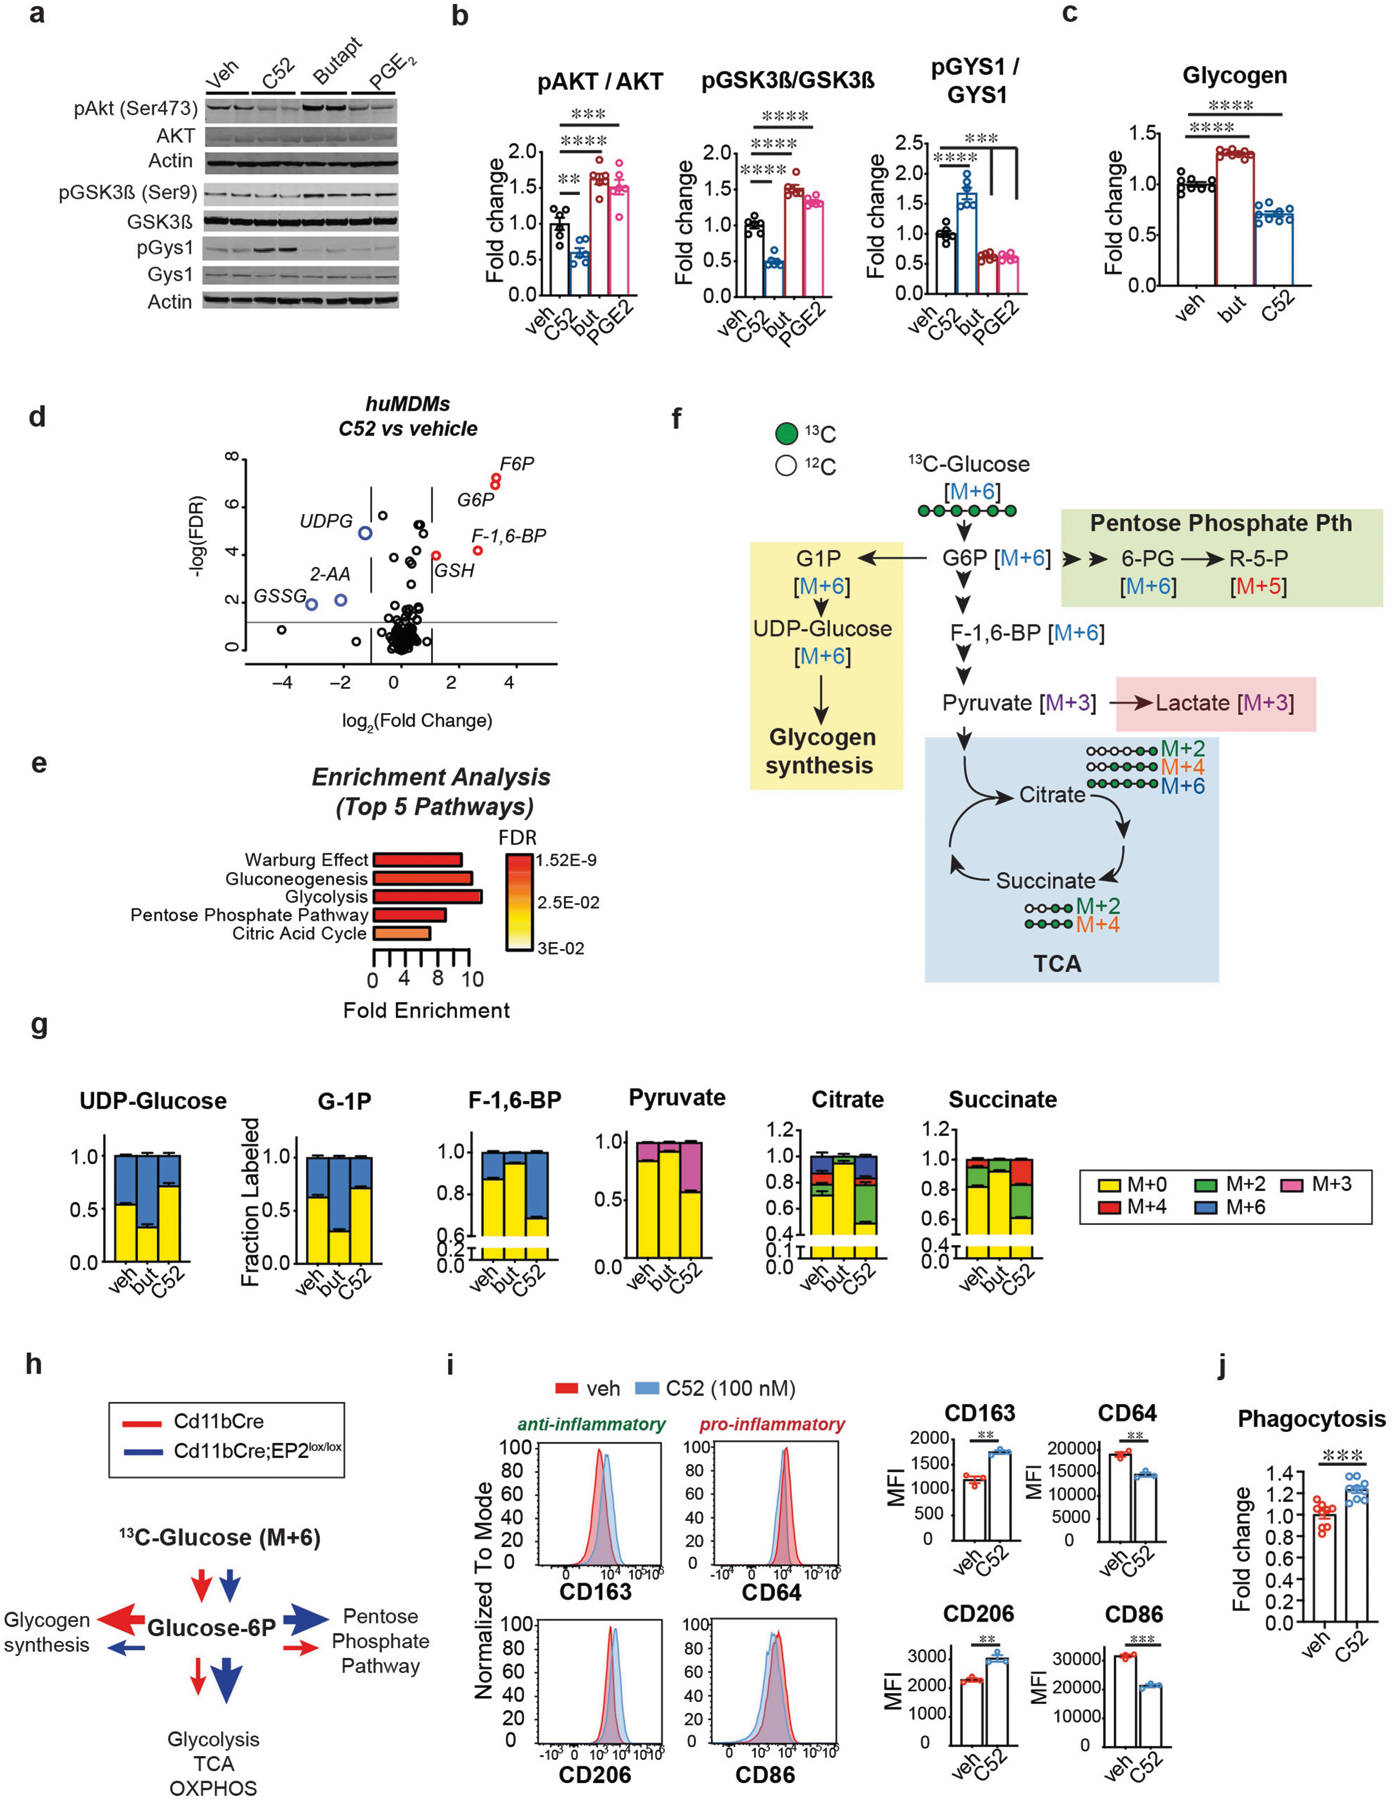
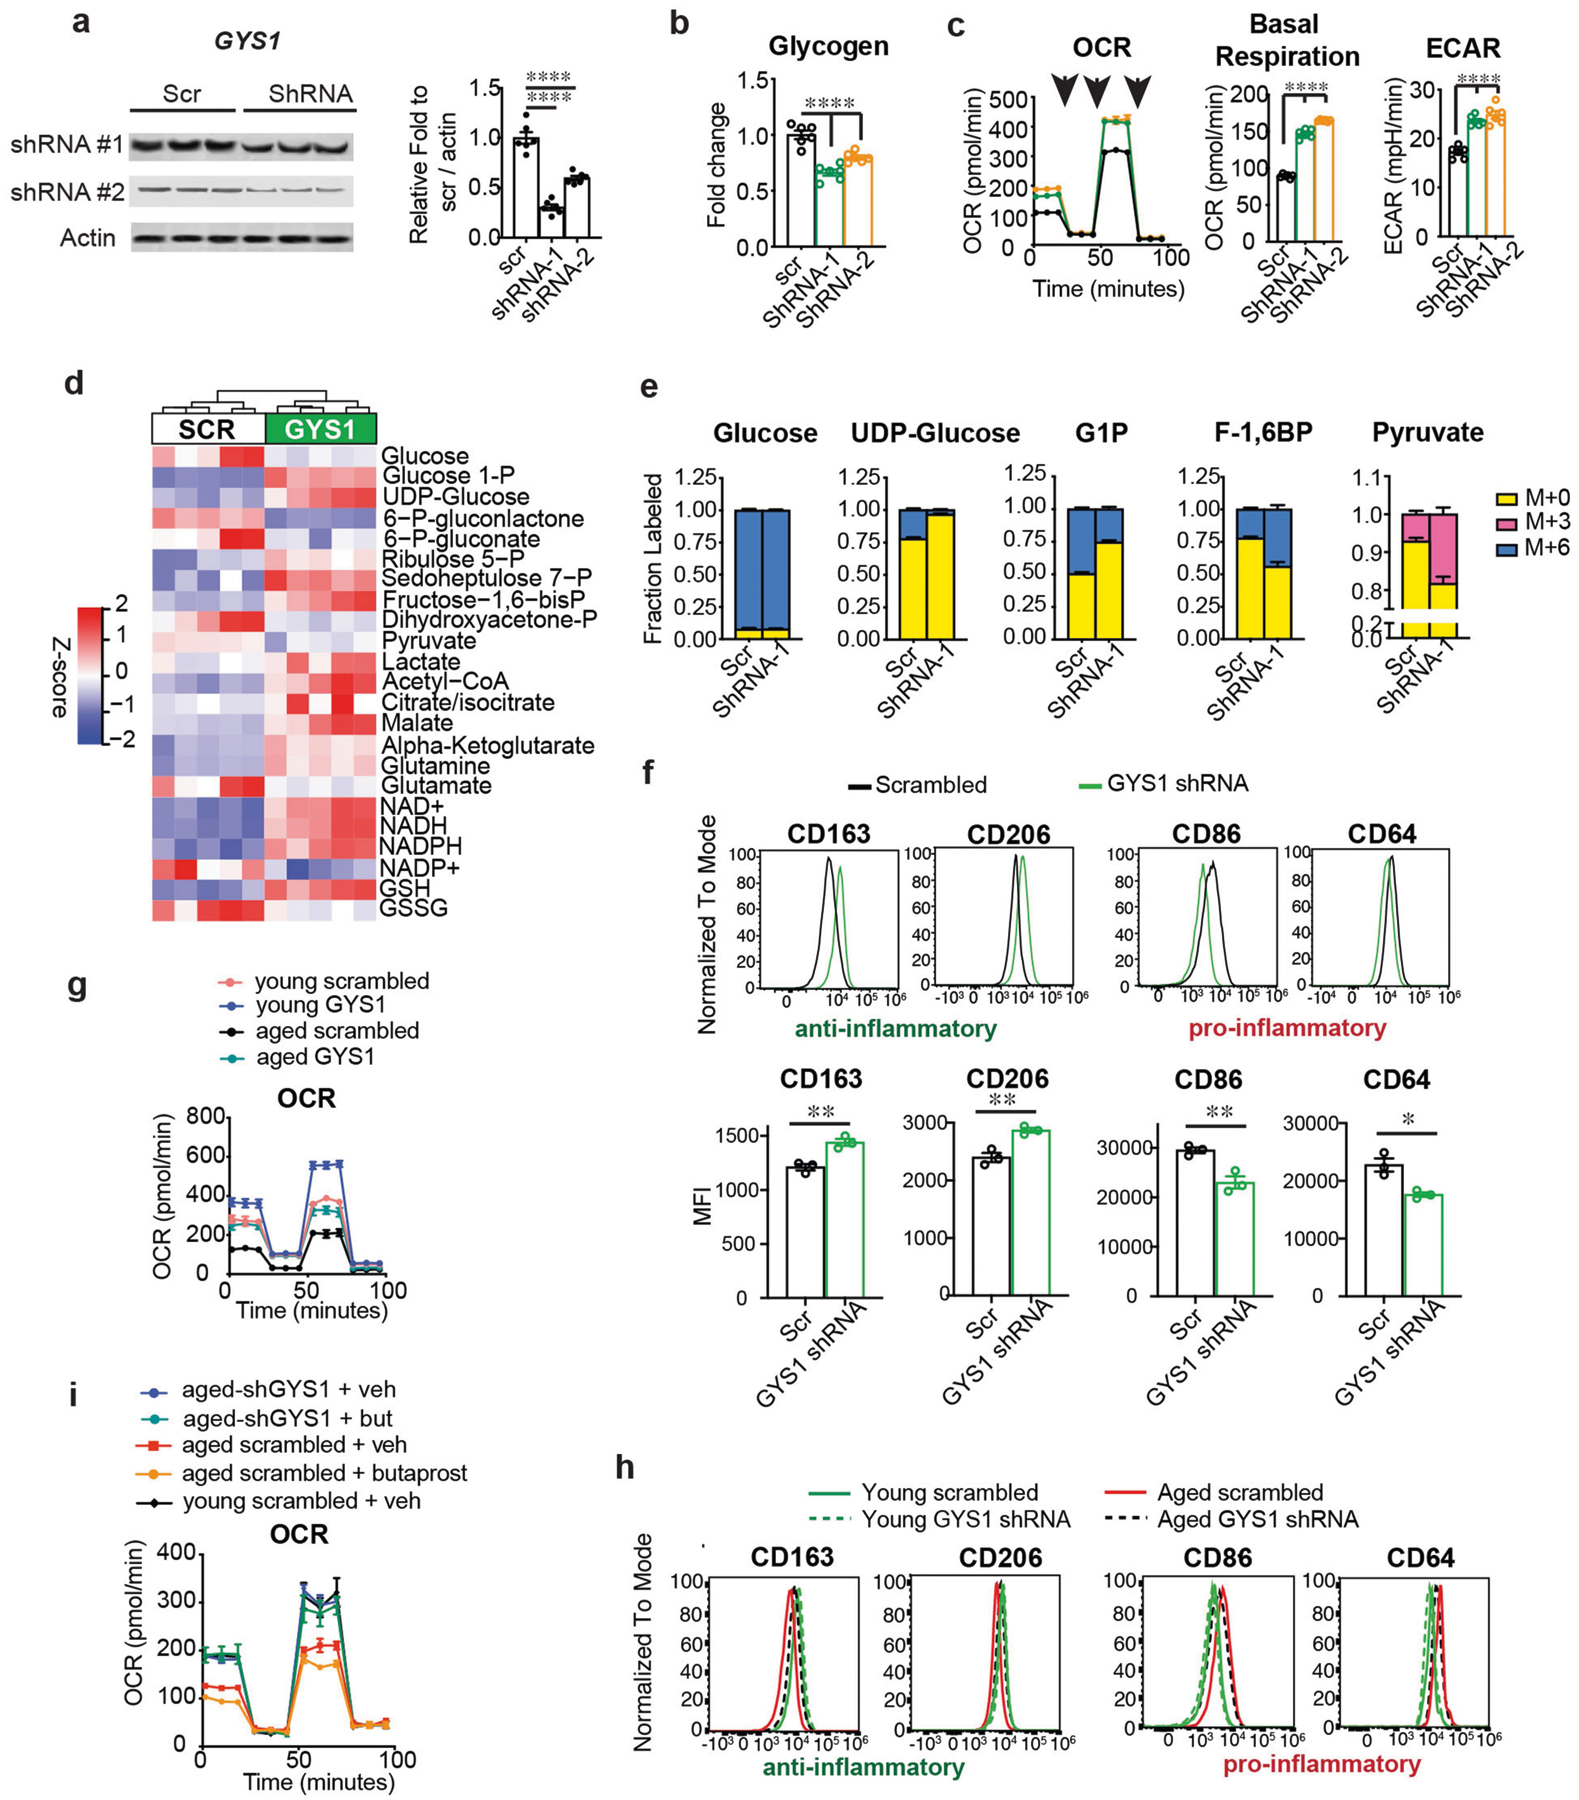
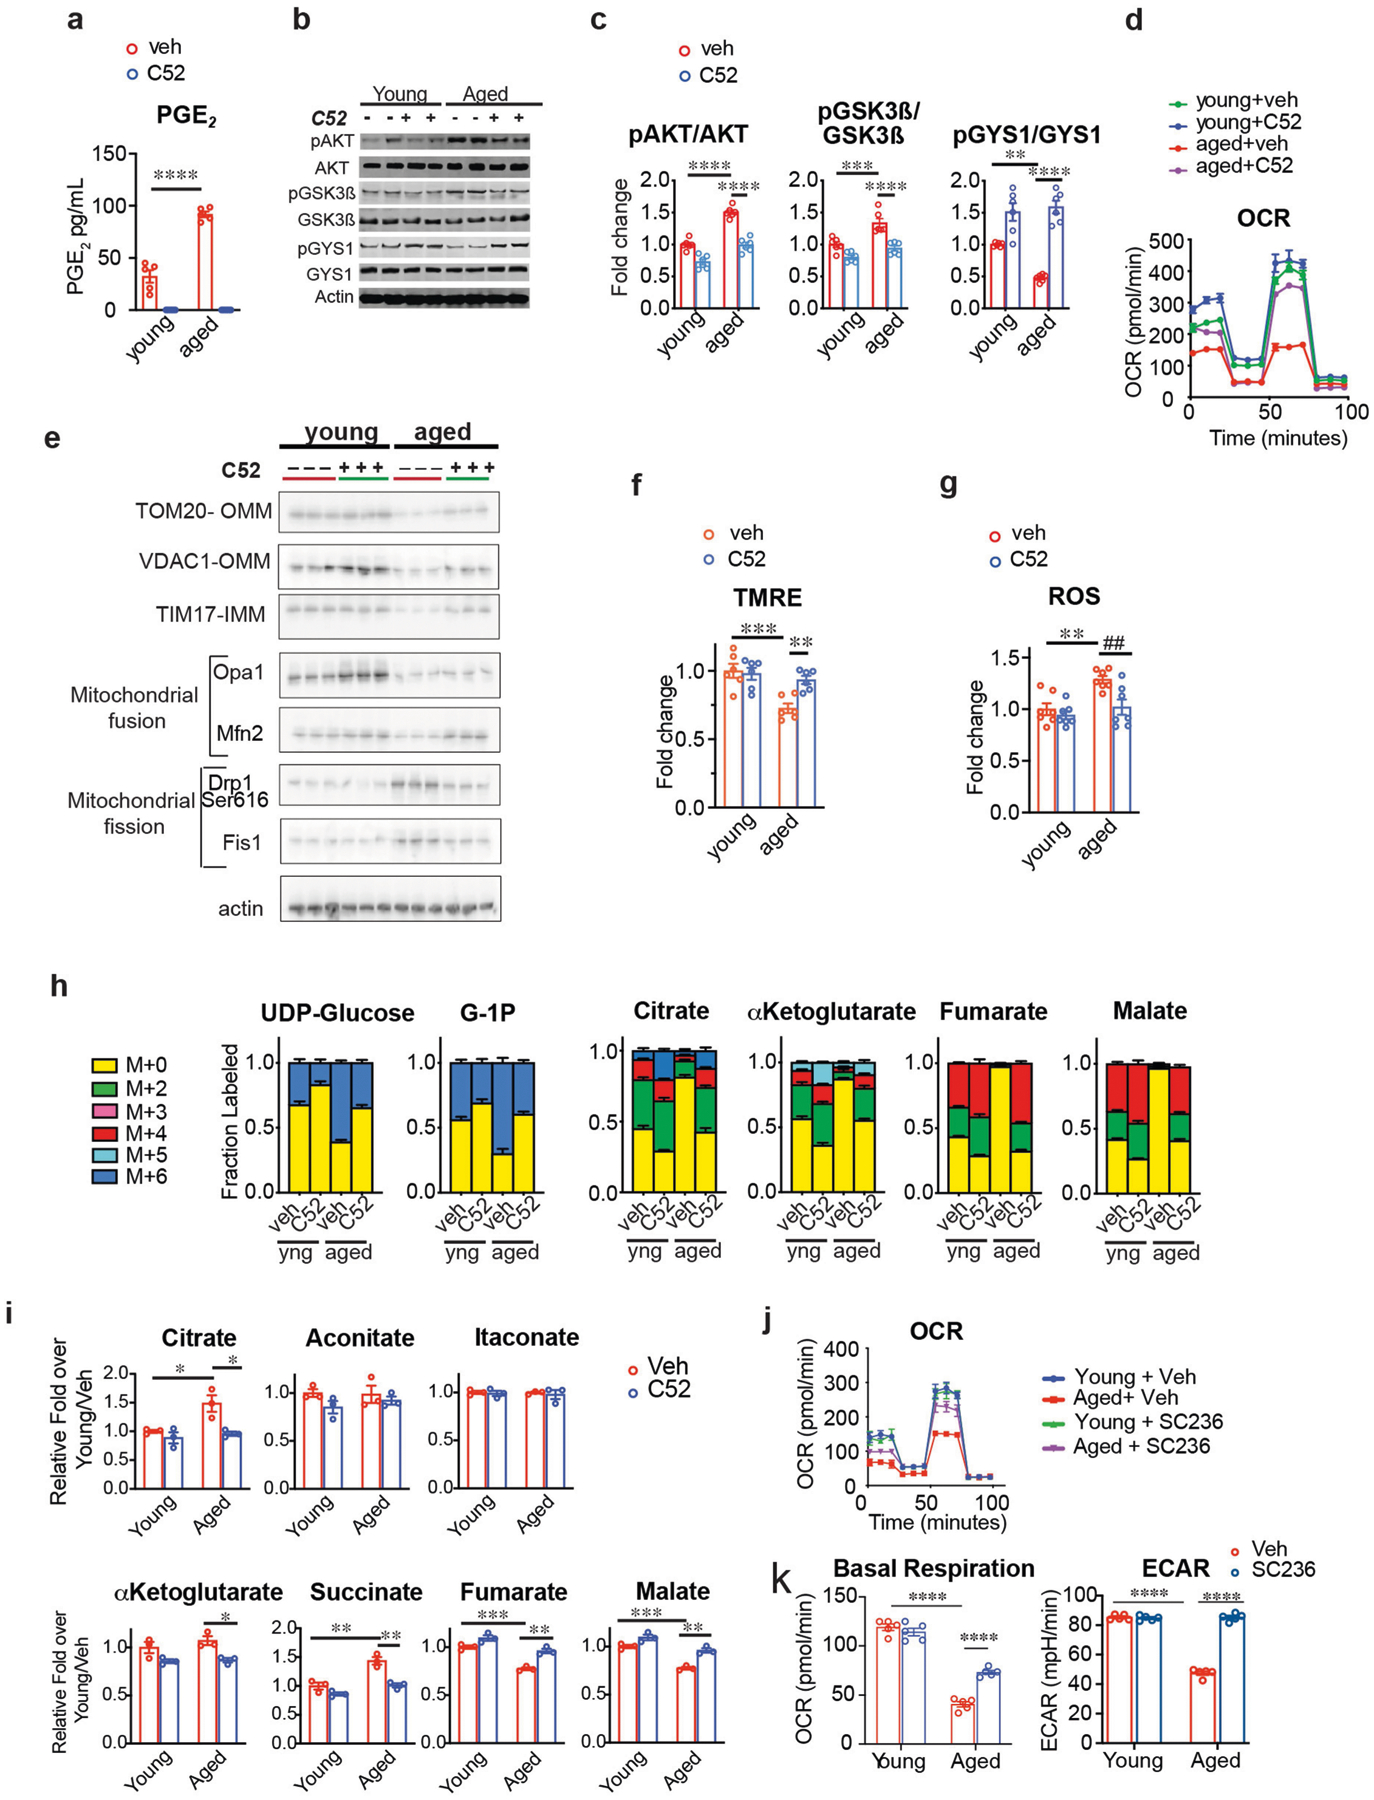
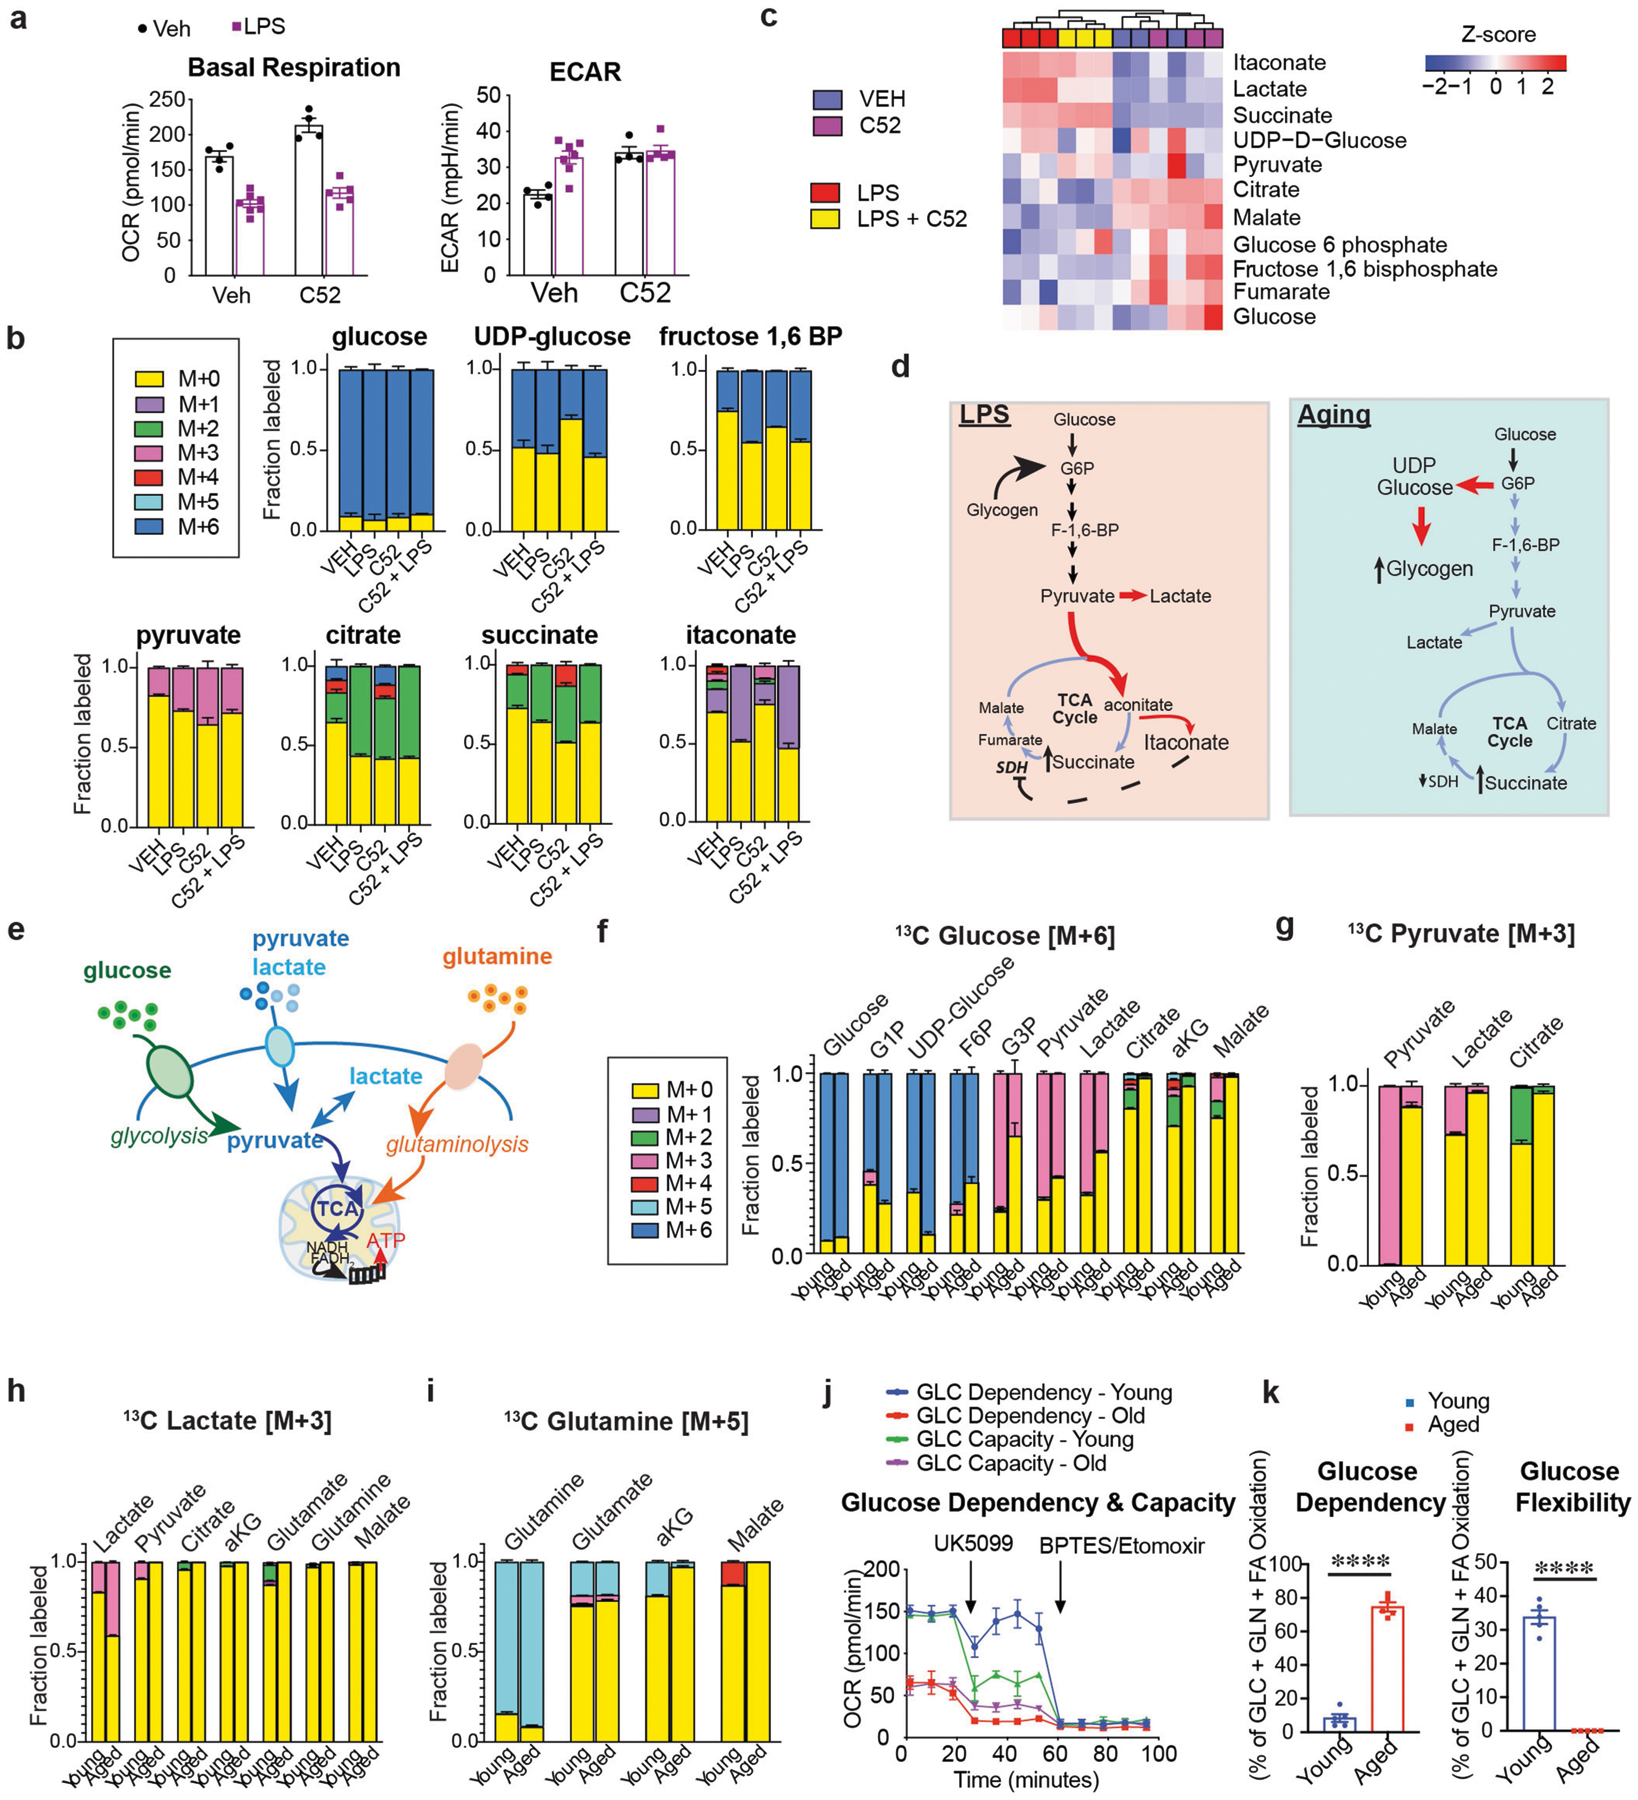
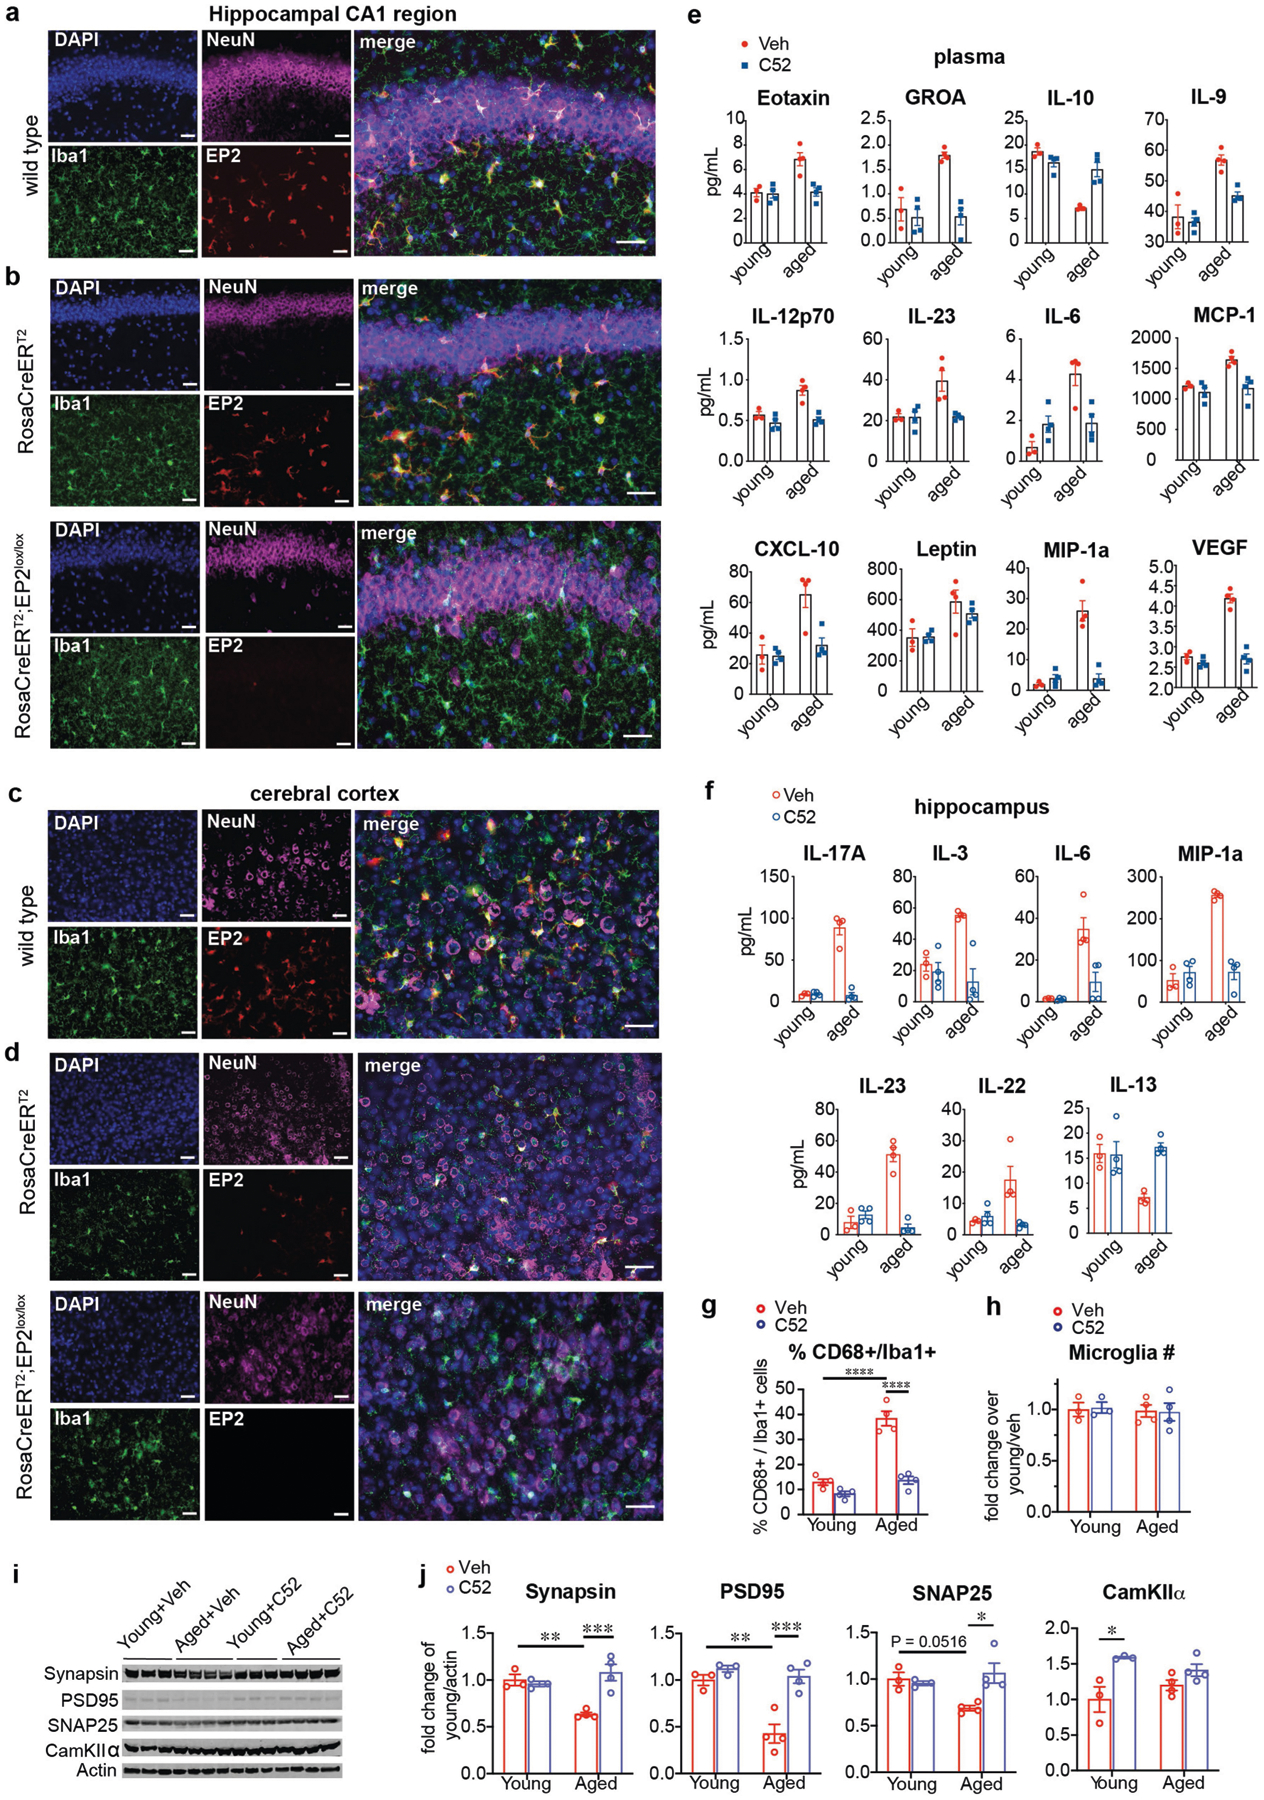
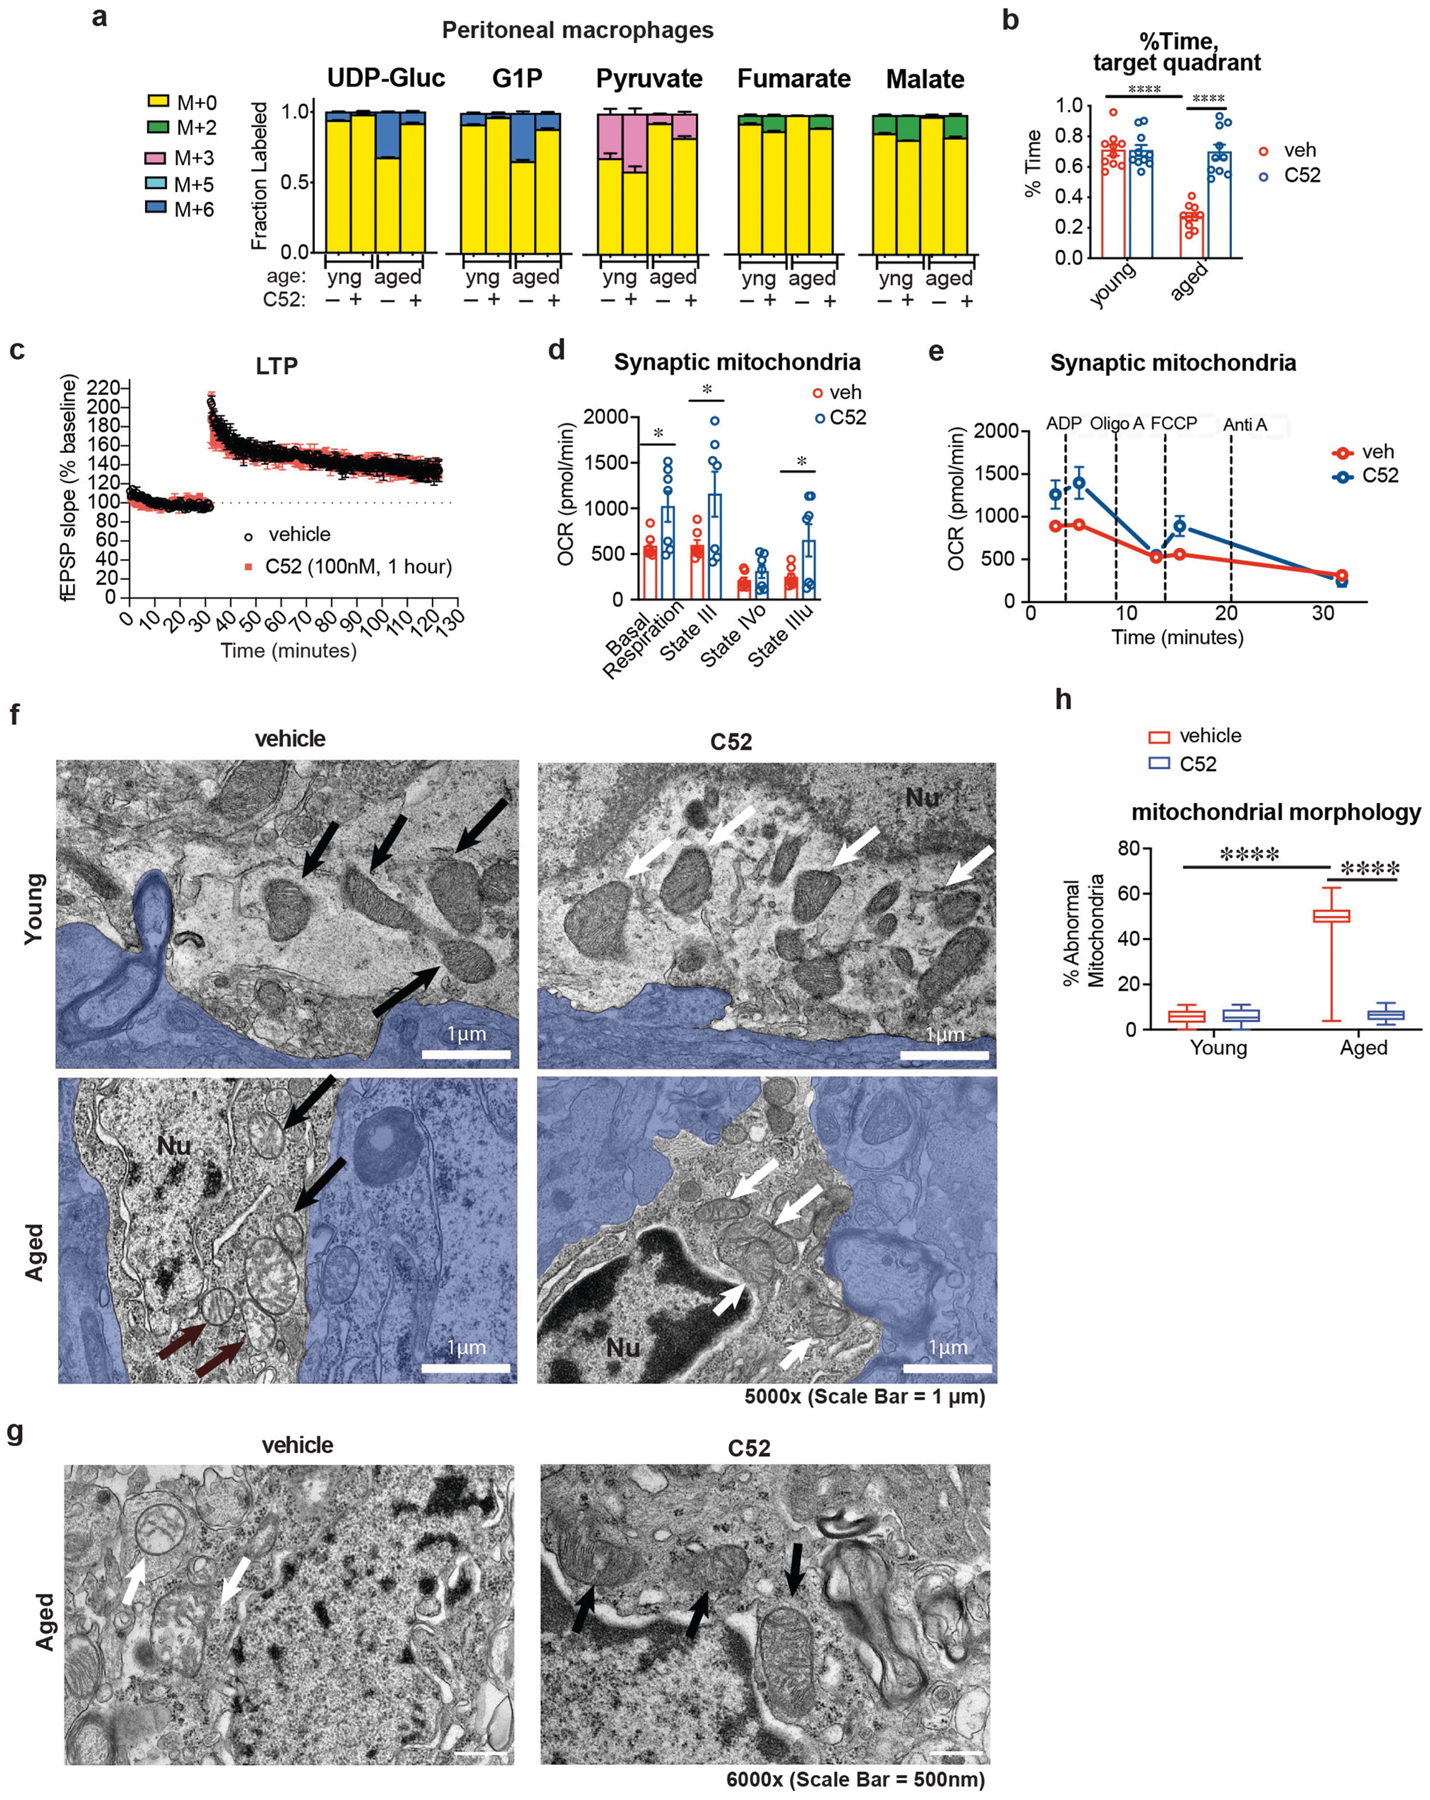
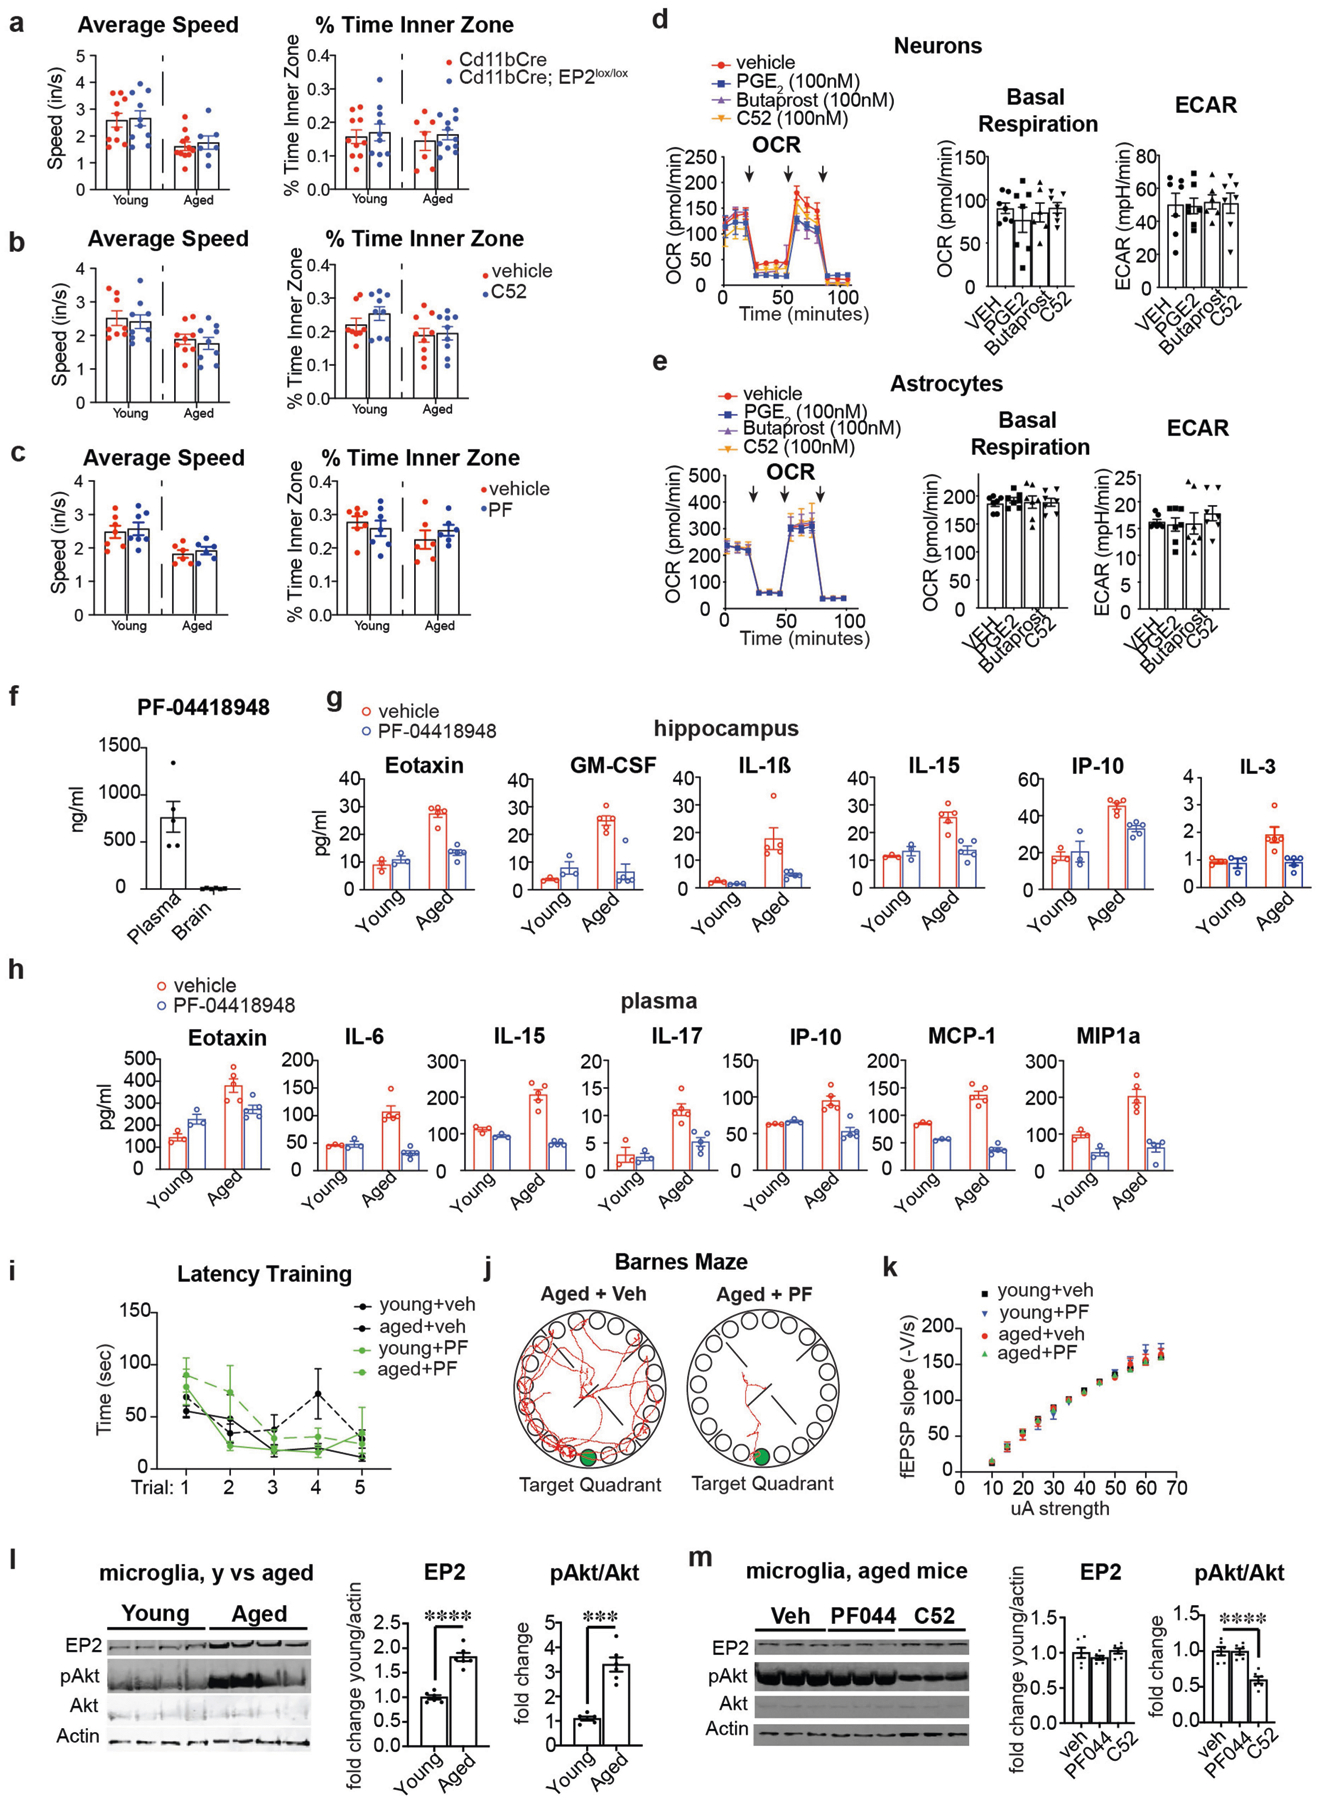
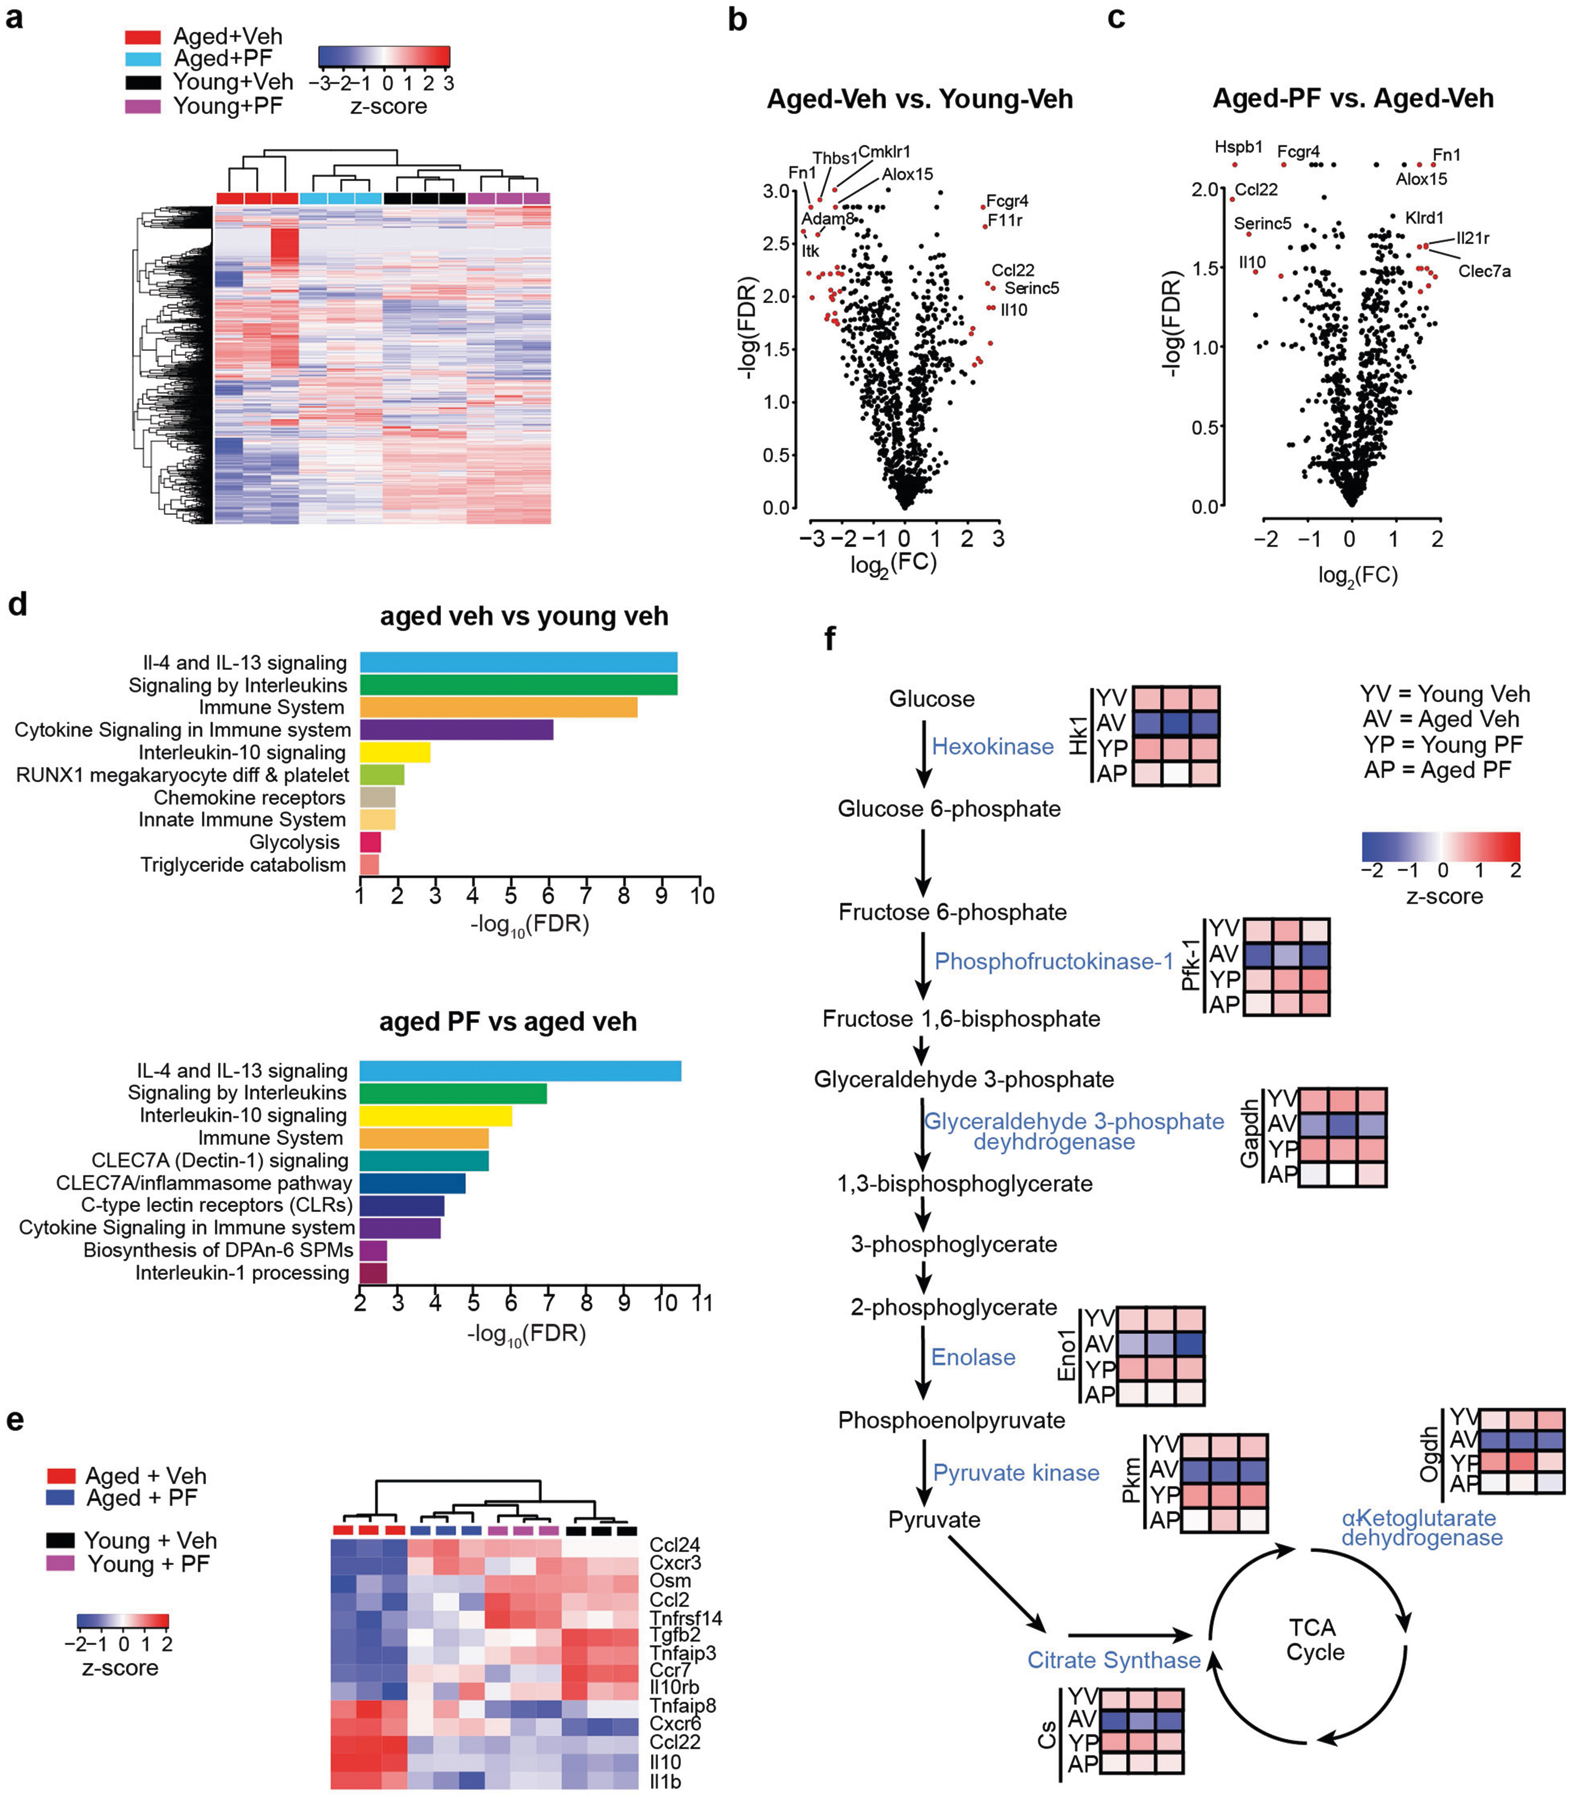
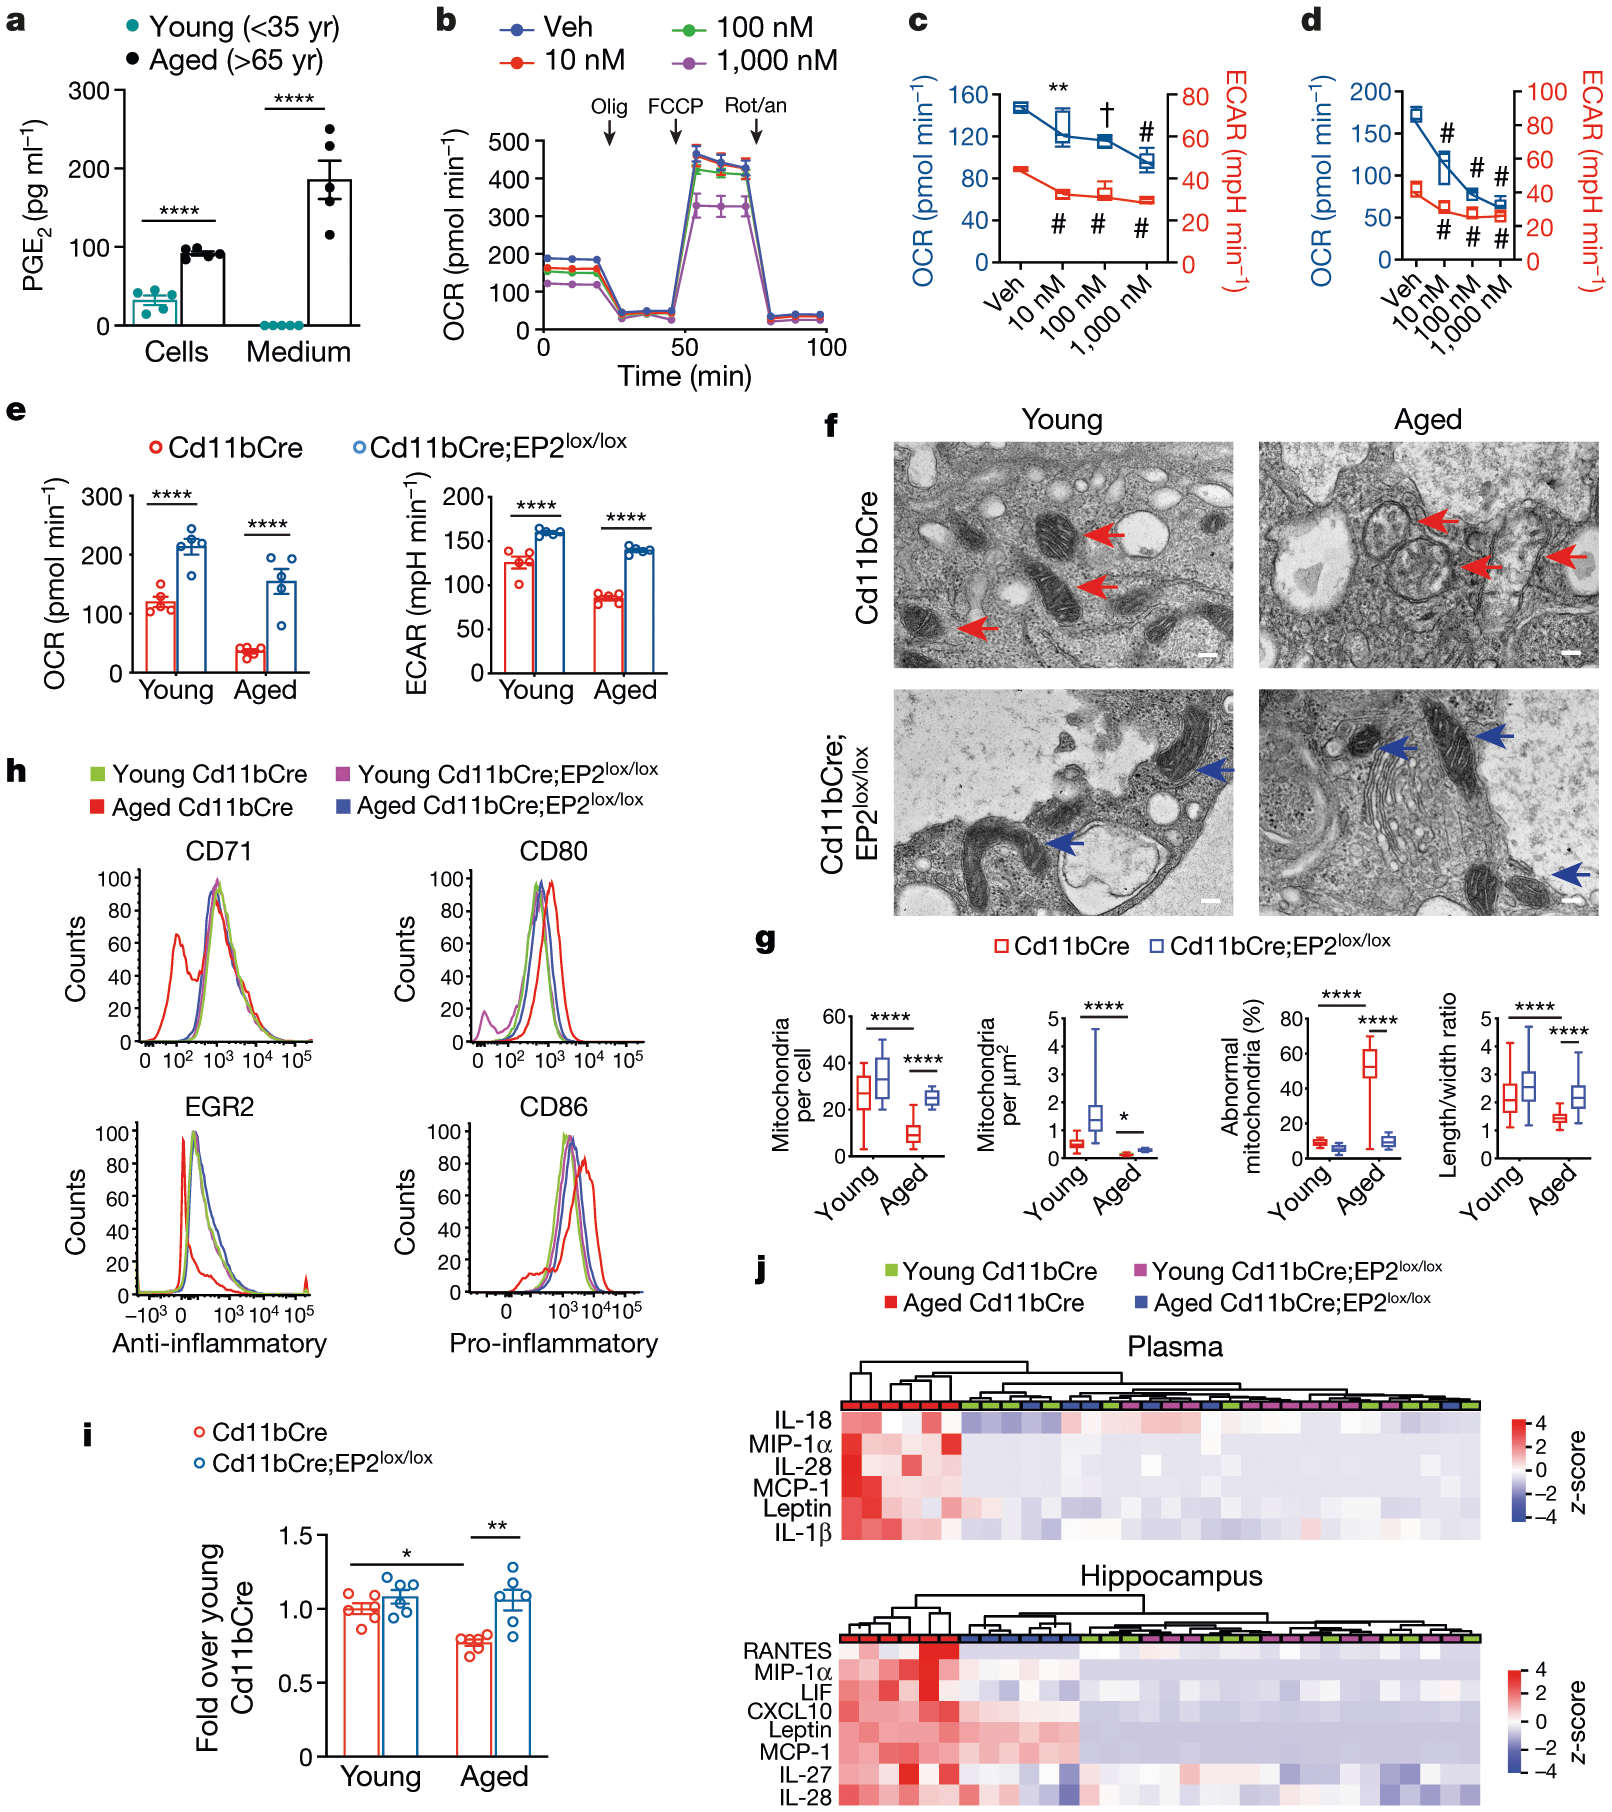
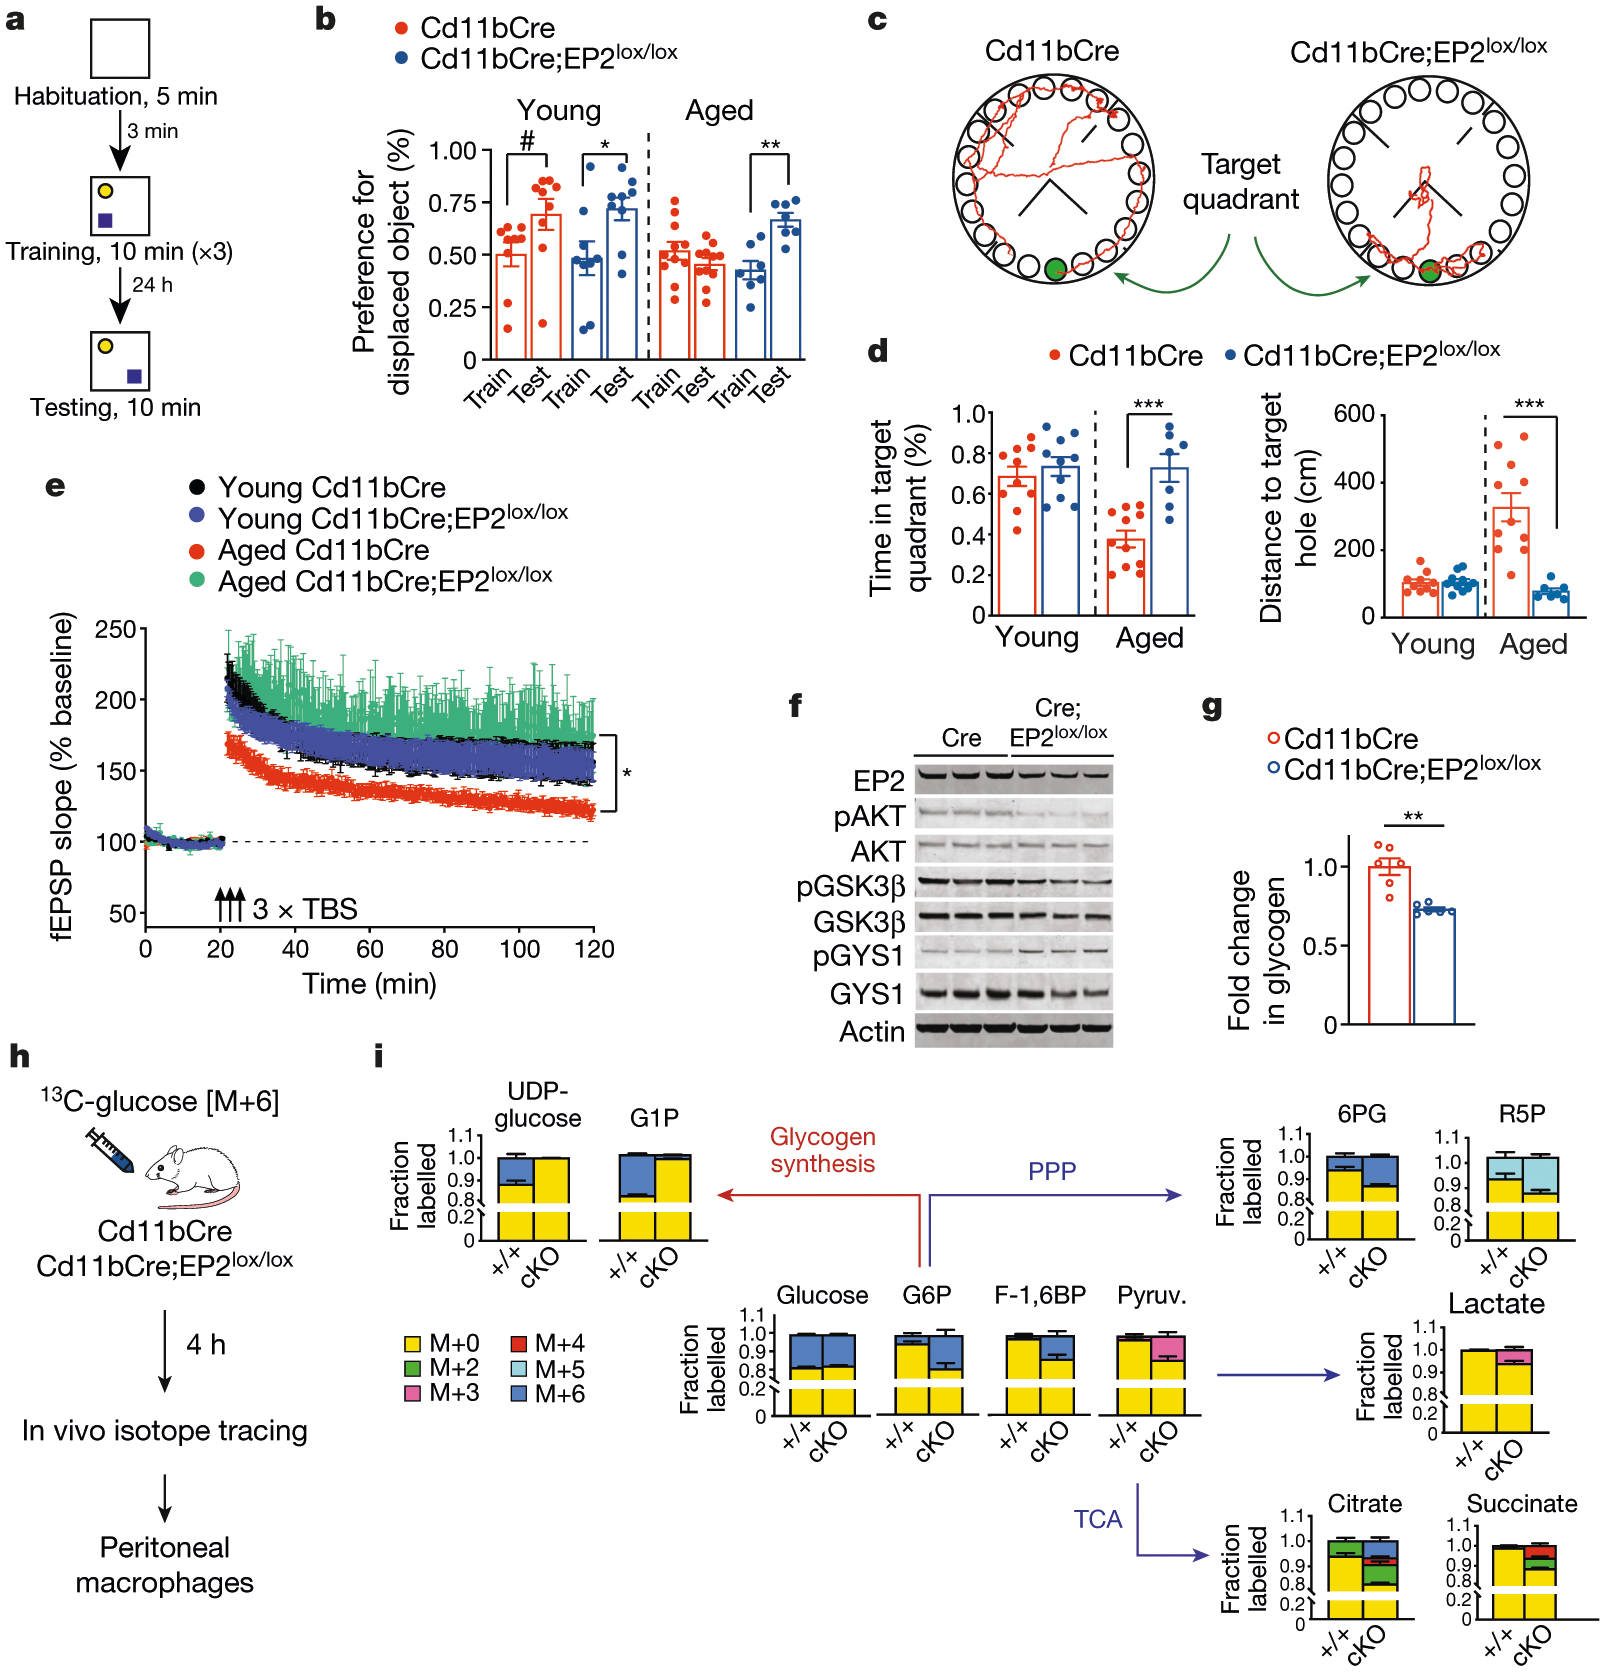
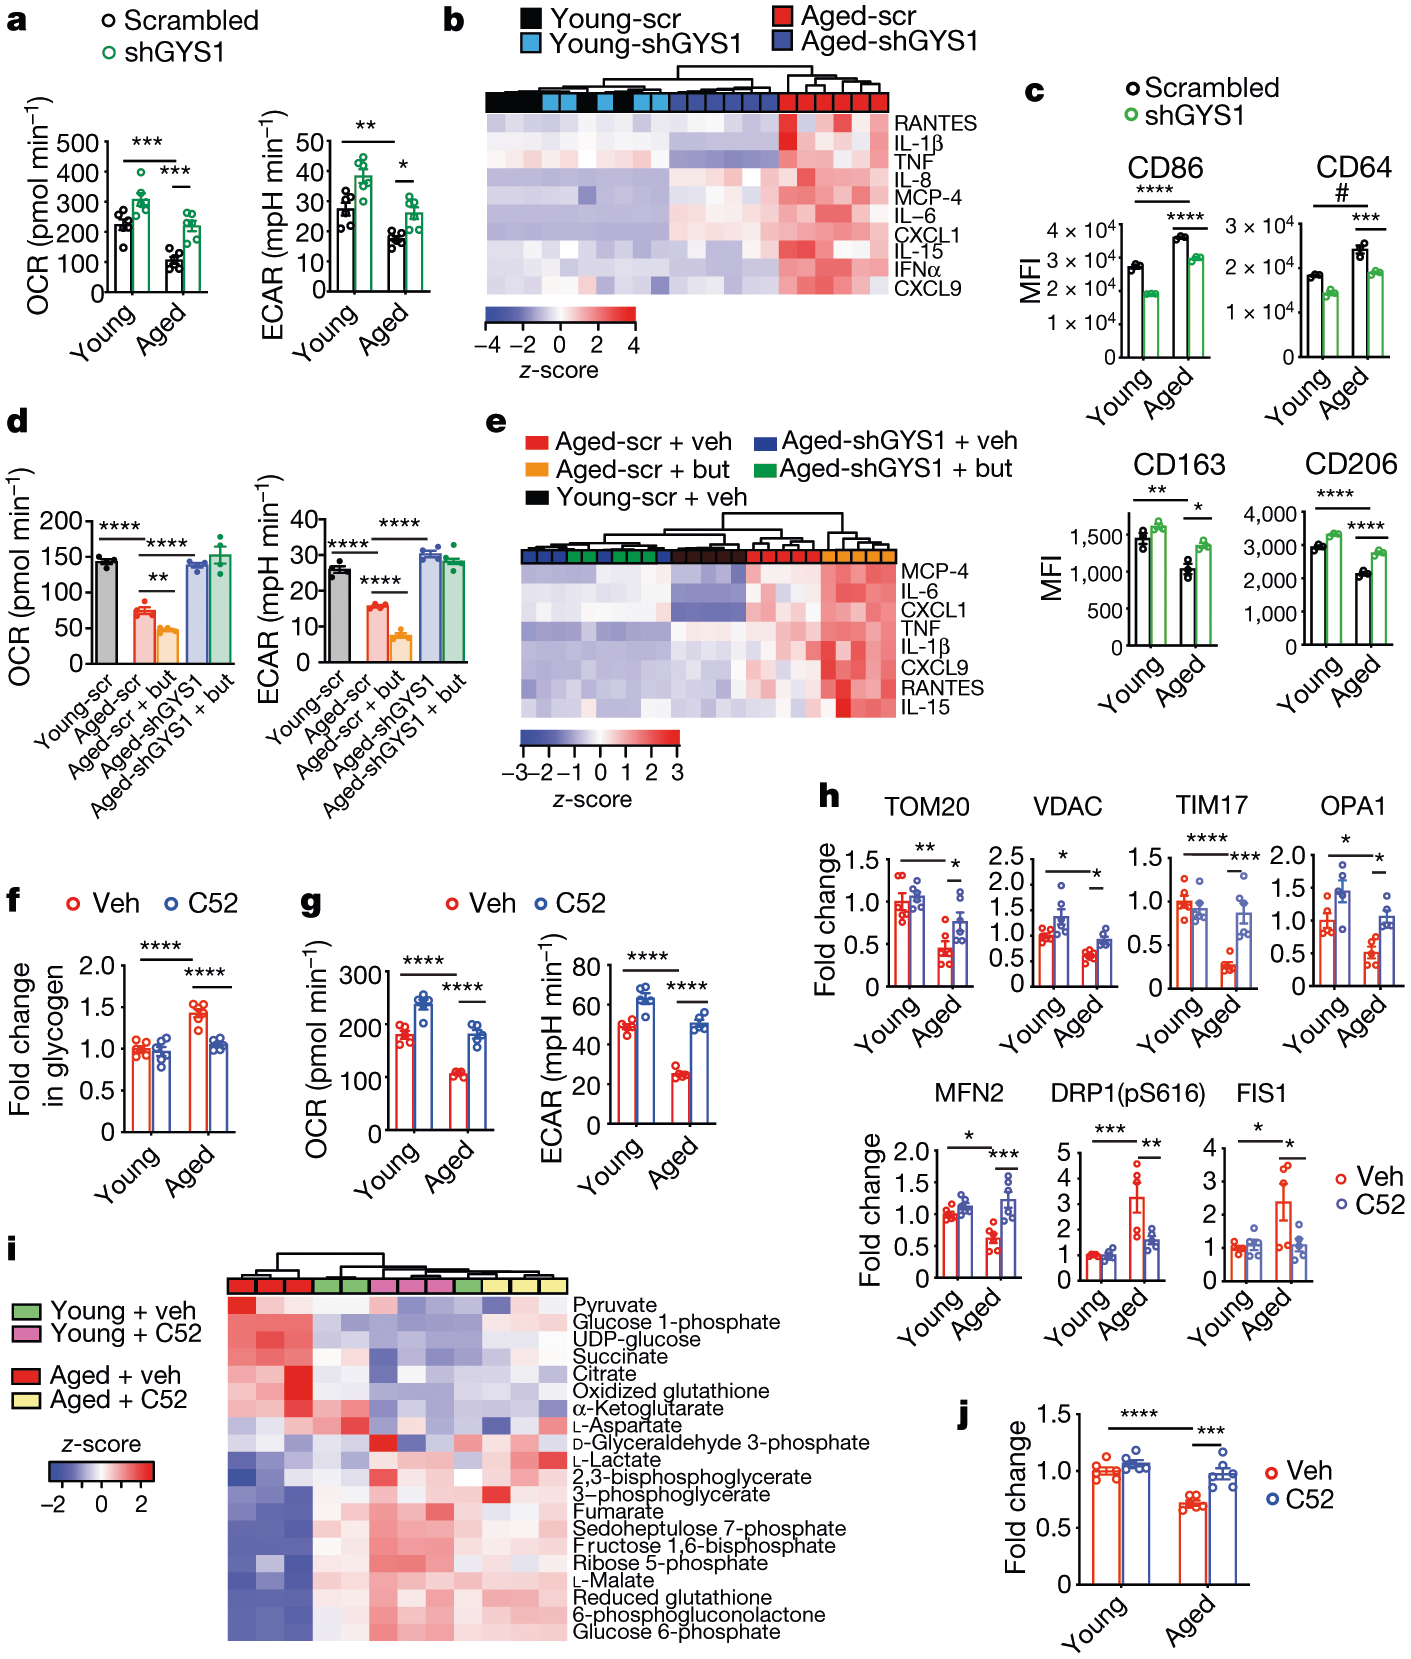
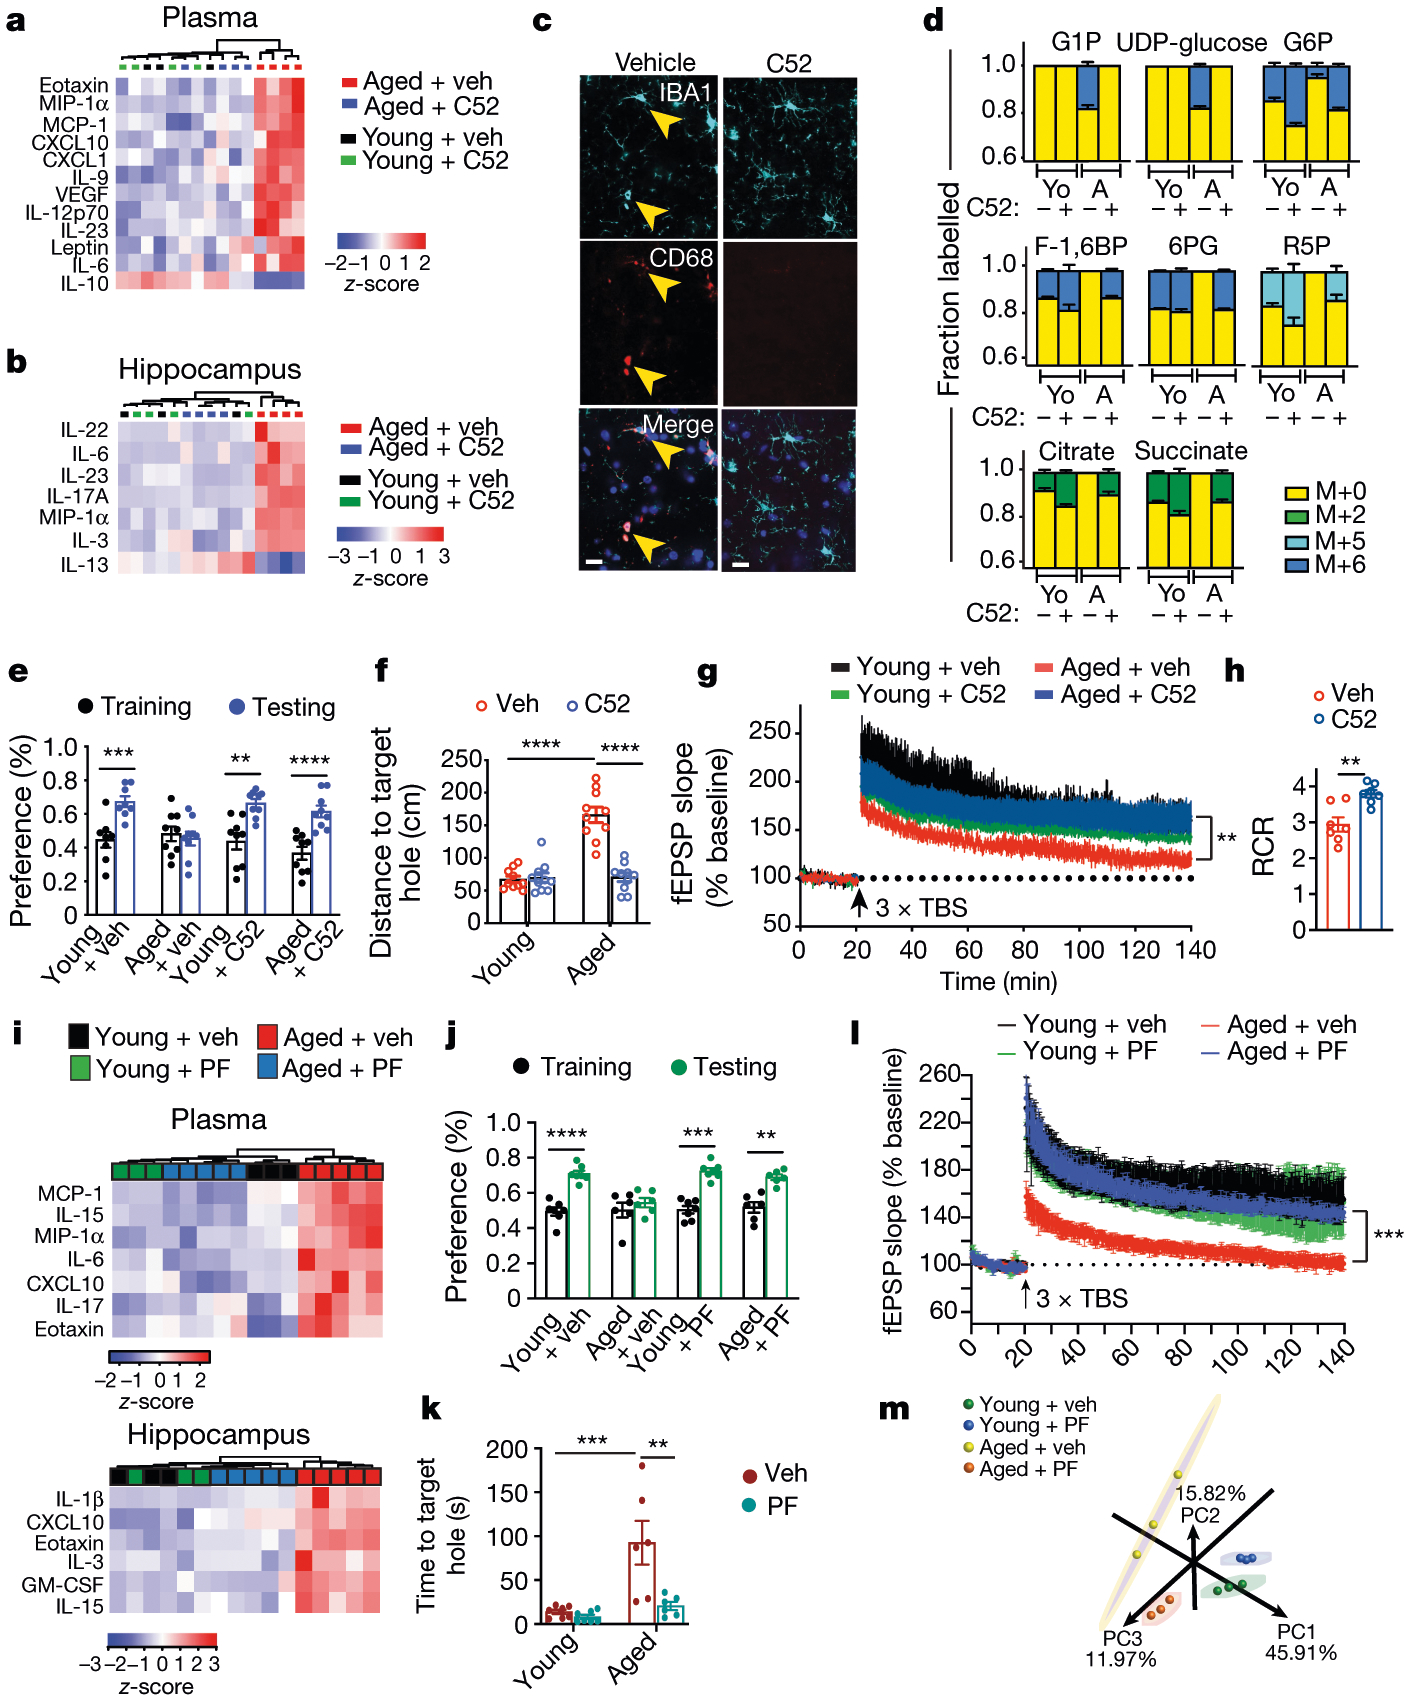
Ageing is characterized by the development of persistent pro-inflammatory responses that contribute to atherosclerosis, metabolic syndrome, cancer and frailty1-3. The ageing brain is also vulnerable to inflammation, as demonstrated by the high prevalence of age-associated cognitive decline and Alzheimer's disease4-6. Systemically, circulating pro-inflammatory factors can promote cognitive decline7,8, and in the brain, microglia lose the ability to clear misfolded proteins that are associated with neurodegeneration9,10. However, the underlying mechanisms that initiate and sustain maladaptive inflammation with ageing are not well defined. Here we show that in ageing mice myeloid cell bioenergetics are suppressed in response to increased signalling by the lipid messenger prostaglandin E2 (PGE2), a major modulator of inflammation11. In ageing macrophages and microglia, PGE2 signalling through its EP2 receptor promotes the sequestration of glucose into glycogen, reducing glucose flux and mitochondrial respiration. This energy-deficient state, which drives maladaptive pro-inflammatory responses, is further augmented by a dependence of aged myeloid cells on glucose as a principal fuel source. In aged mice, inhibition of myeloid EP2 signalling rejuvenates cellular bioenergetics, systemic and brain inflammatory states, hippocampal synaptic plasticity and spatial memory. Moreover, blockade of peripheral myeloid EP2 signalling is sufficient to restore cognition in aged mice. Our study suggests that cognitive ageing is not a static or irrevocable condition but can be reversed by reprogramming myeloid glucose metabolism to restore youthful immune functions.


Conflict of interest statement

Competing interests The authors declare no competing interests.

Figures

Extended Data Fig. 1 |
Extended Data Fig. 1 |. PGE2 regulates macrophage energy metabolism via the EP2 receptor.
Data are mean ± s.e.m. unless otherwise specified. a, The PGE2 synthetic pathway. Arachidonic acid is converted to the prostaglandin precursor PGH2 by the action of constitutive COX-1 and/or inducible COX-2; this step is inhibited by non-steroidal anti-inflammatory drugs (NSAIDs). PGE2 synthase converts PGH2 to PGE2 which can bind to four distinct G-protein-coupled receptors (EP1–EP4 receptors). b, Top, representative immunoblot of two independent experiments quantifying COX-2 and PGE2 synthase in young and aged human MDMs. Bottom, quantification shows higher COX-2 and mPGE2 synthase levels in aged (above 65 years) compared to young (below 35 years) human MDMs (n = 6 donors per group; **P = 0.0030, *P = 0.0106, Student’s two tailed t-test). c, Top, representative immunoblot of two independent experiments quantifying EP1–EP4 in young and aged human MDMs; last lane, HEK cells transfected with EP receptor cDNA as a positive control. Bottom, quantification shows increased EP2 in aged (over 65 years) compared to young (below 35 years) human MDMs (n = 6 donors per group; ****P < 0.0001, Student’s two tailed t-test). df, Quantification of basal respiration and ECAR of human MDMs treated with ascending doses of the EP1 agonist iloprost (d), the EP3 agonist AE248 (e) and the EP4 agonist AE1329 (f) for 20 h (n = 5 donors per group). g, h, Dose response of the brain-impermeant EP2 antagonist PF-04418948 (g) and the brain-penetrant EP2 antagonist C52 (h) in human MDMs at 20 h. Data are represented as box plots (5–95 percentile); one-way ANOVA for OCR and ECAR, P < 0.0001; Tukey’s post hoc test for PF-04418948: **P = 0.0083, ***P = 0.0005, #P < 0.0001; Tukey’s post hoc test for C52: #P < 0.0001 (n = 5 donors per group). i, LC–MS quantification of PGE2 levels in the plasma and cerebral cortex of aged (18–20 months) and young (3–4 months) mice. ****P < 0.0001 by two-tailed Student’s t-test (n = 6 mice per group) j, LC–MS quantification of PGD2, PGF2a and prostacyclin (measured as 6-keto-PGF1a) in the cerebral cortex of young and aged mice (n = 5–6 mice per group). k, Left, Representative immunoblot of EP1–EP4 levels in mouse peritoneal macrophages isolated from young (3–4 months) and aged (18–20 months) mice; last lane, HEK cells transfected with EP receptor cDNAs as a positive control (n = 6 mice per group). Right, EP2 is selectively upregulated in aged mouse peritoneal macrophages, similar to aged human MDMs in c; **P = 0.0018 (n = 6 mice per group).
Extended Data Fig. 2 |
Extended Data Fig. 2 |. Myeloid EP2 receptor knockdown prevents age-associated inflammation.
Data are mean ± s.e.m. unless otherwise specified. a, MFI quantification from three independent experiments for the anti-inflammatory markers CD71 and EGR2 and pro-inflammatory markers CD80 and CD86 in young (3–4 months) and aged (20–23 months) Cd11bCre and Cd11bCre;EP2lox/lox mice (n = 10,000–20,000 cells per point; n = 3 mice per group). Two-way ANOVA: effects of genotype and age P < 0.0001; Tukey’s post hoc test **P < 0.01, ***P < 0.001, ****P < 0.0001. b, c, Quantification of immune factors in plasma (b) and hippocampus (c) comparing aged Cd11bCre and aged Cd11bCre;EP2lox/lox mice; *P < 0.05, **P < 0.01 by two-tailed Student’s t-test (n = 6 mice per group). d, Representative immunoblot and quantification from two independent experiments comparing EP2 levels in 6-month-old Cd11bCre and wild-type mice (n = 6 per group). e, Primary latency in the Barnes maze for the five learning trials (n = 10 (young), n = 11 (aged Cd11bCre), n = 7 (aged Cd11bCre;EP2lox/lox). f, Representative immunoblot and quantification of hippocampal presynaptic proteins synapsin and SNAP-25 and postsynaptic proteins PSD95 and CamKIIα; #P = 0.0005, ***P = 0.0006, ****P < 0.0001 by two-tailed Student’s t-test (n = 6 mice per group; 20–23-month-old mice). g, Input/output curves as a measure of basal synaptic transmission in the CA1 region of the hippocampus (n = 8 slices, 3 mice per group). h, PGE2 activation of the EP2 receptor activates AKT signalling through phosphorylation of Ser473. Activated pAKT (Ser473) inactivates GSK3β through inhibitory phosphorylation of Ser9. Inactivation of GSK3β leads to constitutive activity of glycogen synthase 1 (GYS1) and glycogen synthesis. Conversely, deletion or antagonism of EP2 receptor signalling leads to downstream inhibitory phosphorylation of Ser641, Ser645 and Ser649 on GYS1 by activated, non-phosphorylated GSK3β. i, Quantification of EP2, pAKT (Ser 473)/total AKT, pGSK3β (Ser9)/total GSK3β and pGYS1 (Ser 641, 645, 649)/GYS1 levels in peritoneal macrophages from 6-month-old Cd11bCre and Cd11bCre;EP2lox/lox mice; ***P = 0.0002, ****P < 0.0001 by two-tailed Student’s t-test (n = 6 mice per group).
Extended Data Fig. 3 |
Extended Data Fig. 3 |. Macrophage EP2 signalling increases glycogen synthesis.
Data are mean ± s.e.m. unless otherwise specified. a, Representative immunoblots and quantification of the EP2–AKT–GSK3β–GYS1 signalling pathway in mouse peritoneal macrophages isolated from 6-month-old wild type C57B6/J mice treated with EP2 antagonist C52 (100 nM), EP2 agonist butaprost (100 nM) or PGE2 (100 nM) for 20 h. b, Quantification of a; P < 0.0001 by one-way ANOVA; Tukey’s post hoc test **P = 0.0072, ***P < 0.001, ****P < 0.0001 (n = 6 mice per group). c, Quantification of glycogen levels in human MDMs (age (mean ± s.e.m.) 43.9 ± 3.451 years) treated with EP2 agonist butaprost (100 nM) or EP2 antagonist C52 (100 nM) for 20 h. P < 0.001 by one-way ANOVA; Tukey’s post hoc test ****P < 0.0001 (n = 9 per group). d, LC–MS analysis of human MDMs (age (mean ± s.e.m.) 43.9 ± 3.451 years) treated with C52 (100 nM, 20 h) demonstrates upregulation of proximal glycolytic pathway (G6P, F6P, F-1,6-BP) and GSH and downregulation of UDPG and GSSG. Red circles represent metabolites with fold change >1.5, blue circles with fold change <1.5; q-value < 0.05 with false discovery rate (FDR) correction (n = 6 donors per group). e, Enrichment pathway analysis of d using MetaboAnalyst. f, Schematic depicting U-13C-glucose metabolism via glucose-1P (G1P) and UDP-glucose to glycogen synthesis (yellow shaded box) versus flux towards the pentose phosphate pathway (green shaded box), glycolysis or lactate, and the TCA cycle (blue shaded box) with associated mass-labelled molecules. Glucose is labelled at all 6 carbons (in green; M+6) and is converted via the glycolytic pathway to two molecules of pyruvate (or M+3). Pyruvate is transported into the mitochondria and undergoes oxidative decarboxylation to yield acetyl-CoA (M+2) which enters the TCA cycle. Successive additions of labelled acetyl-CoA through the TCA cycle yield M+2, M+4 and M+6. g, Isotope tracing of U-13C-glucose metabolism was performed in human MDMs (age (mean ± s.e.m.) 42.13 ± 3.674 years) treated with EP2 agonist butaprost (100 nM, 20 h) or EP2 inhibitor C52 (100 nM, 20 h; n = 6 donors per group). Activation of EP2 signalling with butaprost increases incorporation of heavy glucose in glycogen precursors G1P and UDP-glucose and reduces labelling of glycolytic intermediates (F-1,6-BP and pyruvate) as well as TCA cycle intermediates (citrate and succinate); inhibition of EP2 with C52 conversely reduces synthesis of glycogen precursors and increases glycolytic and TCA cycle intermediates. h, Schematic depicting changes in glucose metabolism in Fig. 2h, i. i, Representative flow cytometry histograms and corresponding MFI quantification of human MDMs with or without the EP2 inhibitor C52 (100 nM, 20 h) from three independent experiments. Surface levels of anti-inflammatory markers CD206 and CD163 increase with inhibition of EP2 signalling whereas levels of pro-inflammatory markers CD86 and CD64 decrease. **P < 0.01, ***P = 0.002 by two-tailed Student’s t-test (n = 30,000 – 40,000 cells per point; n = 3 donors per group). j, Quantification of phagocytosis of fluorescent E. coli particles in human MDMs treated with EP2 inhibitor C52 (100 nM, 20 h) from two independent experiments. ***P = 0.0002 by two-tailed Student’s t-test (n = 9 donors per group).
Extended Data Fig. 4 |
Extended Data Fig. 4 |. Knockdown of GYS1 promotes macrophage glucose metabolism and anti-inflammatory polarization.
Data are mean ± s.e.m. unless otherwise specified. af, Human MDMs are from donors (age (mean ± s.e.m.) 47.2 ± 1.582 years); gi, Human MDMs are from young (below 35 years) and aged (over 65 years) donors. a, Representative immunoblots and quantification of human MDMs transfected with two different shRNAs to human GYS1 at 8 h. P < 0.0001 by one-way ANOVA; Tukey’s post hoc test ****P < 0.0001 (n = 6 donors per group). b, Quantification of glycogen levels in human MDMs transfected with shRNAs to GYS1 at 8 h. P < 0.0001 by one-way ANOVA; Tukey’s post hoc test ****P < 0.0001 (n = 6 donors per group). c, Representative traces and quantification of OCR and ECAR for three independent experiments in human MDMs transfected with shRNAs for GYS1 at 8 h (n = 5 donors per group). P < 0.0001 by one-way ANOVA; Tukey’s post hoc test ****P < 0.0001 (n = 6 donors per group). Black arrows represent addition of oligomycin (1 μM), FCCP (2 μM), and rotenone/antimycin (500 nM), respectively, at time points indicated. d, Hierarchical clustering of targeted metabolomics for glycolysis, pentose phosphate shunt and TCA cycle metabolites in human MDMs transfected with shRNA to GYS1 at 8h (n = 5 donors per group). e, Isotope tracing of U-13C-glucose in human MDMs transfected with shRNA to GYS1 at 8 h reveals a decreased labelling in the glycogen precursor UDP-glucose and an increase in glycolytic intermediates F-1,6-BP and pyruvate (n = 6 donors per group). f, Representative flow cytometry histograms of three independent experiments for the pro-inflammatory markers CD86 and CD64 and anti-inflammatory markers CD206 and CD163 in human MDMs treated with or without shRNA to GYS1. Bottom, quantification of MFI, two-tailed Student’s t-test, *P < 0.05, **P < 0.01 (n = 20,000–40,000 cells per point, n = 3 donors per group). g, Representative trace of real-time changes in OCR from three independent experiments of young (below 35 years) and aged (over 65 years) human MDMs treated with or without shRNA to GYS1 (n = 5 young, n = 6 aged donors). h, Representative histograms of anti- and pro-inflammatory surface markers in young and aged human MDMs treated with or without shRNA to GYS1 (n = 3 donors per group). i, Representative traces of real-time changes in OCR from two independent experiments in young (below 35 years) and aged (over 65 years) human MDMs transfected with shRNA to GYS1 and treated 8 h later with butaprost (100 nm) for 20 h. OCR in GYS1-deficient aged human MDMs does not change with activation of the EP2 receptor by butaprost (n = 4 donors per group).
Extended Data Fig. 5 |
Extended Data Fig. 5 |. EP2 blockade restores AKT–GSK3β–GYS1 signalling, glycolysis and mitochondrial respiration to youthful levels.
Data are mean ± s.e.m. unless otherwise specified. a, Quantification of PGE2 levels in young (below 35 years) and aged (over 65 years) human MDMs treated with or without C52 (100 nM, 20 h). Effects of age and treatment P < 0.0001 by two-way ANOVA; Tukey’s post hoc test ****P < 0.0001 (n = 5 donors per group). b, c, Representative immunoblots (b) and quantification (c) of effects of C52 treatment (100 nM, 20 h) in human MDMs from young (below 35 years) and aged (over 65 years) donors. Two-way ANOVA, age and treatment, P < 0.0001; Tukey’s post hoc test **P = 0.002, ***P = 0.0005, ****P < 0.0001 (n = 6 donors per group). d, Real-time changes in OCR from three independent experiments of young and aged human MDMs treated with or without C52 (100 nM, 20 h; n = 5 donors per group). e, Representative immunoblots of effects of EP2 inhibition on mitochondrial protein levels in young and aged human MDMs (n = 6 donors per group; OMM, outer mitochondrial membrane; IMM, inner mitochondrial membrane). See Fig. 3h for quantification. f, Membrane potential (TMRE) in young and aged human MDMs treated with or without C52 (100 nM, 20 h). Two-way ANOVA: age P = 0.0009 and treatment P = 0.0333; Tukey’s post hoc test, ***P = 0.0006, **P = 0.0088 (n = 6 donors per group). g, ROS in young and aged human MDMs treated with or without C52 (100 nM, 20 h). Two-way ANOVA: age P = 0.0022 and treatment P = 0.0055; Tukey’s post hoc test **P = 0.0045, ##P = 0.0084 (n = 7 donors per group). h, Young and aged human MDMs were incubated with U-13C-glucose for 20 h with or without C52. Aged human MDMs showed increased labelling in glycogen precursors (G1P and UDP-glucose) and decreased labelling in TCA cycle intermediates. This was prevented with EP2 inhibition; n = 3 donors per group. i, Quantification of TCA cycle metabolites from Fig. 3i. Note normalization of citrate, α-ketoglutarate (α-KG), succinate, fumarate and malate in aged human MDMs with EP2 inhibition. Also note that itaconate, which is increased in models of acute macrophage stimulation with LPS, is not changed with ageing (n = 3 donors per group). Two-way ANOVA with Tukey’s multiple comparisons test; *P < 0.05, **P < 0.01, ***P < 0.001. j, k, Representative traces of real-time changes in OCR (j) and quantification of basal respiration and ECAR (k) from two independent experiments in peritoneal macrophages isolated from young (3–4 months) and aged (18–20 months) mice treated with COX-2 inhibitor SC236 (100 nM, 20 h). Two-way ANOVA: age and treatment, P < 0.0001 and P = 0.004, respectively; Tukey’s post hoc test, ****P < 0.0001 (n = 5 mice per group).
Extended Data Fig. 6 |
Extended Data Fig. 6 |. EP2 blockade does not alter LPS-mediated glucose metabolism reprogramming, and aged macrophages lose the capacity to use alternative fuel sources.
Data are mean ± s.e.m. unless otherwise specified. a, Human MDMs with or without LPS treatment (100 ng ml−1, 20 h; n = 4 (veh), n = 4 (veh + C52), n = 5 (LPS), n = 7 (veh + LPS) donors per group, age (mean ± s.e.m.) 42.3 ± 8.212 years) were stimulated with or without C52 (100 nM, 20 h). Blockade of EP2 does not rescue OCR and ECAR in LPS-treated human MDMs. b, 13C-glucose isotope tracing of human MDMs with or without LPS (100 ng ml−1, 20 h) and with or without C52 (100 nM, 20 h), demonstrates reprogramming of the TCA cycle towards increased production of itaconate with LPS stimulation that is not reversed with EP2 inhibition (n = 3 donors per group). c, Hierarchical clustering of glycolytic and TCA cycle metabolites in human MDMs with or without LPS (100 ng ml−1, 20 h) and with or without C52 (100 nM, 20 h) (n = 3 donors per group). d, Model highlighting differences in glucose metabolism and the TCA cycle in LPS-stimulated macrophages versus aged macrophages. LPS stimulation upregulates glycolysis and lactate production and increases itaconate production from aconitate by cis-aconitate decarboxylase, the protein product of Irg1, which is highly induced in settings of inflammation; increased itaconate suppresses SDH. In aged human MDMs, glucose is diverted from glycolysis to glycogen, reducing glucose flux into the TCA cycle; ageing is characterized by low SDH activity arising from deficient SIRT3 deacetylation of complex II subunits as a result of declining NAD+ levels. In both cases, lower succinate dehydrogenase activity leads to accumulation of the pro-inflammatory TCA cycle intermediate succinate, which enhances pro-inflammatory gene expression by stabilizing the transcription factor HIF-1α. e, Diagram illustrating fuel substrates for the TCA cycle and mitochondrial OXPHOS. Glucose and pyruvate/lactate can feed into the TCA cycle via acetyl-CoA; glutamine is metabolized via anaplerosis to α-KG, a TCA cycle intermediate. f, Young (below 35 years) and aged (over 65 years) human MDMs received U-13C-glucose [M+6] for 20 h. Isotope tracing reveals young macrophages can incorporate significantly higher 13C from glucose into the TCA cycle compared to aged macrophages (P = 0.0026 by Student’s two-tailed t-test with Welch’s correction for 13C citrate[M+2] proportion in young versus aged cells; n = 3 donors per group). g, Young (below 35 years) and aged (over 65 years) human MDMs received U-13C-pyruvate [M+3] for 20 h. Isotope tracing reveals young macrophages are able to incorporate significantly higher 13C from pyruvate into the TCA cycle compared to aged macrophages (P < 0.0001 by Student’s two-tailed t-test with Welch’s correction for 13C -citrate[M+2] in young versus aged cells; n = 3 donors per group). h, Young (below 35 years) and aged (over 65 years) human MDMs received U-13C-lactate [M+3] for 20 h. Isotope tracing reveals young macrophages are able to incorporate significantly higher 13C from lactate into the TCA cycle than aged macrophages (P = 0.0083 by Student’s two-tailed t-test with Welch’s correction for 13C citrate[M+2] in young versus aged cells; n = 3 donors per group). i, Young (below 35 years) and aged (over 65 years) human MDMs received U-13C-glutamine [M+5] for 20 h. Isotope tracing reveals young macrophages are able to incorporate significantly higher 13C from glutamine into the TCA cycle than aged macrophages (P < 0.0001 by Student’s two-tailed t-test with Welch’s correction for13C-α-KG [M+5] in young versus aged cells; n = 3 donors per group). j, Fuel flexibility was assayed by inhibiting fatty acid oxidation, glutamine metabolism, and pyruvate transport into the mitochondria. Representative trace of real-time changes in OCR from two independent experiments demonstrating increased dependence on glucose and reduced capacity by aged mouse macrophages (20–23 months) for oxidative phosphorylation (n = 5 donors per group). UK5099: mitochondrial pyruvate carrier inhibitor; BPTES: glutaminase inhibitor; etomoxir: inhibitor of carnitine palmitoyltransferase 1 (CPT1) which transports fatty acids into mitochondrial matrix. For dependency traces cells received UK5099 in first injection and BPTES/Etomoxir in second injection as indicated on figure. For capacity traces cells received BPTES/Etomoxir in first injection and UK5099 in second injection. k, Quantification of j; n = 5 donors per group; ****P < 0.0001 by two-tailed Student’s t-test.
Extended Data Fig. 7 |
Extended Data Fig. 7 |. EP2 is expressed in hippocampal CA1 microglia.
Data are mean ± s.e.m. unless otherwise specified. Scale bars, 40 μm. a, b, Images are from the CA1 region of the hippocampus. a, Colocalization of EP2 immunofluorescence with IBA1 in microglia (18-month-old mice). b, Microglial EP2 is not detected in RosaCreERT2;EP2lox/lox mice (15–16-month-old mice). c, d, Images are from the cerebral cortex. c, Colocalization of EP2 immunofluorescence with IBA1 in microglia (18-month-old mice). d, Microglial EP2 is not detected in RosaCreERT2;EP2lox/lox mice (15–16-month-old mice). e, f, Quantification of immune factors in the plasma (e) and hippocampus (f) from young (3–4 months) and aged (22–24 months) mice with or without C52 treatment (10 mg/kg/d for 1 month; n = 3 mice/young + veh group; n = 4 mice per group for all other groups). g, Quantification of percent CD68+/IBA1+ cells in CA3 hippocampus from young and aged mice with or without C52 treatment (10 mg/kg/day, 1 month); effect of age and treatment P < 0.0001 by two-way ANOVA; Tukey’s post hoc test ****P < 0.0001 (n = 8 slices, n =4 mice per group). h, Quantification of microglial numbers from young and aged mice with or without C52 treatment (10mg/kg/day, 1 mo; n = 8 slices, n =3 young and n =4 aged mice per group). i, Representative immunoblot of the pre- and postsynaptic proteins synapsin, PSD95, SNAP25 and CamKIIa in young and aged hippocampi in mice with or without C52 treatment (10 mg/kg/day, 1 month); n =3 young and n =4 aged mice per group. j, Quantification of i. Synapsin: effects of age (P = 0.0685) and treatment (P = 0.0072) by two-way ANOVA; Tukey’s post hoc test **P = 0.0069, ***P = 0.0010. PSD95: effects of age (P = 0.0019) and treatment (P = 0.0009) by two-way ANOVA; Tukey’s post hoc test **P = 0.0020, ***P = 0.0007. SNAP25: effects of age (P = 0.1930) and treatment (P = 0.0463) by two-way ANOVA; Tukey’s post hoc test *P = 0.0121. CamKIIα: effects of age (P = 0.9210) and treatment (P = 0.0025) by two-way ANOVA; Tukey’s post hoc test *P = 0.0132 (n = 3 young and 4 aged mice per group).
Extended Data Fig. 8 |
Extended Data Fig. 8 |. Effects of in vivo EP2 inhibition on macrophage metabolism, synaptic mitochondria and mitochondrial morphology in young and aged mice.
Data are mean ± s.e.m. unless otherwise specified. a, Peritoneal macrophage metabolite labelling following in vivo U-13C-Glucose isotope tracing (n = 6 mice per group). b, Quantification of per cent time in the target quadrant of the Barnes maze. Two-way ANOVA, effect of age or treatment ****P < 0.0001, Tukey’s post hoc test ****P < 0.0001 (n = 10 mice per group). c, Long-term potentiation (LTP) in the CA1 hippocampal region over a 120-min recording interval. Acute administration of C52 (100 nM, 1 h) before TBS does not alter LTP in aged mice (20–22 mo mice, n = 3 mice per group). d, Synaptic mitochondria were isolated from synaptosome fractions prepared from 16–month-old mice treated with or without C52 (10 mg/kg/d, 10 days). Coupling between the mitochondrial electron transport chain and oxidative phosphorylation (using succinate as the substrate) was determined using the Seahorse XFe24 analyser. Basal respiration (state II) and ADP-supplemented respiration (state III) reflect both electron transport and ATP generation and increased by twofold with EP2 blockade. Maximal respiration (state IIIu) after application of the H+ gradient uncoupler FCCP was also higher with EP2 inhibition, and state IVo, reflecting blockade of ATP synthase with oligomycin, was unchanged. *P < 0.05, two-tailed Student’s t-test (n = 7 mice per group). e, Coupling assay trace of synaptic mitochondria from aged mice treated with or without C52 for 10 days. Rates of basal complex II respiration as well as states III (ADP stimulated respiration), IV (oligomycin) and IIIu (FCCP) were consecutively measured (n = 7 mice per treatment group). f, TEM images at 5,000× magnification of microglia in the CA3 region of the hippocampus from young (3–4 months) and aged (22–24 months) mice treated with or without C52 (10 mg/kg/d, 1 month). Aged mice exhibit abnormal, non-electron-dense mitochondria; these features are rescued with C52 treatment. Arrows (black for vehicle, white for C52) point to mitochondria within microglia; blue shaded areas are non-microglial cells. Nu, nuclei; white scale bars, 1 μm. g, Higher-power representative TEM images of aged (22–24 months) mice treated with or without C52 (10 mg/kg/d, 1 month) showing differences in cristae and electron density. White scale bars, 500 nm. h, Quantification of per cent abnormal mitochondria in microglia of young (3–4 months) and aged (22–24 months) mice treated with or without C52 (10 mg/kg/d, 1 month); n = 66 mitochondria per group, 2-way ANOVA with Tukey’s post hoc test, ****P < 0.001.
Extended Data Fig. 9 |
Extended Data Fig. 9 |. Peripheral EP2 blockade restores youthful inflammatory profile and cognitive status.
Data are mean ± s.e.m. unless otherwise specified. a, Average speed (inches per second) and percentage of time spent in the inner zone in young (3–4 months) and aged (20–23 months) Cd11bCre;EP2lox/lox mice. There are no significant differences between age-matched Cd11bCre and Cd11bCre;EP2lox/lox mice (n = 10 mice (young); n = 7 mice (aged Cd11bCre;EP2lox/lox); n = 11 mice (aged Cd11bCre)). b, Average speed (inches/second) and percentage of time spent in the inner zone in young (3–4 months) and aged (22–24 months) mice treated with C52 compound (10 mg/kg/d, 1 month). There are no significant differences between age-matched vehicle and C52-treated mice (n = 8 mice for young + veh; n = 9 mice per group for all other groups). c, Average speed (inches per second) and percentage of time spent in the inner zone in young (3–4 months) and aged (20–22 months) mice treated with PF compound (2.5 mg/kg/d, 6 weeks.) There are no significant differences between age-matched vehicle or PF-treated mice (n = 7 mice for young groups; n = 6 mice for aged groups). d, Real-time changes in OCR and quantification of basal respiration and ECAR of three independent experiments on mouse hippocampal neurons treated with PGE2 (100 nM, 20 h), butaprost (100 nM, 20 h) and C52 (100 nM, 20 h) (n = 6 (butaprost), n = 7 (all others) biologically independent samples per group). Black arrows represent addition of oligomycin (1 μM), FCCP (2 μM), and rotenone/antimycin (500 nM), respectively, at time points indicated. e, Real-time changes in OCR and quantification of basal respiration and ECAR of three independent experiments on mouse astrocytes treated with PGE2 (100 nM, 20 h), butaprost (100 nM, 20 h) and C52 (100 nM, 20 h) (n = 7 biologically independent samples per group). Black arrows represent addition of oligomycin (1 μM), FCCP (2 μM), and rotenone/antimycin (500 nM), respectively, at time points indicated. f, LC–MS analysis of plasma and brain levels of PF-04418948 (2.5 mg/kg/d, 6 weeks). PF-04418948 was not detected in whole-brain lysates of treated mice (n = 5–6 mice per group, 20–22 mo). gk, Young (3–4 months) and aged (20–22 months) mice were treated with vehicle or PF-04418948 at 2.5 mg/kg/d for 6 weeks. g, Quantification of significantly regulated immune factors in hippocampi (n = 3 young mice; n = 5 aged mice per group). h, Quantification of significantly regulated immune factors in plasma (n = 3 young mice; n = 5 aged mice per group). i, Primary latency in the Barnes maze for the five learning trials (n = 7 young mice; n = 6 aged mice per group). j, Representative traces of paths taken to the target hole (green) on the day of testing in the Barnes maze comparing aged mice with or without PF-04418948. k, Input/output curves as a measure of basal synaptic transmission in the CA1 region of the hippocampus (n = 8 slices, 3 mice per group). l, Microglia were isolated from brains of young (2–3 months) and aged (20–22 months) mice and assayed for EP2 receptor, pAKT and total AKT levels. Left, representative western blot; right, quantification. Two-tailed Student’s t-test, ***P < 0.001, **** P < 0.0001 (n = 6 mice per group). m, Microglia were isolated from brains of aged (20–24 months) mice treated with vehicle, PF-04418948 (10 mg/kg/day for 10 days) or C52 (10 mg/kg/day for 10 days). Left, representative western blot; right, quantification with two-tailed Student’s t-test, **** P < 0.0001 (n = 6 mice per group).
Extended Data Fig. 10 |
Extended Data Fig. 10 |. Transcriptomics of primary peritoneal macrophages from young and aged mice treated with vehicle or with the non-brain-penetrant EP2 inhibitor PF-04418948.
Data are mean ± s.e.m. unless otherwise specified. a, Heat map of 1448 genes from Nanostring assay reveals that aged mice treated with PF-04418948 cluster with young mice treated with vehicle or PF-04418948. b, Volcano plot of peritoneal macrophages collected from aged versus young vehicle-treated mice. Red dots indicate genes that are absolute-value[log2(FC)] ≥ 2 and FDR < 0.05 by t-test with Benjamini–Hochberg correction. c, Volcano plot of peritoneal macrophages collected from aged + PF-04418948-treated versus aged + vehicle-treated mice. Red dots indicate genes that are absolute-value[log2(FC)] ≥ 1.5 and FDR < 0.05 by t-test with Benjamini–Hochberg correction. d, Top 10 signalling pathways from the Reactome pathway database for FDR < 0.05 genes comparing aged +veh versus young + v eh mice (top) and aged + PF-04418948 versus aged + veh mice (bottom). e, Hierarchical clustering of top differentially regulated chemokine and cytokines transcripts (FDR < 0.05) demonstrates that PF-04418948 treatment shifts expression towards young macrophage levels. f, Nanostring analysis of significantly regulated genes (FDR < 0.05) demonstrates differential expression of bioenergetic transcripts in peritoneal macrophages isolated from young (3–4 months) and aged (20–22 months) mice with or without PF-04418948 (2.5 mg/kg/d for 6 weeks). Aged peritoneal macrophages exhibit suppressed expression of genes that encode critical glycolytic enzymes, including the rate-limiting enzyme phosphofructokinase-1 (PFK-1) as well as the rate-setting TCA cycle enzyme, citrate synthase. Peripheral myeloid EP2 inhibition with PF-04418948 corrects the age-associated suppression of myeloid glycolytic and TCA cycle gene expression.
Fig. 1 |
Fig. 1 |. PGE2 EP2 receptor regulates myeloid metabolism and inflammation in ageing.
Data are mean ± s.e.m. unless otherwise specified. a, Levels of PGE2 from young and aged human MDMs cultured for 20 h; ****P < 0.0001 by two-tailed Student’s t-test. b, Real-time changes in the OCR of human MDMs in response to treatment with the indicated concentrations of PGE2 for 20 h. Cells were treated with 1 μM oligomycin (olig), 2 μM carbonyl cyanide-p-trifluoromethoxyphenylhydrazone (FCCP) and 0.5 μM rotenone and antimycin (rot/an), as indicated by the three black arrows. Veh, vehicle. c, Basal respiration (OCR) (blue) and ECAR (red) in human MDMs stimulated with the indicated concentrations of PGE2 for 20 h. Box plots (upper box limit, 5th percentile; lower box limit, 95th percentile; centre line, median; upper whisker, maximum value; lower whisker, minimum value); one-way analysis of variance (ANOVA), P < 0.0001; Tukey’s post hoc test, **P = 0.0085, P = 0.0001, #P < 0.0001. d, Basal respiration and ECAR in human MDMs stimulated with the indicated concentrations of the EP2 agonist butaprost for 20 h. Box plots (5th–95th percentile); one-way ANOVA, P < 0.0001; Tukey’s post hoc test #P < 0.0001. In ad, n = 5 donors per group; age (mean ± s.e.m.) 47.8 ± 2.105 years. e, Basal respiration and ECAR in peritoneal macrophages from young (3–4 months old) and aged (20–23 months old) Cd11bCre and Cd11bCre;EP2lox/lox mice. Two-way ANOVA, age and genotype P < 0.0001; Tukey’s post hoc test, ****P < 0.0001 (n = 5 mice per group). f, TEM of peritoneal macrophage mitochondria from young and aged Cd11bCre (red arrows) and Cd11bCre;EP2lox/lox (blue arrows) mice; two independent experiments (n = 6 mice per group). Scale bars, 100 nm. g, Quantification of TEM mitochondrial metrics from f. Box plots (5th–95th percentile); two-way ANOVA, age and genotype P < 0.0001; Tukey’s post hoc test, ****P < 0.0001 (n = 106 cells per group). h, Flow cytometry histograms of peritoneal macrophages for the anti-inflammatory markers CD71 and EGR2 and the pro-inflammatory markers CD80 and CD86 from young and aged Cd11bCre and Cd11bCre;EP2lox/lox mice; three independent experiments (n = 10,000–20,000 cells per sample; n = 3 mice per group). i, Phagocytosis of fluorescent Escherichia coli particles in peritoneal macrophages from young and aged Cd11bCre and Cd11bCre;EP2lox/lox mice. Two-way ANOVA, age P = 0.0147 and genotype P = 0.0008; Tukey’s post hoc test, *P = 0.0127, **P = 0.0017 (n = 6 mice per group). j, Hierarchical clustering of significantly regulated immune factors in the plasma and hippocampus from young and aged Cd11bCre and Cd11bCre;EP2lox/lox mice (n = 10 young, n = 6 aged mice per group).
Fig. 2 |
Fig. 2 |. Myeloid knockdown of the EP2 receptor prevents cognitive ageing.
Experiments were performed in young (3–4-month-old) and aged (20–23-month-old) Cd11bCre and Cd11bCre;EP2lox/lox mice. Data are mean ± s.e.m. unless otherwise specified. a, Schematic depicting the object location memory task. b, Fraction of time spent exploring the displaced object is expressed as the per cent preference for the displaced object. Paired t-test, #P = 0.0280, *P = 0.0188, **P = 0.0034 (n = 9 young, n = 11 aged Cd11bCre, n = 7 aged Cd11bCre;EP2lox/lox mice). c, Representative traces of paths to target hole (green) by aged mice on the day of testing in the Barnes maze. d, Quantification of percentage of time in the target quadrant and distance travelled to the target hole in the Barnes maze. Two-tailed unpaired Student’s t-test, ***P = 0.0003, (n = 10 young, n = 11 aged Cd11bCre, n = 7 aged Cd11bCre;EP2lox/lox mice). e, Long-term potentiation, measured as the change in field excitatory postsynaptic potential (fEPSP), in the CA1 hippocampal region over 120 min. Three episodes of theta-burst stimulation (3 × TBS; black arrows) were applied. Two-way ANOVA, effects of time and genotype P < 0.0001; Sidak’s multiple comparisons test with Geisser–Greenhouse correction, *P = 0.0272 (n = 8 slices, n = 3 mice per group). f, Representative immunoblots of 2 independent experiments showing EP2 signalling via the AKT–GSK3β–GYS1 pathway in peritoneal macrophages from 6-month-old Cd11bCre and Cd11bCre;EP2lox/lox mice (n = 6 mice per group). g, Glycogen levels in peritoneal macrophages from aged Cd11bCre and Cd11bCre;EP2lox/lox mice. Two-tailed Student’s t-test, **P = 0.0031 (n = 6 mice per group). h, Mice were administered 13C-glucose (1 g per kg by oral gavage) and peritoneal macrophages were isolated 4 h later for isotope tracing. i, Quantification of 13C-glucose metabolism in mouse peritoneal macrophages demonstrates a shift away from glycogen synthesis and towards glycolysis, the pentose phosphate pathway (PPP) and the TCA cycle in aged Cd11bCre;EP2lox/lox (cKO) mice relative to Cd11bCre (+/+) mice (n = 6 mice per group). G1P, glucose 1-phosphate; G6P, glucose 6-phosphate; F-1,6BP, fructose 1,6-bisphosphate; pyruv., pyruvate; 6PG, 6-phosphogluconate; R5P, ribulose 5-phosphate.
Fig. 3 |
Fig. 3 |. EP2-directed glycogen synthesis regulates macrophage bioenergetics and immune responses.
Human MDMs were derived from young (below 35 years of age) and aged (over 65 years of age) donors. Data are mean ± s.e.m. unless otherwise specified. a, Basal respiration and ECAR in human MDMs transfected with short hairpin RNA (shRNA) against GYS1 (shGYS1) or with control scrambled shRNA; three independent experiments. Two-way ANOVA, age and genotype P < 0.0001; Tukey’s post hoc test *P = 0.0225, **P = 0.0075, ***P < 0.001 (n = 6 donors per group). b, Hierarchical clustering of significantly regulated immune factors in human MDMs 20h after transfection of shGYS1 or scrambled shRNA (scr) (n = 5 young, n = 6 aged donors). c, Mean fluorescence intensity (MFI) of three independent flow cytometry experiments in young and aged human MDMs transfected with shGYS1 or with control scrambled shRNA. Two-way ANOVA, age and shRNA P < 0.0001; Tukey’s post hoc test, *P = 0.0178, **P = 0.0041, #P = 0.0003, ***P = 0.0006, ****P < 0.0001 (n = 20,000–40,000 cells per point; n = 3 donors per group). d, Basal respiration and ECAR of young and aged human MDMs transfected with shGYS1 or control scrambled shRNA and stimulated 8 h later with vehicle or butaprost (but; 100 nM, 20 h). Two-tailed Student’s t-test, **P = 0.0018, ****P < 0.0001 (n = 4 donors per group). e, Hierarchical clustering of significantly regulated immune factors in human MDMs from d (n = 5 donors per age group). f, Glycogen levels in young and aged human MDMs treated with vehicle or C52 (100 nM, 20 h). Two-way ANOVA, age and treatment P < 0.0001; Tukey’s post hoc test, ****P < 0.0001 (n = 6 donors per group). g, Basal respiration and ECAR in young and aged human MDMs treated with vehicle or C52 (100 nM, 20 h). Two-way ANOVA, age and treatment P < 0.0001; Tukey’s post hoc test, ****P < 0.0001 (n = 5 donors per group). h, Levels of mitochondrial proteins quantified by immunoblot in young and aged human MDMs treated with vehicle or C52 (100 nM, 20 h). Two-way ANOVA with Tukey’s post hoc test, *P < 0.05, **P < 0.01, ***P < 0.001, ****P < 0.0001 (n = 6 donors per group). i, Liquid chromatography coupled to mass spectrometry (LC–MS) measurements of glycolytic and TCA cycle metabolites in young and aged human MDMs treated with vehicle or C52 (100 nM, 20 h; n = 3 donors per group). j, Phagocytosis of fluorescent E. coli particles in young and aged human MDMs treated with vehicle or C52 (100 nM, 20 h). Two-way ANOVA with Tukey’s post hoc test, ***P = 0.0006, ****P < 0.0001 (n = 6 donors per group).
Fig. 4 |
Fig. 4 |. EP2 blockade reverses age-associated inflammation and spatial memory loss.
Data are mean ± s.e.m. ag, Young (3–4-month-old) and aged (22–24-month-old) mice were administered vehicle or brain-penetrant C52 (10 mg per kg per day) for 1 month (ac), 10 days (d) and 2 weeks (eg). a, b, Hierarchical clustering of significantly regulated immune factors in the plasma (a) and hippocampus (b) (n = 3 young + veh, n = 4 mice per group for all other groups). c, Immunofluorescent staining of the hippocampal CA1 region for IBA1+ microglia. Scale bars, 10 μm. d, Mass labelling of brain microglia from mice treated with vehicle or C52 and administered U-13C-glucose 4 h before collection. Aged microglia increase incorporation of 13C-glucose into glycogen precursors and reduce incorporation into TCA cycle intermediates; this is reversed with EP2 blockade (n = 3 mice per group). Yo, young; A, aged. e, Per cent preference in the novel displacement object task. Paired two-tailed Student’s t-test, **P = 0.0014, ***P = 0.0003, ****P < 0.0001 (n = 8 young + veh, n = 9 mice per group for all other groups). f, Distance travelled to the target hole in the Barnes maze. Two-way ANOVA, age and treatment P < 0.0001; Tukey’s post hoc test, ****P < 0.0001 (n = 10 mice per group). g, Long-term potentiation in the CA1 hippocampal region. Two-way ANOVA, age and treatment P < 0.0001; Sidak’s multiple comparisons with Geisser–Greenhouse correction, **P = 0.0096 (n = 10–12 slices, n =5 mice per group). h, Synaptic mitochondria of 16-month-old mice treated with vehicle or C52 (10 mg per kg per day, 10 days), assayed for respiration control ratio (RCR).Two-tailed Student’s t-test, **P = 0.0025 (n = 7 mice per group). il, Young (3–4-month-old) and aged (22–24-month-old) mice were administered vehicle or brain-impermeant PF-04418948 (PF; 2.5 mg per kg per day, 6 weeks). i, Hierarchical clustering of significantly regulated immune factors in plasma and hippocampus (n = 3 young, n = 5 aged mice per group). j, Per cent preference in novel object location task. Paired two-tailed Student’s t-test, **P = 0.0074, ***P = 0.0004, ****P < 0.0001 (n = 7 young, n = 6 aged mice). k, Time to target hole in the Barnes maze. Two-way ANOVA, age (P = 0.0008) and treatment (P = 0.0034); Tukey’s post hoc test, ***P = 0.0005, **P = 0.0022 (n = 7 young, n = 6 aged mice). l, Hippocampal CA1 long-term potentiation; two-way ANOVA, age and treatment P < 0.0001; Sidak’s multiple comparisons with Geisser–Greenhouse correction, ***P = 0.002 (n = 6 slices, n = 5 mice per group). m, Principal component (PC) analysis of peritoneal macrophage transcriptomics. Ellipses represent 95% confidence intervals.

Comment in

References

    1. Franceschi C et al. Inflammaging and anti-inflammaging: a systemic perspective on aging and longevity emerged from studies in humans. Mech. Ageing Dev 128, 92–105 (2007). - PubMed
    1. Nikolich-Žugich J The twilight of immunity: emerging concepts in aging of the immune system. Nat. Immunol 19, 10–19 (2018). - PubMed
    1. Ferrucci L & Fabbri E Inflammageing: chronic inflammation in ageing, cardiovascular disease, and frailty. Nat. Rev. Cardiol 15, 505–522 (2018). - PMC - PubMed
    1. Lindenberger U Human cognitive aging: corriger la fortune? Science 346, 572–578 (2014). - PubMed
    1. Brayne C The elephant in the room—healthy brains in later life, epidemiology and public health. Nat. Rev. Neurosci 8, 233–239 (2007). - PubMed

Publication types

MeSH terms