. 2021 Jul;48(8):2455-2465.
doi: 10.1007/s00259-020-05180-4. Epub 2021 Jan 21.

Imaging coronary plaques using 3D motion-compensated [18F]NaF PET/MR

Affiliations

Imaging coronary plaques using 3D motion-compensated [18F]NaF PET/MR

Johannes Mayer et al. Eur J Nucl Med Mol Imaging. 2021 Jul.

Abstract

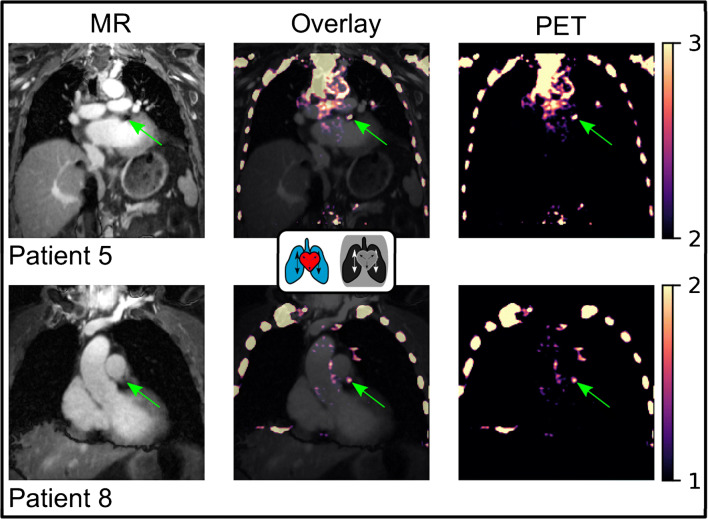
Background: Cardiac PET has recently found novel applications in coronary atherosclerosis imaging using [18F]NaF as a radiotracer, highlighting vulnerable plaques. However, the resulting uptakes are relatively small, and cardiac motion and respiration-induced movement of the heart can impair the reconstructed images due to motion blurring and attenuation correction mismatches. This study aimed to apply an MR-based motion compensation framework to [18F]NaF data yielding high-resolution motion-compensated PET and MR images.

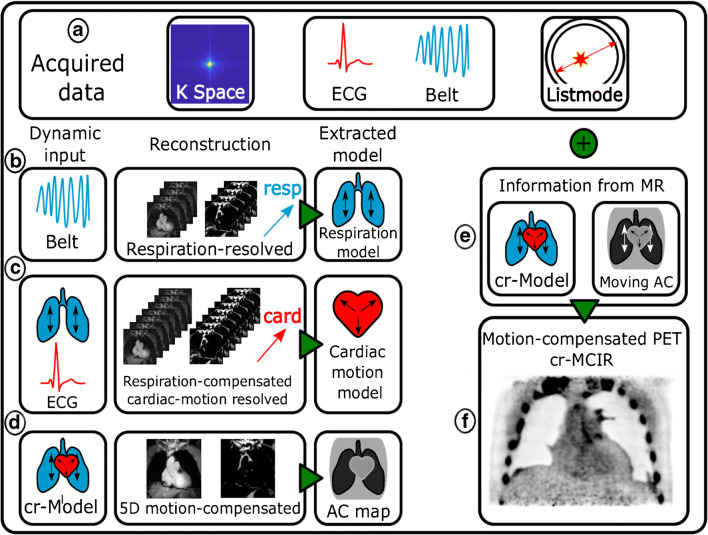
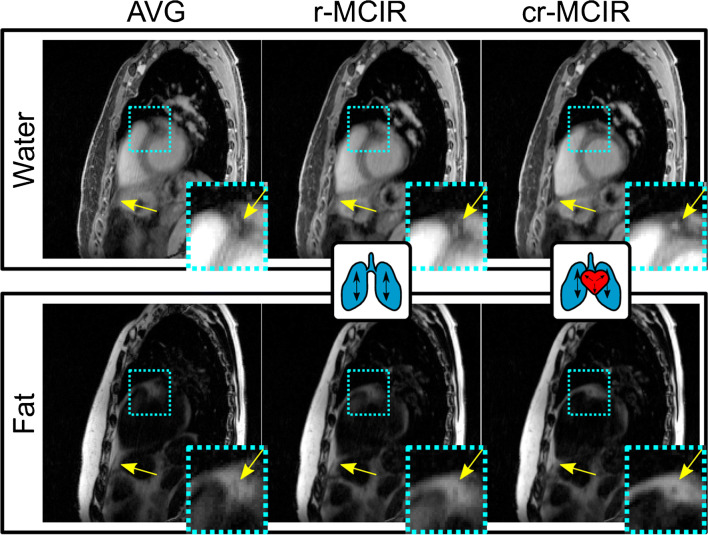
Methods: Free-breathing 3-dimensional Dixon MR data were acquired, retrospectively binned into multiple respiratory and cardiac motion states, and split into fat and water fraction using a model-based reconstruction framework. From the dynamic MR reconstructions, both a non-rigid cardiorespiratory motion model and a motion-resolved attenuation map were generated and applied to the PET data to improve image quality. The approach was tested in 10 patients and focal tracer hotspots were evaluated concerning their target-to-background ratio, contrast-to-background ratio, and their diameter.

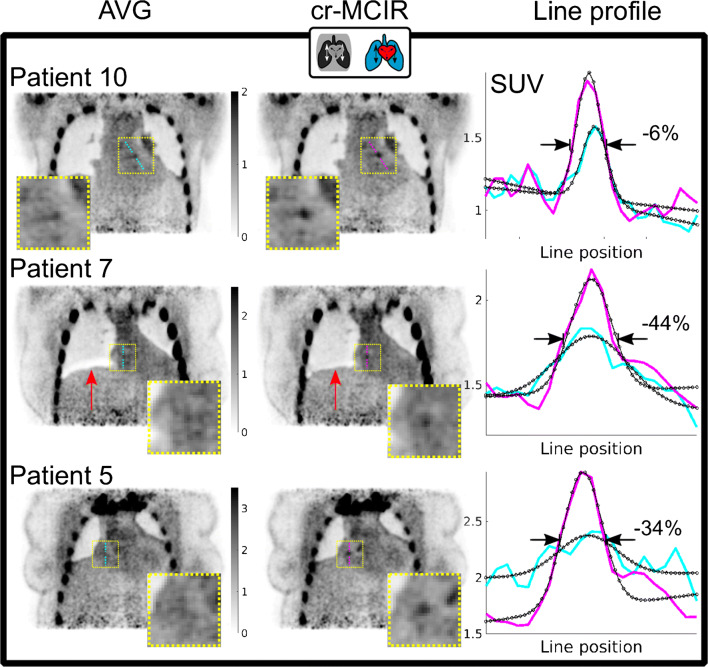
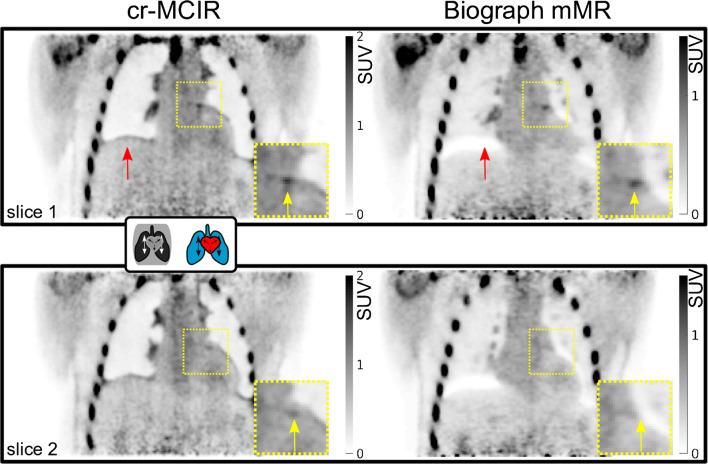
Results: MR-based motion models were successfully applied to compensate for physiological motion in both PET and MR. Target-to-background ratios of identified plaques improved by 7 ± 7%, contrast-to-background ratios by 26 ± 38%, and the plaque diameter decreased by -22 ± 18%. MR-based dynamic attenuation correction strongly reduced attenuation correction artefacts and was not affected by stent-related signal voids in the underlying MR reconstructions.

Conclusions: The MR-based motion correction framework presented here can improve the target-to-background, contrast-to-background, and width of focal tracer hotspots in the coronary system. The dynamic attenuation correction could effectively mitigate the risk of attenuation correction artefacts in the coronaries at the lung-soft tissue boundary. In combination, this could enable a more reproducible and reliable plaque localisation.

Keywords: Atherosclerosis,; Cardiac and respiratory motion; Motion compensation,; Simultaneous PET/MR,; [18F]NaF cardiac imaging,.


Conflict of interest statement

The authors declare that they have no competing interests.

Figures

Fig. 1
Fig. 1
Overview of the reconstruction workflow. The acquired PET/MR data consist of listmode and k-space data, as well as the respiratory belt and ECG as surrogate signals for physiological motion. Three MR reconstructions (bd) are performed from which motion information and an attenuation map are extracted. This information is incorporated into the PET reconstruction (e) compensating both emission data and attenuation map for motion yielding a cardiorespiratory motion-compensated (cr-MCIR) PET reconstruction (f). The cr-MCIR MR (d) and PET (f) reconstructions are hence in the same motion state and the MR anatomical image can be used to identify the anatomical location of the uptake
Fig. 2
Fig. 2
MR images in sagittal view of one exemplary dataset with reconstructed water (top) and fat (bottom) content. The motion-averaged reconstruction (AVG, left) is compared to respiratory (r-MCIR, centre) and cardiorespiratory (cr-MCIR, right) reconstruction. Cyan boxes indicate enlarged areas depicted in the lower right corner reconstruction. Image quality increases with the inclusion of more motion information from AVG over r-MCIR to cr-MCIR for both the water and fat images especially in the coronary arteries and apex (yellow arrows)
Fig. 3
Fig. 3
Comparison between PET AVG (left column) and cr-MCIR (centre column) for patients 10, 7 and 5. Cyan and magenta lines indicate the position where line profiles (right column) were extracted. The fit is overlayed in black. Compared to AVG, cr-MCIR leads to an increase in the maximum uptake value and a decrease of plaque width D. The decrease ranged between −6 and −44% for the displayed cases. Patient 7 shows an artefact due to misalignment between AC map and PET emission data for AVG which is corrected by using cr-MCIR (red arrow)
Fig. 4
Fig. 4
Result of the PET cr-MCIR application to patient 1. An enlarged ROI is marked by the dashed yellow square. Top, coronal slice 1; bottom, coronal slice 2. Left, cr-MCIR. Right, Biograph mMR vendor reconstruction. Uptake in the left coronary artery is highlighted by yellow arrows, and red arrows indicate artefacts due to an AC mismatch. The cr-MCIR shows reduced AC mismatch compared to the Biograph mMR images. For the vendor reconstruction, the strong AC data mismatch due to physiological motion means the uptake in the coronary plaque is not visible anymore in the second slice (bottom row). Scanner and STIR reconstructions required a different window setting for comparable contrast in the coronary uptake
Fig. 5
Fig. 5
PET/MR overlay for patients 5 and 8 with uptake in stents (green arrows). All images are cr-MCIR. PET images were reformatted to the MR coordinates. Left column, MR water images. Central column, overlay of both modalities. Right column, PET images only. The colorbar corresponds to the PET window in both images. In this case, the anatomic position of the uptake is obscured by the signal void generated by the stent. However, the automated inpainting of the stent voids during AC map generation mitigates potential AC artefacts with respect to tracer uptake within stents

References

    1. Joshi NV, Vesey AT, Williams MC, et al. 18F-fluoride positron emission tomography for identification of ruptured and high-risk coronary atherosclerotic plaques: A prospective clinical trial. Lancet. 2014;383(9918):705–713. doi: 10.1016/S0140-6736(13)61754-7. - DOI - PubMed
    1. Tarkin JM, Dweck MR, Evans NR, et al. Imaging atherosclerosis. Circ Res. 2016;118(4):750–769. doi: 10.1161/CIRCRESAHA.115.306247. - DOI - PMC - PubMed
    1. Dweck MR, Chow MWL, Joshi NV, et al. Coronary arterial 18F-sodium fluoride uptake. J Am Coll Cardiol. 2012;59(17):1539–1548. doi: 10.1016/j.jacc.2011.12.037. - DOI - PubMed
    1. Kitagawa T, Yamamoto H, Toshimitsu S, et al. 18F-sodium fluoride positron emission tomography for molecular imaging of coronary atherosclerosis based on computed tomography analysis. Atherosclerosis. 2017;263:385–392. doi: 10.1016/j.atherosclerosis.2017.04.024. - DOI - PubMed
    1. McKenney-Drake ML, Territo PR, Salavati A, et al. 18 F-NaF PET imaging of early coronary artery calcification. JACC Cardiovasc Imaging. 2016;9(5):627–628. doi: 10.1016/j.jcmg.2015.02.026. - DOI - PubMed

Publication types

LinkOut - more resources