Comparative Study
. 2021 May;20(3):462-484.
doi: 10.1002/pst.2088. Epub 2021 Jan 20.

A novel equivalence probability weighted power prior for using historical control data in an adaptive clinical trial design: A comparison to standard methods

Affiliations
Comparative Study

A novel equivalence probability weighted power prior for using historical control data in an adaptive clinical trial design: A comparison to standard methods

Maxine Bennett et al. Pharm Stat. 2021 May.

Abstract

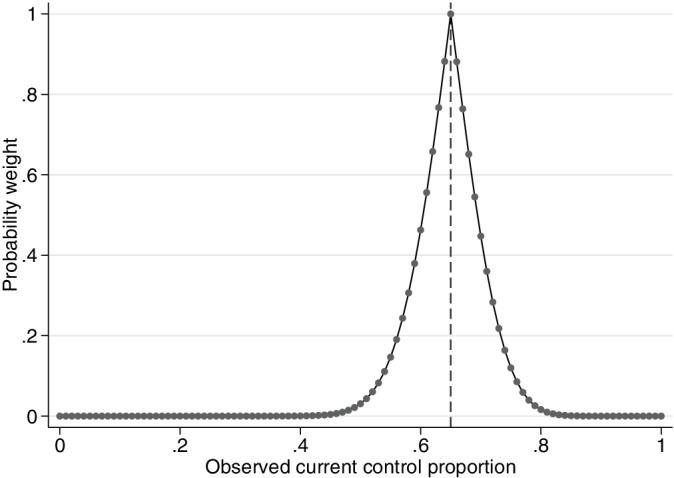
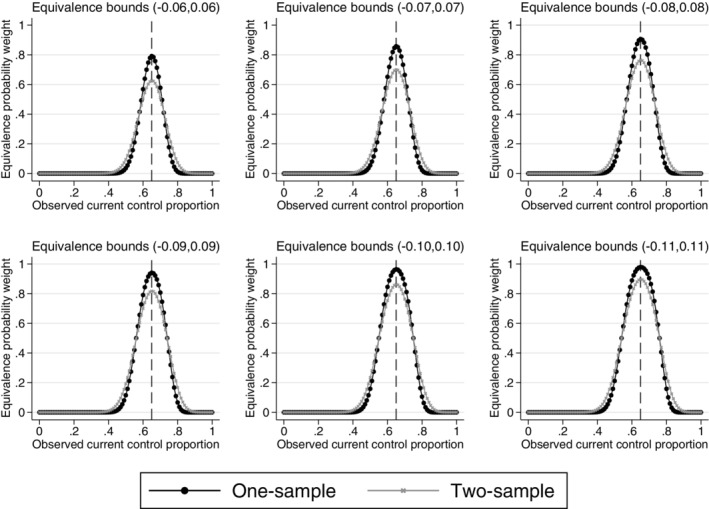
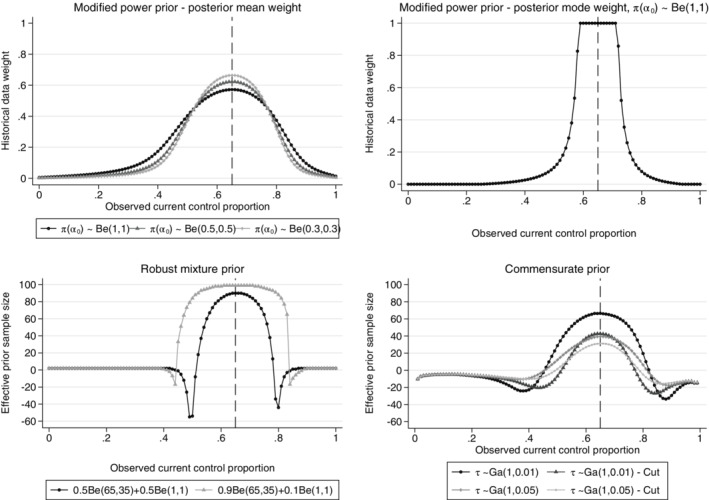
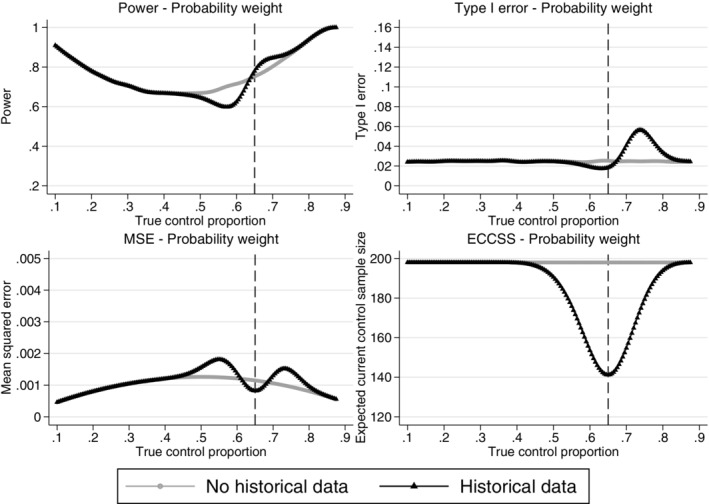
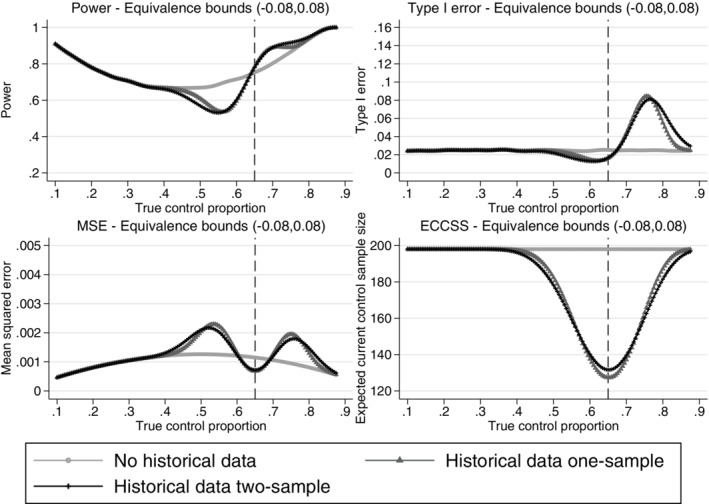
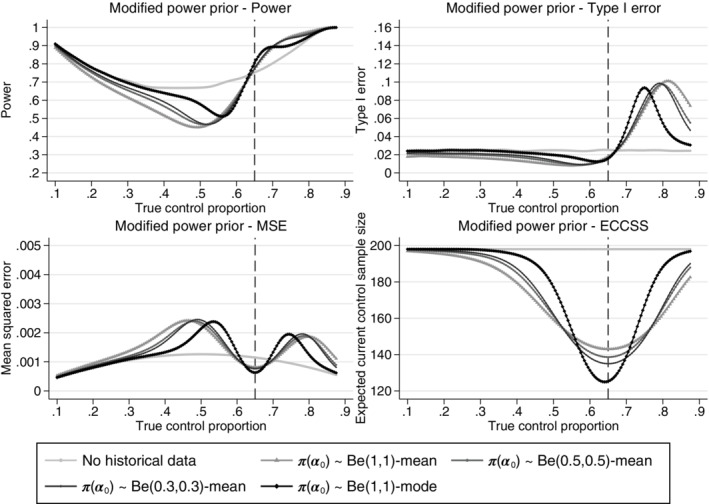
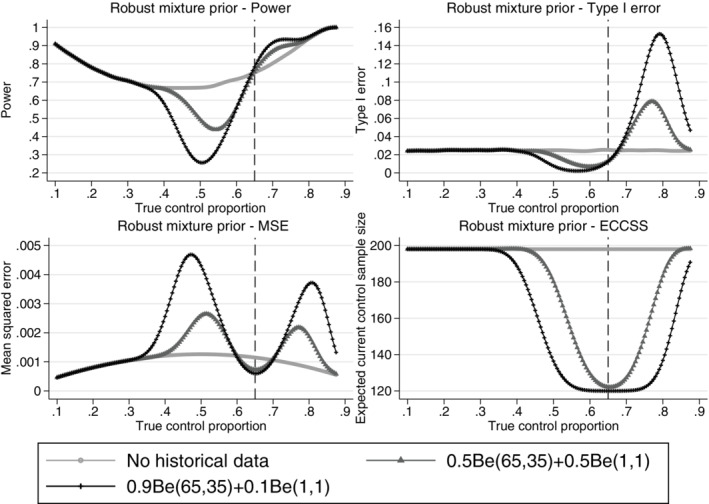
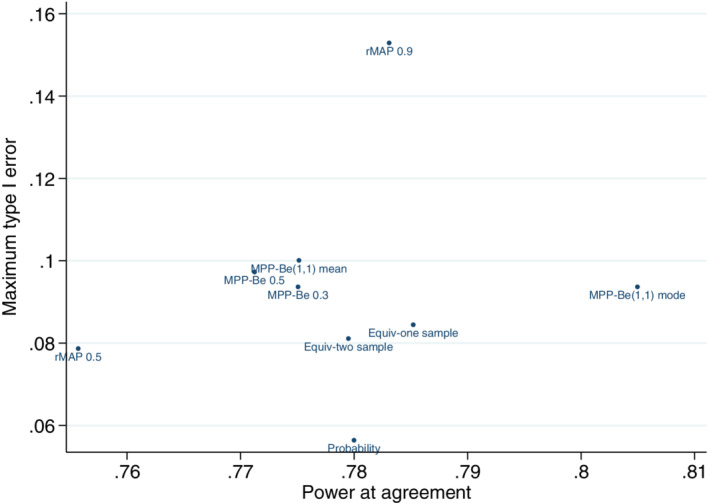
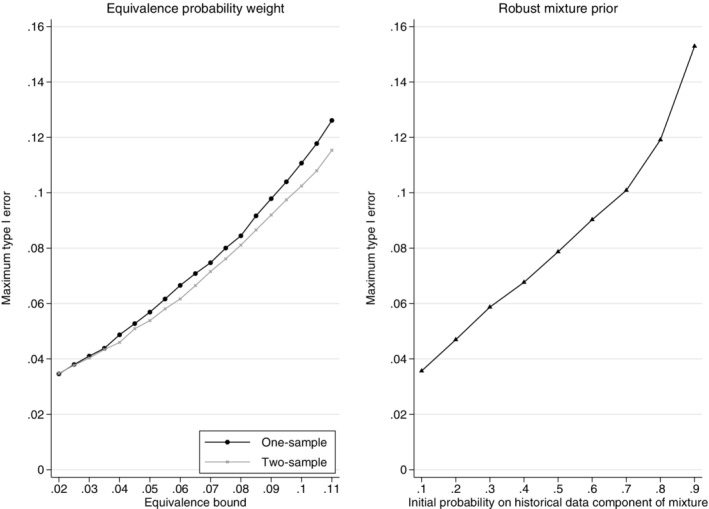
A standard two-arm randomised controlled trial usually compares an intervention to a control treatment with equal numbers of patients randomised to each treatment arm and only data from within the current trial are used to assess the treatment effect. Historical data are used when designing new trials and have recently been considered for use in the analysis when the required number of patients under a standard trial design cannot be achieved. Incorporating historical control data could lead to more efficient trials, reducing the number of controls required in the current study when the historical and current control data agree. However, when the data are inconsistent, there is potential for biased treatment effect estimates, inflated type I error and reduced power. We introduce two novel approaches for binary data which discount historical data based on the agreement with the current trial controls, an equivalence approach and an approach based on tail area probabilities. An adaptive design is used where the allocation ratio is adapted at the interim analysis, randomising fewer patients to control when there is agreement. The historical data are down-weighted in the analysis using the power prior approach with a fixed power. We compare operating characteristics of the proposed design to historical data methods in the literature: the modified power prior; commensurate prior; and robust mixture prior. The equivalence probability weight approach is intuitive and the operating characteristics can be calculated exactly. Furthermore, the equivalence bounds can be chosen to control the maximum possible inflation in type I error.

Keywords: Bayesian; adaptive design; borrowing; historical data; priors.


Conflict of interest statement

The author declares that there is no conflict of interest that could be perceived as prejudicing the impartiality of the research reported.

Figures

FIGURE 1
FIGURE 1
Probability weight for different observed current control response probabilities. Example, historical data 65/100 responses, 100 current controls. The vertical dashed line represents complete agreement between the historical and current control proportions
FIGURE 2
FIGURE 2
One and two‐sample equivalence probability weights for different observed current control response probabilities and different equivalence bounds. Example, historical data 65/100 responses, 100 current controls. The vertical dashed lines represent complete agreement between the historical and current control proportions
FIGURE 3
FIGURE 3
Posterior mean of α 0 for different priors on α 0 (top left), posterior mode of α 0 assuming a Beta(1,1) prior on α 0 (top right), prior effective sample size of the robust mixture prior assuming different initial weights on the informative component of the mixture prior (bottom left), prior effective sample size of the commensurate prior with different priors on τ using the cut function and without the cut function (bottom right), the weights and prior ESS are given for different observed current control response probabilities. Example, historical data 65/100 responses, 100 current controls
FIGURE 4
FIGURE 4
Comparison of the power, type I error, mean squared error and expected current control sample size across different true current control proportions for the adaptive design using the probability weight approach and a standard design incorporating no historical data. Example, historical data 65/100 responses, n c = n t = 200, n c1 = 100, nmin = 20 and Δ = 12%. The vertical dashed lines represent complete agreement between the historical and current control proportions. ECCSS, expected current control sample size; MSE, mean squared error
FIGURE 5
FIGURE 5
Comparison of the power, type I error, mean squared error and expected current control sample size across different true current control proportions for the adaptive design using the one‐sample and two‐sample equivalence probability weight approaches with 8% equivalence bounds and a standard design incorporating no historical data. Example, historical data 65/100 responses, n c = n t = 200, n c1 = 100, nmin = 20 and Δ = 12%. The vertical dashed lines represent complete agreement between the historical and current control proportions. ECCSS, expected current control sample size; MSE, mean squared error
FIGURE 6
FIGURE 6
Comparison of the power, type I error, mean squared error and expected current control sample size across different true current control proportions for the adaptive design using the power prior with a summary measure of the marginal distribution of α 0 as a fixed weight, assuming different priors on the power and a standard design incorporating no historical data. Example, historical data 65/100 responses, n c = n t = 200, n c1 = 100, nmin = 20 and Δ = 12%. The vertical dashed lines represent complete agreement between the historical and current control proportions. ECCSS, expected current control sample size; MSE, mean squared error
FIGURE 7
FIGURE 7
Comparison of the power, type I error, mean squared error and expected current control sample size across different true current control proportions for the adaptive design using the robust mixture prior approach with 0.9 and 0.5 initial weight on the informative component of the mixture prior and a standard design incorporating no historical data. Example, historical data 65/100 responses, n c = n t = 200, n c1 = 100, nmin = 20 and Δ = 12%. The vertical dashed lines represent complete agreement between the historical and current control proportions. ECCSS, expected current control sample size; MSE, mean squared error
FIGURE 8
FIGURE 8
Comparison of maximum type I error and power at complete agreement between the current and historical control parameters for all historical data approaches. Example, historical data 65/100 responses, n c = n t = 200, n c1 = 100, nmin = 20 and Δ = 12%. Probability, probability weight. Equiv‐one sample, One sample equivalence probability weight with 8% equivalence bounds. Equiv‐two sample, Two sample equivalence probability weight with 8% equivalence bounds. MPP‐Be(1,1)‐mean, modified power prior‐ posterior mean weight ‐ π(α 0) ∼ Be(1, 1). MPP‐Be(0.5,0.5)‐mean, modified power prior‐ posterior mean weight ‐ π(α 0) ∼ Be(0.5,0.5). MPP‐Be(0.3,0.3)‐mean, modified power prior‐ posterior mean weight ‐ π(α 0) ∼ Be(0.3,0.3). MPP‐Be(1,1)‐mode, modified power prior‐ posterior mode weight ‐ π(α 0) ∼ Be(1, 1). rMAP 0.9, robust mixture prior ‐ 0.9Be(65,35) + 0.1Be(1,1). rMAP 0.5, robust mixture prior ‐ 0.5Be(65,35) + 0.5Be(1,1)
FIGURE 9
FIGURE 9
Distribution of the maximum possible type I error across a range of equivalence bounds using the one‐sample and two‐sample equivalence probability weight approaches (left plot) and the distribution of the maximum possible type I error across a range of initial mixture prior probabilities on the informative component of the robust mixture prior for the adaptive design (right plot). Example, historical data 65/100 responses, n c = n t = 200, n c1 = 100, nmin = 20 and Δ = 12%

References

    1. Pocock SJ. The combination of randomized and historical controls in clinical trials. J Chronic Dis. 1976;290(3):175‐188. - PubMed
    1. Viele K, Berry S, Neuenschwander B, et al. Use of historical control data for assessing treatment effects in clinical trials. Pharm Stat. 2014;13(1):41–54. - PMC - PubMed
    1. Ibrahim JG, Chen M‐H. Power prior distributions for regression models. Stat Sci. 2000;15(1):46‐60.
    1. Duan Y. A Modified Bayesian Power Prior Approach with Applications in Water Quality Evaluation [PhD thesis]. Virginia Polytechnic Institute and State University; 2005.
    1. Neuenschwander Beat, Branson Michael, and Spiegelhalter David J. A note on the power prior. Stat Med, 280 (28): 3562–3566, 2009. - PubMed

Publication types

LinkOut - more resources