

Seasonal variations in photoperiod affect hepatic metabolism of medaka (Oryzias latipes)
- PMID: 33475250
- PMCID: PMC8016123
- DOI: 10.1002/2211-5463.13095
Seasonal variations in photoperiod affect hepatic metabolism of medaka (Oryzias latipes)
Abstract
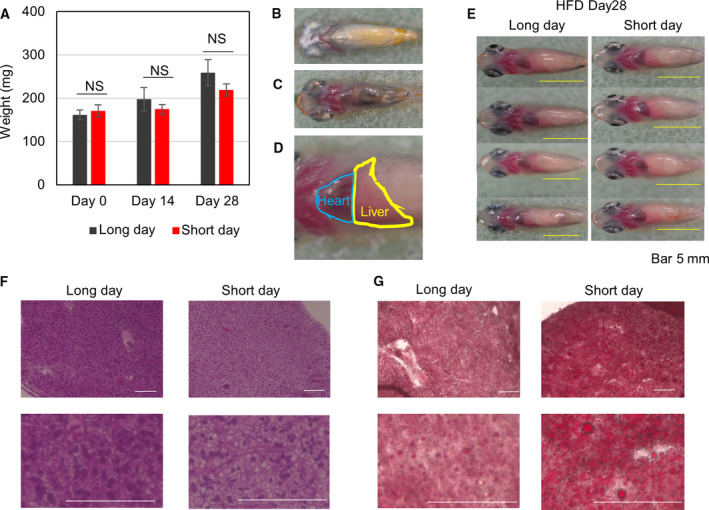
Organisms living in temperate regions are sensitive to seasonal variations in the environment; they are known to accumulate energy as fat in their livers during the winter when days are shorter, temperatures are lower, and food is scarce. However, the effect of variations in photoperiod alone on hepatic lipid metabolism has not been well studied. Therefore, in this study, we analyzed lipid metabolism in the liver of medaka, Oryzias latipes, while varying the length of days at constant temperature. Larger amounts of fatty acids accumulated in the liver after 14 days under short-day conditions than under long-day conditions. Metabolome analysis showed no accumulation of long-chain unsaturated fatty acids, but showed a significant accumulation of long-chain saturated fatty acids. Short-day conditions induced a reduction in the levels of succinate, fumarate, and malate in the tricarboxylic acid cycle, decreased expression of PPARα, and decreased accumulation of acylcarnitine, which suggested inhibition of lipolysis. In addition, transparent medaka fed on a high-fat diet under short-day conditions exhibited greater amounts of fat accumulation and developed fatty liver. The findings of our study will be useful for creating a medaka hepatic steatosis model for future studies of hepatic steatosis-related diseases.
Keywords: fatty liver; medaka; metabolome; photoperiod; tricarboxylic acid cycle.
© 2021 The Authors. FEBS Open Bio published by John Wiley & Sons Ltd on behalf of Federation of European Biochemical Societies.
Conflict of interest statement
The authors declare no conflicts of interest.
Figures


Similar articles
-
Circadian variations in the liver metabolites of medaka (Oryzias latipes).Sci Rep. 2016 Feb 10;6:20916. doi: 10.1038/srep20916. Sci Rep. 2016. PMID: 26862003 Free PMC article.
-
Evaluation of the effects of L-carnitine on medaka (Oryzias latipes) fatty liver.Sci Rep. 2017 Jun 5;7(1):2749. doi: 10.1038/s41598-017-02924-5. Sci Rep. 2017. PMID: 28584294 Free PMC article.
-
Medaka as a model for seasonal plasticity: Photoperiod-mediated changes in behaviour, cognition, and hormones.Horm Behav. 2022 Sep;145:105244. doi: 10.1016/j.yhbeh.2022.105244. Epub 2022 Aug 18. Horm Behav. 2022. PMID: 35988451
-
Variation in responses to photoperiods and temperatures in Japanese medaka from different latitudes.Zoological Lett. 2023 Jul 22;9(1):16. doi: 10.1186/s40851-023-00215-8. Zoological Lett. 2023. PMID: 37480068 Free PMC article.
-
Seasonal changes in immune function.Q Rev Biol. 1996 Dec;71(4):511-48. doi: 10.1086/419555. Q Rev Biol. 1996. PMID: 8987173 Review.
Cited by
-
Grape-Seed Procyanidin Extract (GSPE) Seasonal-Dependent Modulation of Glucose and Lipid Metabolism in the Liver of Healthy F344 Rats.Biomolecules. 2022 Jun 17;12(6):839. doi: 10.3390/biom12060839. Biomolecules. 2022. PMID: 35740964 Free PMC article.
-
Lipidomics analysis reveals new insights into crisp grass carp associated with meat texture.Heliyon. 2024 May 31;10(11):e32179. doi: 10.1016/j.heliyon.2024.e32179. eCollection 2024 Jun 15. Heliyon. 2024. PMID: 38868033 Free PMC article.
-
Dietary Cholesterol Differentially Regulates the Muscle Lipidomics of Farmed Turbot and Tiger Puffer.Animals (Basel). 2023 May 13;13(10):1632. doi: 10.3390/ani13101632. Animals (Basel). 2023. PMID: 37238062 Free PMC article.
-
Day length regulates gonadotrope proliferation and reproduction via an intra-pituitary pathway in the model vertebrate Oryzias latipes.Commun Biol. 2024 Mar 30;7(1):388. doi: 10.1038/s42003-024-06059-y. Commun Biol. 2024. PMID: 38553567 Free PMC article.
-
Prolonged Cold Exposure Negatively Impacts Atlantic Salmon (Salmo salar) Liver Metabolism and Function.Biology (Basel). 2024 Jul 3;13(7):494. doi: 10.3390/biology13070494. Biology (Basel). 2024. PMID: 39056688 Free PMC article.
References
-
- Fujisawa K, Takami T, Nagatomo T, Fukui Y, Hoshida H, Saeki I, Matsumoto T, Hidaka I, Yamamoto N and Sakaida I (2019) Usefulness of adult medaka fish as a model for the evaluation of alcoholic fatty liver. Alcohol 77, 147–154. - PubMed
Publication types
MeSH terms
Substances
LinkOut - more resources
Full Text Sources
Other Literature Sources
