. 2021 Jun;10(6):867-882.
doi: 10.1002/sctm.20-0300. Epub 2021 Jan 21.

Transcriptional and functional characterization of neonatal circulating Innate Lymphoid Cells

Affiliations

Transcriptional and functional characterization of neonatal circulating Innate Lymphoid Cells

Sabrina Bianca Bennstein et al. Stem Cells Transl Med. 2021 Jun.

Abstract

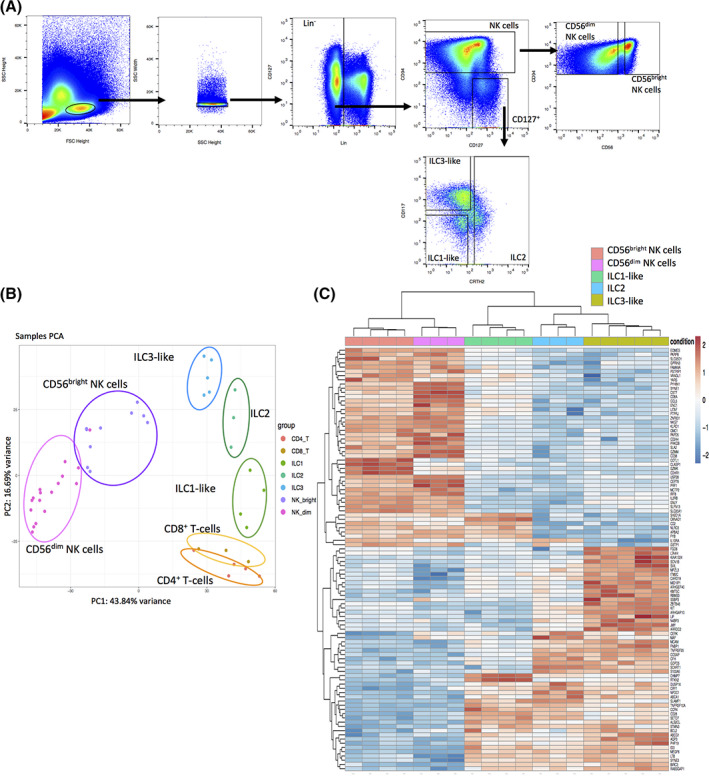
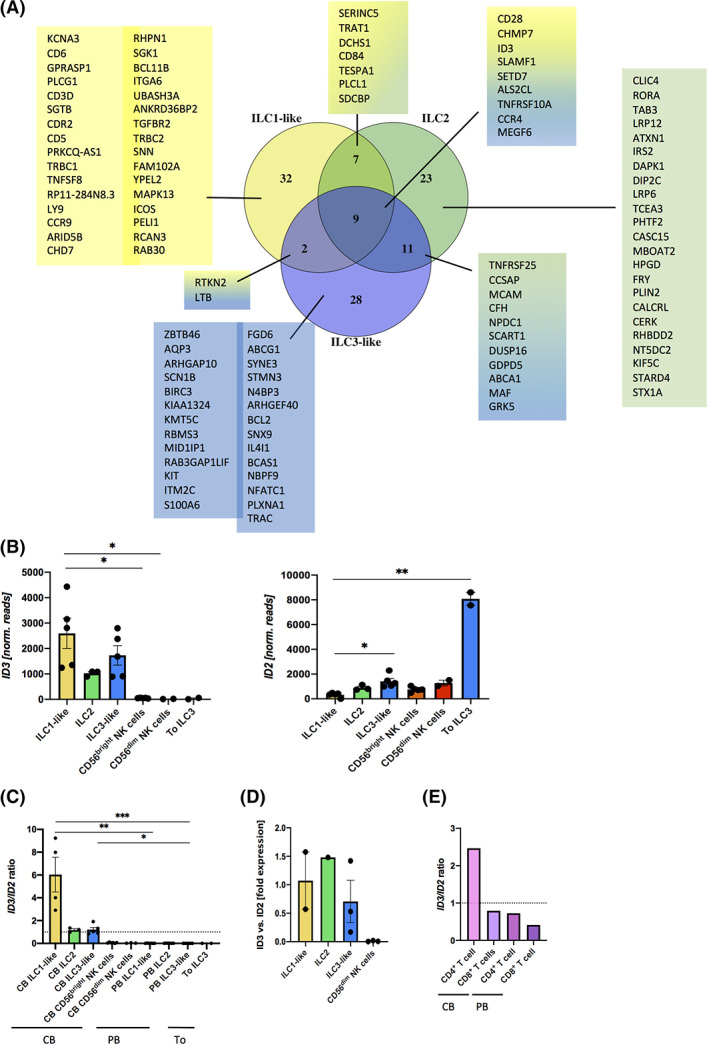
Innate lymphoid cells (ILCs), comprising ILC1, 2, and 3 subpopulations, play unique roles in maintaining microbiome homeostasis, mucosal tissue integrity, and control of inflammation. So far, their characterization is dominantly based on tissue-resident ILCs, whereas little information is available on circulating ILCs, in particular in newborns. In order to get a deeper understanding of neonatal innate immunity, we analyzed the transcriptomes and effector functions of cord blood (CB) ILCs. By RNAseq analysis, all ILC subsets could be clearly distinguished from each other. CB-derived ILCs were generally closer related to neonatal T than natural killer (NK) cells and several factors shared by all three ILC subsets such as CD28, CCR4, and SLAMF1 are commonly expressed by T cells but lacking in NK cells. Notably, CB ILCs exhibited a unique signature of DNA binding inhibitor (ID) transcription factors (TF) with high ID3 and low ID2 expression distinct from PB- or tonsil-derived ILCs. In vitro stimulation of sorted CB ILCs revealed distinct differences to tissue-resident ILCs in that ILC1-like and ILC3-like cells were nonresponsive to specific cytokine stimulation, indicating functional immaturity. However, CB ILC3-like cells expressed toll-like receptors TLR1 and TLR2 and upon stimulation with the TLR2:1 ligand Pam3 CSK4 , responded with significantly increased proliferation and cytokine secretion. Together, our data provide novel insights into neonatal ILC biology with a unique TF signature of CB ILCs possibly indicating a common developmental pathway and furthermore a role of CB ILC3-like cells in innate host defense.

Keywords: ID3; ILCs; TLR2:1; transcriptome; umbilical cord blood.


Conflict of interest statement

The authors declared no potential conflicts of interest.

Figures

FIGURE 1
FIGURE 1
Unique transcriptional identity of cord blood (CB) innate lymphoid cells (ILCs) compared to T cells, natural killer (NK) cells, and tissue ILCs. A, Exemplary gating strategy for ILC sorting. B, CB mononuclear cells were enriched prior to sorting via FITC‐labeled antibodies (anti‐CD3/CD14/CD19/CD66b) and sorted for CB ILC1‐like cells (linCD94CD127+CD117CRTH2, n = 4), ILC2 (linCD94CD127+CD117−/+CRTH2+, n = 3), ILC3‐like cells (linCD94CD127+CD117+CRTH2, n = 5), as well as CB‐ and peripheral blood (PB)‐derived CD56bright NK cells (linCD94+CD56bright, n = 9), CD56dim NK cells (linCD94+CD56dim, n = 17), CD8+ T cells (CD3+CD8+, n = 3), and CD4+ T cells (CD3+CD4+, n = 5). RNA sequencing was done on the Illumina platform. A two‐dimensional principle component analyses (PCA) was performed based on the top 2000 differential expressed genes of CB ILC1‐like, ILC2, ILC3‐like as well as CB and PB CD56bright NK cells, CD56dim NK cells, CD8+ and CD4+ T cells. C, Heatmap showing the top 100 differentially expressed genes between ILC3‐like and CD56bright NK cells including ILC2, ILC1‐like, and CD56dim NK cells. Data represent at least three donors from three different experiments. Lineage (Lin) cocktail contains antibodies against CD3, CD14, CD19, CD66b, CD123, FcɛR1a, TCRα𝛽, TCRγδ, CD1a, CD235a, CD20, BDCA2, and CD34
FIGURE 2
FIGURE 2
Cord blood (CB) innate lymphoid cell (ILC)‐specific gene expression includes a unique pattern of ID transcription factors. A, Venn Diagram showing the 50 most differentially upregulated genes of ILC1‐like (yellow), ILC2 (green), and ILC3‐like cells (blue) against CD56bright natural killer (NK) cells with an adjusted P‐value cutoff of <.001 and a log2 fold change of >2. B, Normalized read counts of ID3 (left hand side) and ID2 (right hand side) of CB ILC1‐like, ILC2, ILC3‐like cells, CB CD56bright NK cells, CB CD56dim NK cells, and tonsillar ILC3 and C, a ratio between ID3/ID2 from the same populations as in (B) as well as PB ILC1‐like, ILC2, and ILC3‐like cells based on data generated by Li et al. 22 D, Fold gene expression of ID3 to ID2 of freshly sorted CB ILC1‐like cells, ILC2, ILC3‐like cells and CD56dim NK cells (n = 1‐3). E, Ratio between ID3/ID2 for CB and PB CD4+ and CD8+ T cells (n = 2). The height of the bars represents the mean ± SEM. Levels of significance were calculated with a nonparametric ANOVA (Kruskal‐Wallis test) with a multiple comparison post‐test (Dunn's). Data represent at least three donors from three different experiments (B,C)
FIGURE 3
FIGURE 3
Gene expression patterns defining the identity of each cord blood (CB) innate lymphoid cell (ILC) subtype. A, A four‐way plot with a log2 fold change cut off at ±1 (dotted lines) and adjusted P‐values of .05 showing differentially expressed genes of CB ILC1‐like (“control”) compared ILC2 (“y”) and ILC3‐like cells (“x”). Blue dots represent genes with an adjusted P‐value <.05 with a fold change >1. Green dots represent genes with an adjusted P‐value <.05 with a fold change between >1 (x‐axis) and <1 (y‐axis). Gray dots represent genes with an adjusted P‐value >.05. Red dots represent genes with an adjusted P‐value <.05 with fold rates <1 (x‐axis) and >1 (y‐axis). Selected genes differentially expressed between ILC1‐like cells, ILC2, and ILC3‐like cells are highlighted. B‐D, MA plots showing all differentially expressed genes and heatmaps showing differential expressed genes between (B) ILC1‐like vs ILC2, (C) ILC3‐like vs ILC1‐like, and (D) ILC3‐like vs ILC2. In the MA plots, dotted lines represent a log2 fold change cut off of 1. Blue dots represent a P‐value <.05 and a log2 fold change of >1. Green dots represent a P‐value of <.05 and a log2 fold change of <1. Gray dots represent a P‐value >.05 and a log2 fold change of <1. Numbers of blue or green genes are indicated next to the MA plot. Selected blue genes are highlighted. E, Violin plots showing normalized read counts for LIF (left hand side) and ZBTB46 (right hand side) for CB ILC1‐like, ILC2, and ILC3‐like cells. Levels of significance were calculated with a nonparametric ANOVA (Kruskal‐Wallis test) with a multiple comparison post‐test (Dunn's), *P‐value <.05, **P‐value <.005. Data represent at least three donors from three different experiments
FIGURE 4
FIGURE 4
Cord blood (CB) innate lymphoid cell subpopulation (ILC1)‐ and ILC3‐like cells are functionally immature, whereas CB ILC2 are fully functional. A, Normalized RNA sequencing read counts are displayed as violin plots for the signature transcription factors EOMES, GATA3, RORC, and T‐BET(Tbx21) for the indicated cell types. B, Histograms showing intranuclear staining for the signature TFs T‐bet, Eomes, Gata‐3, and RORC for ILC1‐like (filled yellow), ILC2 (filled green), ILC3‐like (filled blue), CD56bright natural killer (NK) cells (filled red), and CD56dim NK cells (taken as reference unfilled red). C, Normalized read counts of ex vivo sorted CB ILC1‐like, ILC2, ILC3‐like, CD56bright NK cells, and tonsillar ILC3 for IFNγ, IL‐5, IL‐13, IL‐4, IL‐17A, and IL‐22. D, CB ILC1‐like, ILC2, and ILC3‐like cells were sorted and specifically stimulated with IL‐12/IL‐18 (for ILC1‐like and CD56bright NK cells), IL‐2/IL‐33 (for ILC2), and IL1𝛽/IL‐23 ± IL‐2 (for ILC3‐like cells) for 5 days. IFNγ, IL‐4, IL‐5, IL‐13, IL‐22, IL‐17a, IL‐10 and E, LIF secretion was analyzed within the supernatant via multi‐cytokine assay at day 1 and 5 (LegendPlex©), n = 5 (ILC1‐like cells), n = 2 (CD56bright NK cells), n = 4 (ILC2), and n = 3‐7 (ILC3‐like cells). The height of the bars represents the mean ± SEM. Levels of significance were calculated with a nonparametric ANOVA (Kruskal‐Wallis test) with a multiple comparison post‐test (Dunn's), *P‐value <.05. Data represent at least three donors from three different experiments
FIGURE 5
FIGURE 5
Cord blood (CB) innate lymphoid cell subpopulation (ILC3)‐like cells are sensing TLR2:1 ligands. A, Normalized read counts of RNAseq data of CB ILC1‐like, ILC2, and ILC3‐like cells for TLR 1‐9. B, Bar graphs showing the frequency of CB ILC3‐like cell survival in medium alone, with Pam3CSK4 alone, with IL‐2 alone, and a combination of IL‐2 and Pam3CSK4. C, Cryopreserved CB samples were stained for ILCs. Representative dot plots and quantification for CD117 and CD25 expression are shown for ILC1‐like cells, ILC2, ILC3‐like cells, CD56bright natural killer (NK) cells, and CD56dim NK cells. D, Normalized read counts for IL12RA encoding CD25 are shown for CB ILC3‐like cells and tonsillar ILC3 (E/F) Fresh CB MNCs were isolated, depleted of CD3, CD14, CD19, and CD66b‐expressing cells and subsequently purified by sorting for ILC3‐like cells (LinCD94CD127+CD117+CRTH2). ILC3‐like cells were stimulated for 5 days with IL‐2 with or without the TLR2:1 ligand Pam3CSK4. E, Expansion of ILC3‐like cells (n = 7); and F, TNFα, IFNγ, IL‐13, IL‐5, IL‐10, IL‐22, LIF, and GM‐CSF secretion is shown (n = 6). The height of the bars represents the mean ± SEM. Levels of significance were calculated with a nonparametric ANOVA (Kruskall‐Wallis with a Dunn's post‐test) (B,C) and t test (Mann‐Whitney) (E,F), *P‐value <.05, **P‐value <.005

References

    1. Spits H, Artis D, Colonna M, et al. Innate lymphoid cells ‐ a proposal for uniform nomenclature. Nat Rev Immunol. 2013;13(2):145‐149. - PubMed
    1. Vivier E, Artis D, Colonna M, et al. Innate lymphoid cells: 10 years on. Cell. 2018;174(5):1054‐1066. - PubMed
    1. Lim AI, Li Y, Lopez‐Lastra S, et al. Systemic human ILC precursors provide a substrate for tissue ILC differentiation. Cell. 2017;168(6):1086‐1100.e1010. - PubMed
    1. Bennstein SB, Weinhold S, Manser AR, et al. Umbilical cord blood‐derived ILC1‐like cells constitute a novel precursor for mature KIR+NKG2A‐ NK cells. Elife. 2020;9:e55232. - PMC - PubMed
    1. Carvelli J, Piperoglou C, Bourenne J, et al. Imbalance of circulating innate lymphoid cell subpopulations in patients with septic shock [Clinical Trial] [in English]. Front Immunol. 2019;10:2179. - PMC - PubMed

Publication types