. 2021 May 1;130(5):1383-1397.
doi: 10.1152/japplphysiol.00764.2020. Epub 2021 Jan 21.

A dynamic model of the body gas stores for carbon dioxide, oxygen, and inert gases that incorporates circulatory transport delays to and from the lung

Affiliations

A dynamic model of the body gas stores for carbon dioxide, oxygen, and inert gases that incorporates circulatory transport delays to and from the lung

Snapper R M Magor-Elliott et al. J Appl Physiol (1985). .

Abstract

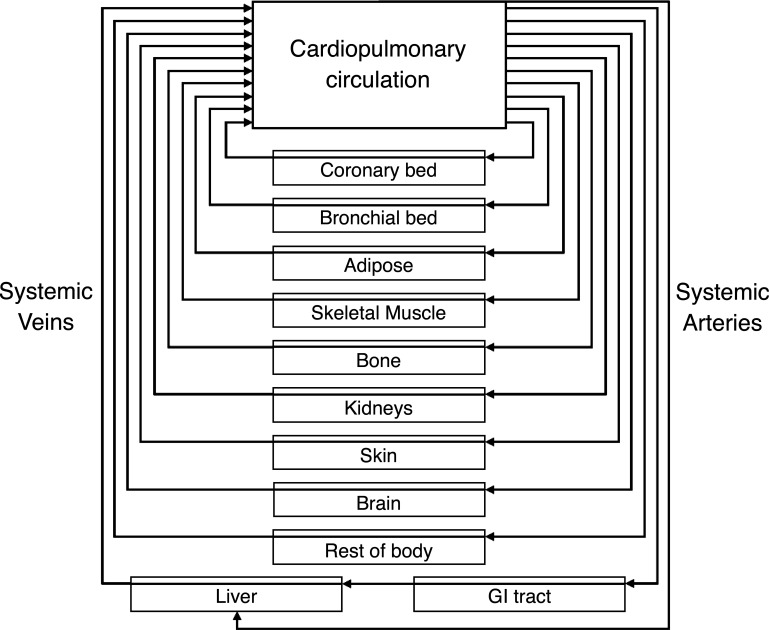
Many models of the body's gas stores have been generated for specific purposes. Here, we seek to produce a more general purpose model that: 1) is relevant for both respiratory (CO2 and O2) and inert gases; 2) is based firmly on anatomy and not arbitrary compartments; 3) can be scaled to individuals; and 4) incorporates arterial and venous circulatory delays as well as tissue volumes so that it can reflect rapid transients with greater precision. First, a "standard man" of 11 compartments was produced, based on data compiled by the International Radiation Protection Commission. Each compartment was supplied via its own parallel circulation, the arterial and venous volumes of which were based on reported tissue blood volumes together with data from a detailed anatomical model for the large arteries and veins. A previously published model was used for the blood gas chemistry of CO2 and O2. It was not permissible ethically to insert pulmonary artery catheters into healthy volunteers for model validation. Therefore, validation was undertaken by comparing model predictions with previously published data and by comparing model predictions with experimental data for transients in gas exchange at the mouth following changes in alveolar gas composition. Overall, model transients were fastest for O2, intermediate for CO2, and slowest for N2. There was good agreement between model estimates and experimentally measured data. Potential applications of the model include estimation of closed-loop gain for the ventilatory chemoreflexes and improving the precision associated with multibreath washout testing and respiratory measurement of cardiac output.NEW & NOTEWORTHY A model for the body gas stores has been generated that is applicable to both respiratory gases (CO2 and O2) and inert gases. It is based on anatomical details for organ volumes and blood contents together with anatomical details of the large arteries. It can be scaled to the body size and composition of different individuals. The model enables mixed venous gas compositions to be predicted from the systemic arterial compositions.

Keywords: mixed venous composition; mixed venous saturation; pulmonary arterial blood gases.


Conflict of interest statement

No conflicts of interest, financial or otherwise, are declared by the authors.

Figures

Figure 1.
Figure 1.
Schematic of the model of the circulatory and body gas stores. Vessels are arranged in parallel flow streams of differing lengths and perfusions. The connected tissues have differing volumes and partial pressure to concentration storage relationships.
Figure 2.
Figure 2.
Schematic of the arterial tree used to calculate total vessel volumes for each compartment. Art num, artery number corresponding to the key used in Table A1; V, arterial segment volume/ml; Qf, fraction of the total perfusion supplied to the compartment. White boxes, vessels; light gray rounded boxes, discrete tissues; light gray rectangular boxes, dispersed tissue sites; dark gray filled box, heart. GI, gastrointestinal.
Figure 3.
Figure 3.
The responses of the circulatory model to a step change in 1 kPa for N2, CO2, and O2. A-C: fractional change from old to new steady-state venous concentrations for each of the 11 compartments after a 1 kPa rise in N2, ΔFc,N2 (A); CO2, ΔFc,CO2 (B); and O2, ΔFc,O2 (C). D: fractional change from old to new steady-state concentration in the pulmonary vascular blood volume after a 1 kPa rise for each of the gases, ΔFx. E: variation in gas exchange at the level of the pulmonary capillaries for each of the three gases following a 1 kPa step increase in alveolar/arterial gas tension. Also shown are 1) the variation in gas exchange for a change in alveolar/arterial O2 from 6.66 to 13.3 kPa and 2) the variation in gas exchange at the mouth for a 1 kPa change in alveolar concentration. Parameters used for generating plots are those for the standard man. ROB, rest of body.
Figure 4.
Figure 4.
Mixed venous N2 concentration following a switch to breathing pure oxygen. Full line, CBGS simulation (parameters are as for standard man); broken line, model of Baker and Farmery (3); symbols, measured values for dog (25). CBGS, circulation and body gas stores.
Figure 5.
Figure 5.
Increase in arterial Pco2 during a period of tracheal clamping under conditions of pure oxygen. Full line, CBGS simulation; symbols, data from an anesthetized human (50). Circulation and body gas stores (CBGS) parameters were for the standard man but with a metabolic rate appropriate for anesthesia.
Figure 6.
Figure 6.
Experimental and model responses to rebreathing from a 6 liter bag for three participants. A-C: airway Pco2, model superimposed on data. D-F: airway Pco2, data superimposed on model. G-I: cumulative CO2 production (V̇co2), model superimposed on data. J-L: cumulative error in CO2 production (model - measured) when the CBGS model is included (full line) and when a dummy circulation is used (broken line). A, D, G, and J: participant 2. B, E, H, and K: participant 3. C, F, I, and L: participant 4. To derive the model output, participant-specific inhomogeneity parameters were taken from a prior experiment; O2 consumption and CO2 production were estimated from the air breathing phase of the experiment; and the initial mixed venous values together with the alveolar lung volume were estimated from the data. CBGS, circulation and body gas stores.
Figure 7.
Figure 7.
Experimental and model responses to voluntary, paced hyperventilation for three participants. A-C: airway Pco2, model superimposed on data. D-F: airway Pco2, data superimposed on model. G-I: cumulative CO2 production (V̇co2), model superimposed on data. J-L: cumulative error in CO2 production (model - measured) when the CBGS model is included (full line) and when a dummy circulation is used (broken line). A, D, G, and J: participant 2. B, E, H, and K: participant 3. C, F, I, and L: participant 4. To derive the model output, participant-specific inhomogeneity parameters were taken from a prior experiment; O2 consumption and CO2 production were estimated from the air breathing phase of the experiment; and the initial mixed venous values together with the alveolar lung volume were estimated from the data. CBGS, circulation and body gas stores.
Figure 8.
Figure 8.
Experimental and model responses to the nitrogen washin protocol for three participants. A-C: airway Pco2, model superimposed on data. D-F: airway Po2, data superimposed on model. G-I: cumulative O2 production (V̇co2), model superimposed on data. J-L: cumulative error in O2 consumption (model - measured) when the CBGS model is included (full line) and when a dummy circulation is used (broken line). A, D, G, and J: participant 1. B, E, H, and K: participant 2. C, F, I, and L: participant 3. To derive the model output, participant-specific inhomogeneity parameters were taken from a prior experiment; O2 consumption and CO2 production were estimated from the air breathing phase of the experiment; and the initial mixed venous values together with the alveolar lung volume were estimated from the data. CBGS, circulation and body gas stores.

Similar articles

Cited by

References

    1. Farhi LE, Rahn H. Dynamics of changes in carbon dioxide stores. Anesthesiology 21: 604–614, 1960. doi:10.1097/00000542-196011000-00004. - DOI - PubMed
    1. Fowle ASE, Campbell JM. The immediate carbon dioxide storage capacity of man. Clin Sci 27: 41–49, 1964. - PubMed
    1. Baker AB, Farmery AD. Inert gas transport in blood and tissues. Compr Physiol 1: 569–592, 2011. - PubMed
    1. Brown RP, Delp MD, Lindstedt LD, Rhomberg LR, Beliles RP. Physiological parameter values for physiologically based pharmacokinetic models. Toxicol Ind Health 13: 407–484, 1997. doi:10.1177/074823379701300401. - DOI - PubMed
    1. Mapleson WW, Davis NR. Structure and quantification of a physiological model of the distribution of injected agents and inhaled anaesthetics. Br J Anaesth 53: 399–405, 1981. doi:10.1093/bja/53.4.399. - DOI - PubMed

Publication types

LinkOut - more resources