

Parametric Mapping for TSPO PET Imaging with Spectral Analysis Impulsive Response Function
- PMID: 33475944
- PMCID: PMC8277653
- DOI: 10.1007/s11307-020-01575-9
Parametric Mapping for TSPO PET Imaging with Spectral Analysis Impulsive Response Function
Abstract
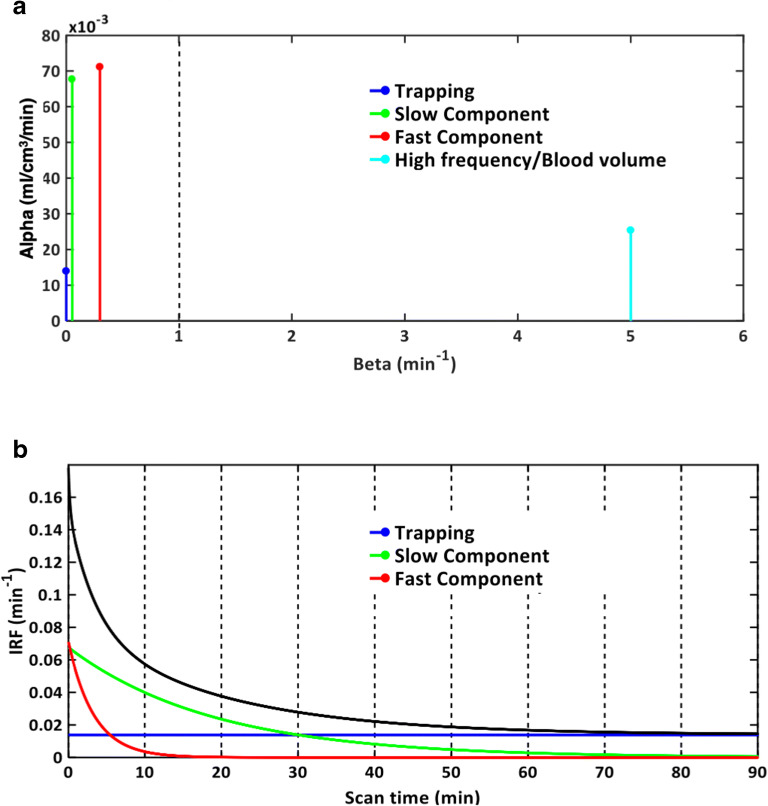
Purpose: The aim of this study was to investigate the use of spectral analysis (SA) for voxel-wise analysis of TSPO PET imaging studies. TSPO PET quantification is methodologically complicated by the heterogeneity of TSPO expression and its cell-dependent modulation during neuroinflammatory response. Compartmental models to account for this complexity exist, but they are unreliable at the high noise typical of voxel data. On the contrary, SA is noise-robust for parametric mapping and provides useful information about tracer kinetics with a free compartmental structure.
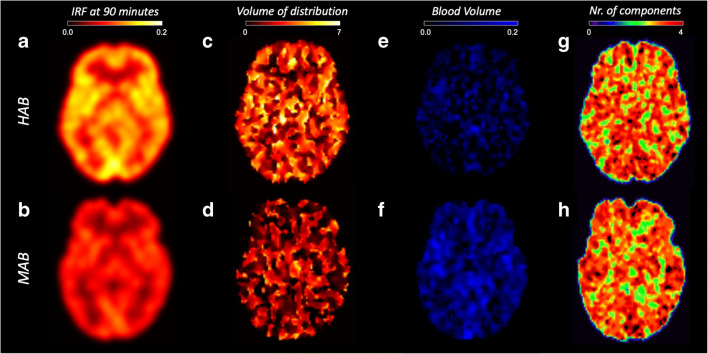
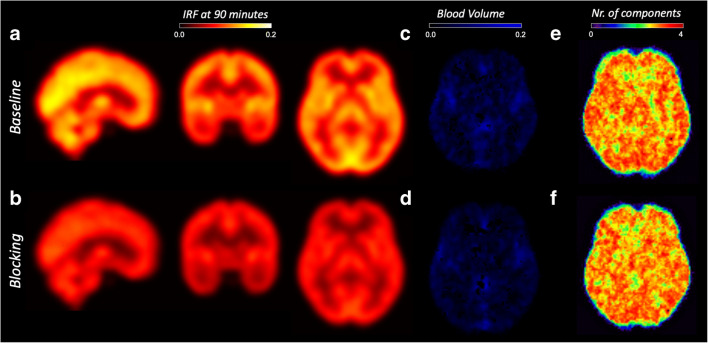
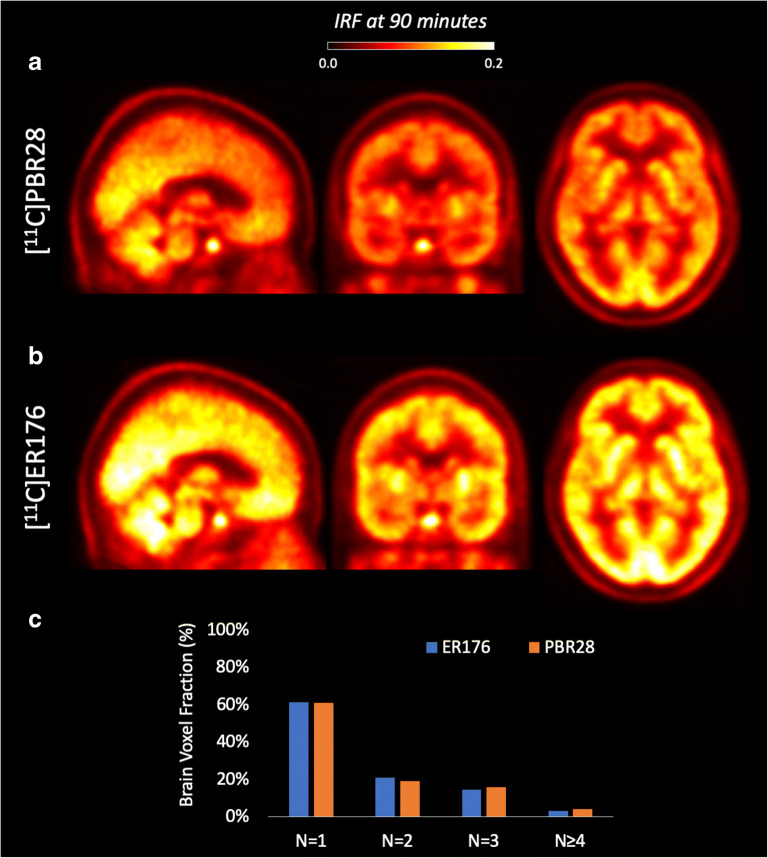
Procedures: SA impulse response function (IRF) calculated at 90 min after tracer injection was used as main parameter of interest in 3 independent PET imaging studies to investigate its sensitivity to (1) a TSPO genetic polymorphism (rs6971) known to affect tracer binding in a cross-sectional analysis of healthy controls scanned with [11C]PBR28 PET; (2) TSPO density with [11C]PBR28 in a competitive blocking study with a TSPO blocker, XBD173; and (3) the higher affinity of a second radiotracer for TSPO, by using data from a head-to-head comparison between [11C]PBR28 and [11C]ER176 scans.
Results: SA-IRF produced parametric maps of visually good quality. These were sensitive to TSPO genotype (mean relative difference between high- and mixed-affinity binders = 25 %) and TSPO availability (mean signal displacement after 90 mg oral administration of XBD173 = 39 %). Regional averages of voxel-wise IRF estimates were strongly associated with regional total distribution volume (VT) estimated with a 2-tissue compartmental model with vascular compartment (Pearson's r = 0.86 ± 0.11) but less strongly with standard 2TCM-VT (Pearson's r = 0.76 ± 0.32). Finally, SA-IRF estimates for [11C]ER176 were significantly higher than [11C]PBR28 ones, consistent with the higher amount of specific binding of the former tracer.
Conclusions: SA-IRF can be used for voxel-wise quantification of TSPO PET data because it generates high-quality parametric maps, it is sensitive to TSPO availability and genotype, and it accounts for the complexity of TSPO tracer kinetics with no additional assumptions.
Keywords: PET; Parametric mapping; Spectral analysis; TSPO.
© 2021. The Author(s).
Conflict of interest statement
The authors declare that they have no conflict of interest.
Figures
References
-
- Herrera-Rivero M, Heneka MT, Papadopoulos V. Translocator protein and new targets for neuroinflammation. Clin Transl Imaging. 2015;3(6):391–402. doi: 10.1007/s40336-015-0151-x. - DOI
Publication types
MeSH terms
Substances
Grants and funding
LinkOut - more resources
Full Text Sources
Other Literature Sources
Medical
