Channel Interaction During Infrared Light Stimulation in the Cochlea
- PMID: 33476051
- PMCID: PMC8787864
- DOI: 10.1002/lsm.23360
Channel Interaction During Infrared Light Stimulation in the Cochlea
Abstract
Background and objectives: The number of perceptually independent channels to encode acoustic information is limited in contemporary cochlear implants (CIs) because of the current spread in the tissue. It has been suggested that neighboring electrodes have to be separated in humans by a distance of more than 2 mm to eliminate significant overlap of the electric current fields and subsequent interaction between the channels. It has also been argued that an increase in the number of independent channels could improve CI user performance in challenging listening environments, such as speech in noise, tonal languages, or music perception. Optical stimulation has been suggested as an alternative modality for neural stimulation because it is spatially selective. This study reports the results of experiments designed to quantify the interaction between neighboring optical sources in the cochlea during stimulation with infrared radiation.
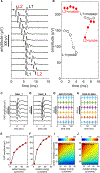
Study design/materials and methods: In seven adult albino guinea pigs, a forward masking method was used to quantify the interaction between two neighboring optical sources during stimulation. Two optical fibers were placed through cochleostomies into the scala tympani of the basal cochlear turn. The radiation beams were directed towards different neuron populations along the spiral ganglion. Optically evoked compound action potentials were recorded for different radiant energies and distances between the optical fibers. The outcome measure was the radiant energy of a masker pulse delivered 3 milliseconds before a probe pulse to reduce the response evoked by the probe pulse by 3 dB. Results were compared for different distances between the fibers placed along the cochlea.
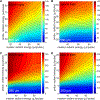
Results: The energy required to reduce the probe's response by 3 dB increased by 20.4 dB/mm and by 26.0 dB/octave. The inhibition was symmetrical for the masker placed basal to the probe (base-to-apex) and the masker placed apical to the probe (apex-to-base).
Conclusion: The interaction between neighboring optical sources during infrared laser stimulation is less than the interaction between neighboring electrical contacts during electrical stimulation. Previously published data for electrical stimulation reported an average current spread in human and cat cochleae of 2.8 dB/mm. With the increased number of independent channels for optical stimulation, it is anticipated that speech and music performance will improve. Lasers Surg. Med. © 2020 Wiley Periodicals LLC.
Keywords: channel interaction; cochlear implant; hearing; infrared stimulation; laser.
© 2021 Wiley Periodicals LLC.
Conflict of interest statement
CONFLICT OF INTEREST DISCLOSURES
All authors have completed and submitted the ICMJE Form for Disclosure of Potential Conflicts of Interest and have disclosed the following: Aditi Agarwal has nothing to disclose. Xiaodong Tan and Yingyue Xu report a pending patent, US Patent No. 62/801,771. Claus-Peter Richter reports issued patents, US Patent No. 7833257, US Patent No. US 9,327,120, US Patent No. US 10,300,269 and pending patents US Patent No. 62,191,084, US Patent No. US 62,298,992, US Patent No. US 62,718,569, and US Patent No. 62/801,771.
Figures


Similar articles
-
Effect of shorter pulse duration in cochlear neural activation with an 810-nm near-infrared laser.Lasers Med Sci. 2017 Feb;32(2):389-396. doi: 10.1007/s10103-016-2129-y. Epub 2016 Dec 20. Lasers Med Sci. 2017. PMID: 27995385
-
Pulsed 808-nm infrared laser stimulation of the auditory nerve in guinea pig cochlea.Lasers Med Sci. 2014 Jan;29(1):343-9. doi: 10.1007/s10103-013-1348-8. Epub 2013 May 28. Lasers Med Sci. 2014. PMID: 23712393
-
Spread of activation and interaction between channels with multi-channel optogenetic stimulation in the mouse cochlea.Hear Res. 2023 Dec;440:108911. doi: 10.1016/j.heares.2023.108911. Epub 2023 Nov 4. Hear Res. 2023. PMID: 37977051
-
Acute damage threshold for infrared neural stimulation of the cochlea: functional and histological evaluation.Anat Rec (Hoboken). 2012 Nov;295(11):1987-99. doi: 10.1002/ar.22583. Epub 2012 Oct 8. Anat Rec (Hoboken). 2012. PMID: 23044730 Free PMC article. Review.
-
An overview of cochlear implant electrode array designs.Hear Res. 2017 Dec;356:93-103. doi: 10.1016/j.heares.2017.10.005. Epub 2017 Oct 18. Hear Res. 2017. PMID: 29102129 Review.
Cited by
-
Emerging trends in the development of flexible optrode arrays for electrophysiology.APL Bioeng. 2023 Sep 7;7(3):031503. doi: 10.1063/5.0153753. eCollection 2023 Sep. APL Bioeng. 2023. PMID: 37692375 Free PMC article. Review.
-
Study on Recovery Strategy of Hearing Loss & SGN Regeneration Under Physical Regulation.Adv Sci (Weinh). 2025 Feb;12(5):e2410919. doi: 10.1002/advs.202410919. Epub 2024 Dec 23. Adv Sci (Weinh). 2025. PMID: 39716878 Free PMC article. Review.
-
Blue Light-Induced, Dosed Protein Expression of Active BDNF in Human Cells Using the Optogenetic CRY2/CIB System.Biotechnol J. 2024 Dec;19(12):e202400384. doi: 10.1002/biot.202400384. Biotechnol J. 2024. PMID: 39726067 Free PMC article.
-
Infrared light stimulates the cochlea through a mechanical displacement detected and amplified by hair cells.Proc Natl Acad Sci U S A. 2025 Apr 29;122(17):e2422076122. doi: 10.1073/pnas.2422076122. Epub 2025 Apr 24. Proc Natl Acad Sci U S A. 2025. PMID: 40273108
References
-
- Zeng FG, Canlon B. Recognizing the journey and celebrating the achievement of cochlear implants. Hear Res 2015;322:1–3. - PubMed
-
- Clark GM. Personal reflections on the multichannel cochlear implant and a view of the future. J Rehabil Res Dev 2008;45(5):651–693. - PubMed
-
- NIDCD/NIH. Cochlear Implants. Internet; 2017. https://www.nidcd.nih.gov/health/cochlear-implants
-
- Rubinstein JT. How cochlear implants encode speech. Curr Opin Otolaryngol Head Neck Surg 2004;12(5):444–448. - PubMed
Publication types
MeSH terms
Grants and funding
LinkOut - more resources
Full Text Sources
Other Literature Sources
Medical
Miscellaneous

