. 2021 Mar;15(2):478-514.
doi: 10.1177/1932296820978399. Epub 2021 Jan 21.

How to Best Protect People With Diabetes From the Impact of SARS-CoV-2: Report of the International COVID-19 and Diabetes Summit

Affiliations

How to Best Protect People With Diabetes From the Impact of SARS-CoV-2: Report of the International COVID-19 and Diabetes Summit

Jennifer Y Zhang et al. J Diabetes Sci Technol. 2021 Mar.

Abstract

The coronavirus disease 2019 (COVID-19) pandemic caused by the severe acute respiratory syndrome coronavirus 2 (SARS-CoV-2) virus has rapidly involved the entire world and exposed the pressing need for collaboration between public health and other stakeholders from the clinical, scientific, regulatory, pharmaceutical, and medical device and technology communities. To discuss how to best protect people with diabetes from serious outcomes from COVID-19, Diabetes Technology Society, in collaboration with Sansum Diabetes Research Institute, hosted the "International COVID-19 and Diabetes Virtual Summit" on August 26-27, 2020. This unique, unprecedented real-time conference brought together physicians, scientists, government officials, regulatory experts, industry representatives, and people with diabetes from six continents to review and analyze relationships between COVID-19 and diabetes. Over 800 attendees logged in. The summit consisted of five sessions: (I) Keynotes, (II) Preparedness, (III) Response, (IV) Recovery, and (V) Surveillance; eight parts: (A) Background, (B) Resilience, (C) Outpatient Care, (D) Inpatient Care, (E) Resources, (F) High-Risk Groups, (G) Regulation, and (H) The Future; and 24 sections: (1) Historic Pandemics and Impact on Society, (2) Pathophysiology/Risk Factors for COVID-19, (3) Social Determinants of COVID-19, (4) Preparing for the Future, (5) Medications and Vaccines, (6) Psychology of Patients and Caregivers, (7) Outpatient Treatment of Diabetes Mellitus and Non-Pharmacologic Intervention, (8) Technology and Telehealth for Diabetes Outpatients, (9) Technology for Inpatients, (10) Management of Diabetes Inpatients with COVID-19, (11) Ethics, (12) Accuracy of Diagnostic Tests, (13) Children, (14) Pregnancy, (15) Economics of Care for COVID-19, (16) Role of Industry, (17) Protection of Healthcare Workers, (18) People with Diabetes, (19) International Responses to COVID-19, (20) Government Policy, (21) Regulation of Tests and Treatments, (22) Digital Health Technology, (23) Big Data Statistics, and 24) Patient Surveillance and Privacy. The two keynote speeches were entitled (1) COVID-19 and Diabetes-Meeting the Challenge and (2) Knowledge Gaps and Research Opportunities for Diabetes and COVID-19. While there was an emphasis on diabetes and its interactions with COVID-19, the panelists also discussed the COVID-19 pandemic in general. The meeting generated many novel ideas for collaboration between experts in medicine, science, government, and industry to develop new technologies and disease treatment paradigms to fight this global pandemic.

Keywords: COVID-19; diabetes; digital health; pandemic; telehealth.


Conflict of interest statement

Declaration of Conflicting Interests: The author(s) declared the following potential conflicts of interest with respect to the research, authorship, and/or publication of this article: Jennifer Y. Zhang, Trisha Shang, Kong Chen, Bithika Thompson, and Lauren E. Wisk have nothing of interest to disclose. David Ahn has served as a consultant, advisory board member, or speaker for Ascensia, Eli Lilly, and Senseonics. Gerard Coté is the founder of BioTex Inc. and Base Pair Technologies, Inc. Juan Espinoza’s efforts were supported by the Food and Drug Administration under award number P50FD006425 for The West Coast Consortium for Technology & Innovation in Pediatrics. The funding source had no involvement in the development of this manuscript or in the decision to submit the paper for publication. The content is solely the responsibility of the authors and does not necessarily represent the official views of the FDA. Elias K. Spanakis was partially supported by the Veterans Affairs (VA) MERIT award (#1I01CX001825) from the United States Department of Veterans Affairs Clinical Sciences Research and Development Service. EKS has received unrestricted research support from Dexcom (to Baltimore VA Medical Center and to University of Maryland) for the conduction of clinical trials. Amisha Wallia has received research funding from Novo Nordisk and research support from Eli Lilly and the UnitedHealth Group. Carlos E. Mendez serves on the Medical Advisory Board for Monarch Medical Technologies (EndoTool). David Kerr is a consultant for Sanofi, Novo Nordisk, and Glooko, and has received research support from Abbott Diabetes Care and Eli Lilly. David C. Klonoff is a consultant for Dexcom, EOFlow, Fractyl, Lifecare, Novo Nordisk, Roche Diagnostics, Samsung, and Thirdwayv.

Figures

Figure 1.
Figure 1.
A map of the countries (in green) where Summit participants were based. Participants were from Africa, Asia, Australia, Europe, North America, and South America and were based in Australia, Chile, Denmark, Germany, Japan, Norway, Rwanda, South Korea, the United Kingdom (UK), and the United States of America (USA). Figure adapted from “Planisphère (Projection Mercator), 2015.”
Figure 2.
Figure 2.
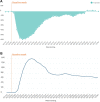
The mean weekly mortality rate during 2017-2019 (prior to the COVID-19 pandemic), compared to the weekly mortality rate during 2020 (the first year of the COVID-19 pandemic), during the first 19 weeks of these two time periods in the UK for people with T1D and T2D. The x axis shows the number of full weeks following the beginning of the two time periods. Colored lines indicate mean total weekly death rates during the period 2017-2019 (red line), total weekly death rates in 2020 (green line), and weekly death rates not related to COVID-19 in 2020 (blue line). The gray shadow represents deaths related to COVID-19 during 2020. (a) The weekly mortality rate (on the y axis) of people with T1D. (b) The weekly mortality rate (on the y axis) of people with T2D. Abbreviations: COVID-19, coronavirus disease 2019; T1D, type 1 diabetes; T2D, type 2 diabetes.
Figure 3.
Figure 3.
Mortality for patients in the UK with COVID-19 and diabetes, stratified according to T1D, T2D, or no diabetes. Abbreviations: COVID-19, coronavirus disease 2019; T1D, type 1 diabetes; T2D, type 2 diabetes.
Figure 4.
Figure 4.
The correlation between BMI and poor clinical outcomes. (a) The correlation between BMI and requirement for mechanical ventilation for patients with COVID-19. Adapted with permission from ‘High Prevalence of Obesity in Severe Acute Respiratory Syndrome Coronavirus-2 (SARS-CoV-2) Requiring Invasive Mechanical Ventilation’. (b) The association between BMI and mortality due to COVID-19. Adapted with permission from ‘Association of Body mass index (BMI) with Critical COVID-19 and In-hospital Mortality: a dose-response meta-analysis’. Abbreviations: BMI, body mass index; COVID-19, coronavirus disease 2019.
Figure 5.
Figure 5.
Conditions that increase the risk of hospitalization for COVID-19 patients. According to the Centers for Disease Control and Prevention (CDC) COVID-19 Digital Resources website as of August 27, 2020, there is increased risk for hospitalization from contracting COVID-19 for individuals with various conditions, including (1) asthma, (2) hypertension, (3) obesity, (4) diabetes, (5) chronic kidney disease, (6) severe obesity, (7) two conditions, and (8) three or more conditions. These conditions consist of the previously listed first six conditions (but not hypertension), and three additional conditions, including coronary artery disease, history of stroke, and COPD. Abbreviations: COPD, chronic obstructive pulmonary disease; COVID-19, coronavirus disease 2019.
Figure 6.
Figure 6.
The number of COVID-19 cases and deaths from COVID-19 reported weekly in each of the six regions recognized by the WHO, according to figures from that organization. The graph covers December 30, 2019 to August 31, 2020. Abbreviation: COVID-19: coronavirus disease 2019.
Figure 7.
Figure 7.
A landscape of SARS-CoV-2 vaccine development according to WHO, as of August 20, 2020. Figure provided by David C. Kaslow, MD, PATH Essential Medicines. Adapted from WHO landscape of SARS-CoV-2 candidate vaccines.
Figure 8.
Figure 8.
The increased amounts of data that patients track using various smart devices compared to the patient data that doctors have access to. Figure provided by Eirik Årsand, PhD, The UiT Arctic University of Norway. Adapted from Bradway/Årsand, Norway 2020.
Figure 9.
Figure 9.
(a) An image and (b) a magnified image of a glucose telemetry system. Images were taken at the Baltimore VA Medical Center and provided by Elias K. Spanakis, MD, University of Maryland School of Medicine.
Figure 10.
Figure 10.
The viral structure of SARS-CoV-2 and three diagnostic targets is illustrated, including the (a) spike protein, (b) envelope protein, and (c) nucleocapsid protein. Blue antibodies targeting nucleocapsid and spike proteins are those produced by the patient, and yellow labeled antibodies are detection antibodies used for serology assays. Figure provided by Nam Tran, PhD, HCLD (ABB), FAACC, University of California, Davis.
Figure 11.
Figure 11.
The total number of outpatient visits and the percentage of these visits that were by telemedicine since the beginning of the pandemic. (a) A graph of the percent change in the number of outpatient visits (compared to baseline) from March 1, 2020 through October 4, 2020. Dates are on the x axis, and the percent increase or decrease in the number of visits is on the y axis. (b) A graph showing the proportion (as a percentage) of total outpatient visits using telemedicine in the USA each week from March 1, 2020 through October 4, 2020. The axes in (a) and (b) have the same units. Figures adapted from “The Impact of the COVID-19 Pandemic on Outpatient Care: Visits Return to Prepandemic Levels, but Not for All Providers and Patients.”
Figure 12.
Figure 12.
A hierarchy of five controls to mitigate or eliminate hazards, such as COVID-19, according to NIOSH. Control methods at the top of the figure are potentially more effective and protective than methods at the bottom. Abbreviations: COVID-19: coronavirus disease 2019; NIOSH: National Institute for Occupational Safety and Health.
Figure 13.
Figure 13.
A sign in Sydney, Australia, asking people to socially distance from others. Image from James D. Morgan, Getty Images.
Figure 14.
Figure 14.
Sanitizers for disinfection that are located at the entrance to a hospital in Tokyo, Japan. All patients are asked to use them when they enter and leave the hospital. Image provided by Kayo Waki, MD, MPH, PhD, The University of Tokyo.
Figure 15.
Figure 15.
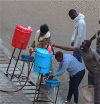
People in Rwanda using outdoor hand-washing stations. Image provided by Laurien Sibomana, MS, Rwandan Diabetes Association.
Figure 16.
Figure 16.
(a) A wearable trachea sound sensor attached to the throat. (b) A diagram of the internal and external components of the trachea sensor. The wearable trachea sensor and related smartphone software application are being developed by RTM Vital Signs, LLC (Philadelphia, PA) in collaboration with Thomas Jefferson University. Image and figure provided by Jeffrey Joseph, DO, Thomas Jefferson University.
Figure 17.
Figure 17.
A map of geographic access as measured by the shortest travel time from a 1 km2 region to the nearest SARS-CoV-2 testing site in the USA as of May 2020. Methods as per Rader et al, 2020 Journal of Travel Medicine. A total of 6236 testing sites were identified and used to generate this map. Figure provided by Christina M. Astley, MD, ScD, Boston Children’s Hospital, Harvard University and Benjamin Rader, MPH, Boston Children’s Hospital, Boston University.
Figure 18.
Figure 18.
Mobile applications designed to screen for COVID-19. (a) The COVID-19 Symptom Study mobile app on a smartphone. To the right of the smartphone, QR codes are included that allow scanners to download the application through their appropriate application stores. This project, designed to capture COVID-19 symptoms and health patterns in the general public, was developed as an academic-industry collaboration between Massachusetts General Hospital, King’s College London, and ZOE Global Limited. Figure provided by David A. Drew, PhD, Massachusetts General Hospital, Harvard Medical School. (b) Vanderbilt’s mobile platform for virtual COVID-19 screening. This screening tool was created through collaboration between T.S. Harvey and Thomas Scherr from Vanderbilt University. Figure provided by T.S. Harvey, PhD, Vanderbilt University. Abbreviation: COVID-19: coronavirus diseases 2019.

References

    1. Yuen K-S, Ye Z-W, Fung S-Y, Chan C-P, Jin D-Y. SARS-CoV-2 and COVID-19: the most important research questions. Cell Biosci. 2020;10:40. - PMC - PubMed
    1. Apicella M, Campopiano MC, Mantuano M, Mazoni L, Coppelli A, Del Prato S. COVID-19 in people with diabetes: understanding the reasons for worse outcomes. Lancet Diabetes Endocrinol. 2020;8(9):782-792. - PMC - PubMed
    1. Planisphère (Projection Mercator), 2015. Sciences Po Map Library. http://cartotheque.sciences-po.fr/media/Planisphere_projection_Bertin_19.... Accessed November 12, 2020.
    1. What is telehealth? How is telehealth different from telemedicine? Health.gov. 2019. https://www.healthit.gov/faq/what-telehealth-how-telehealth-different-te.... Accessed November 2, 2020.
    1. Zhu L, She Z-G, Cheng X, et al. Association of blood glucose control and outcomes in patients with COVID-19 and pre-existing type 2 diabetes. Cell Metab. 2020;31(6):1068-1077.e3. - PMC - PubMed