. 2021 Mar 15;32(6):475-491.
doi: 10.1091/mbc.E20-06-0390. Epub 2021 Jan 21.

The TIM22 complex mediates the import of sideroflexins and is required for efficient mitochondrial one-carbon metabolism

Affiliations

The TIM22 complex mediates the import of sideroflexins and is required for efficient mitochondrial one-carbon metabolism

Thomas D Jackson et al. Mol Biol Cell. .

Abstract

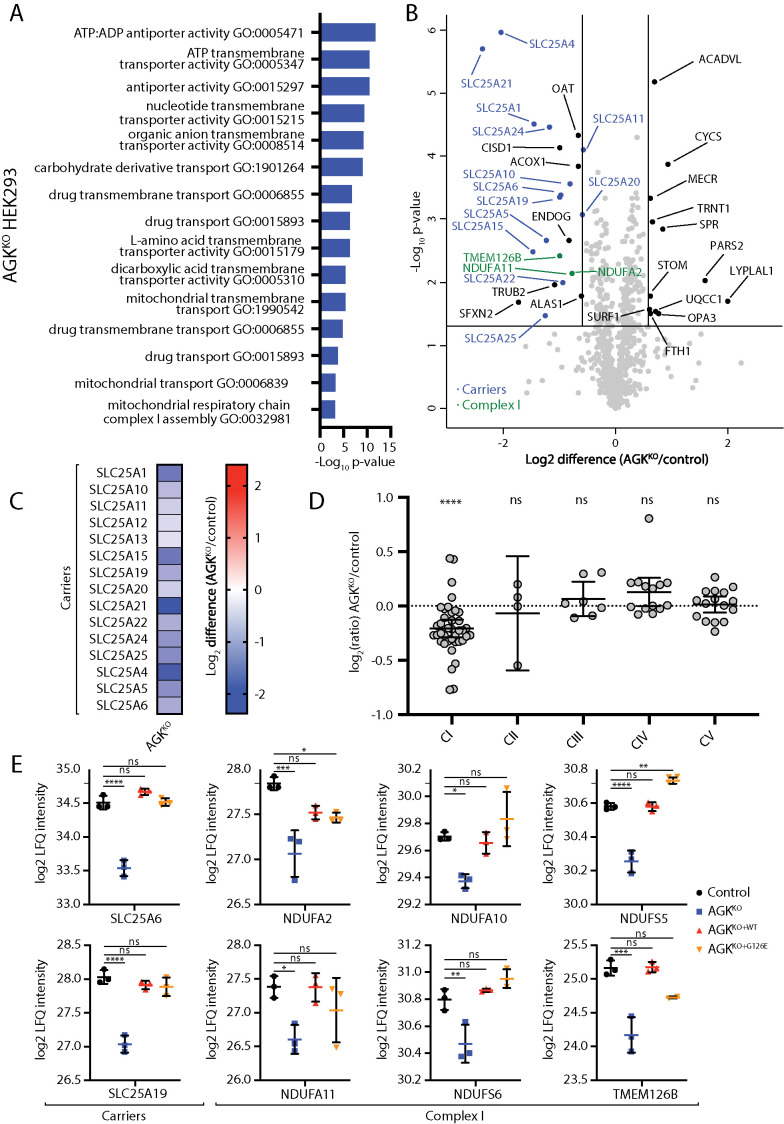
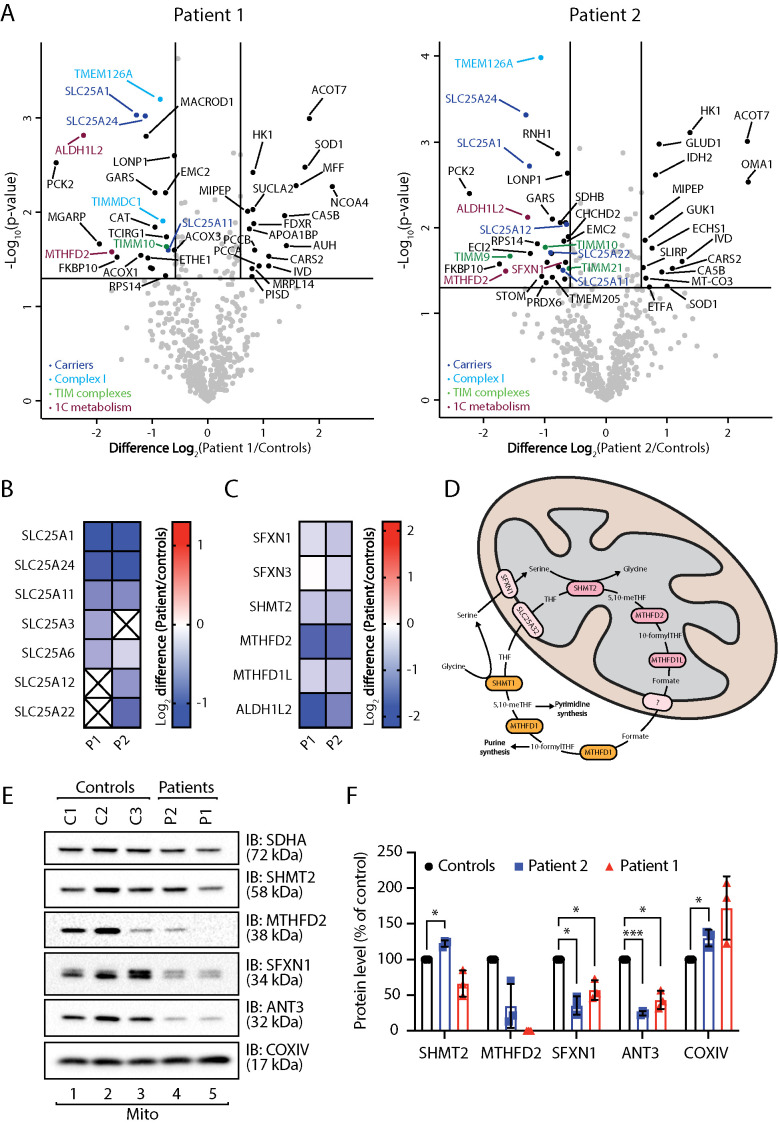
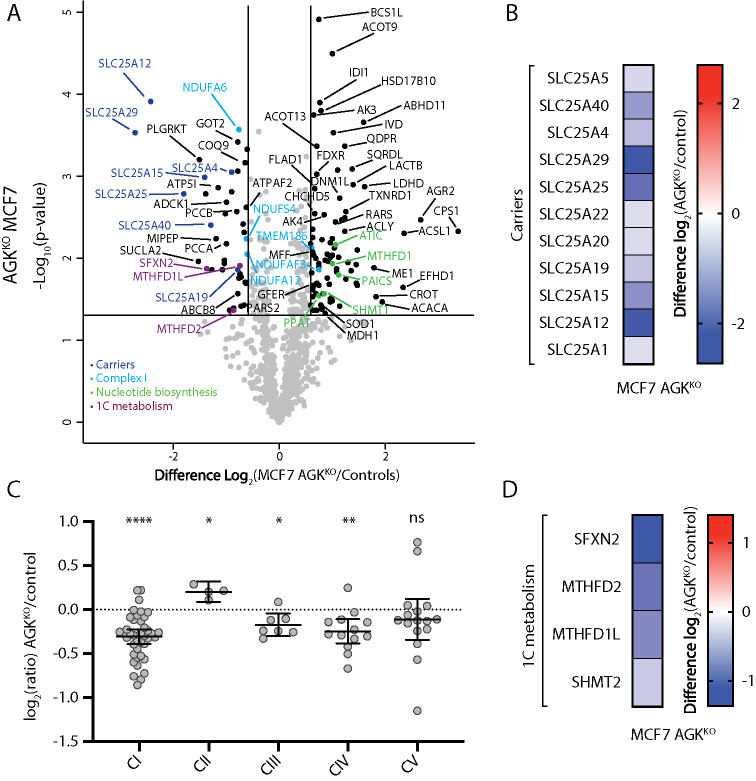
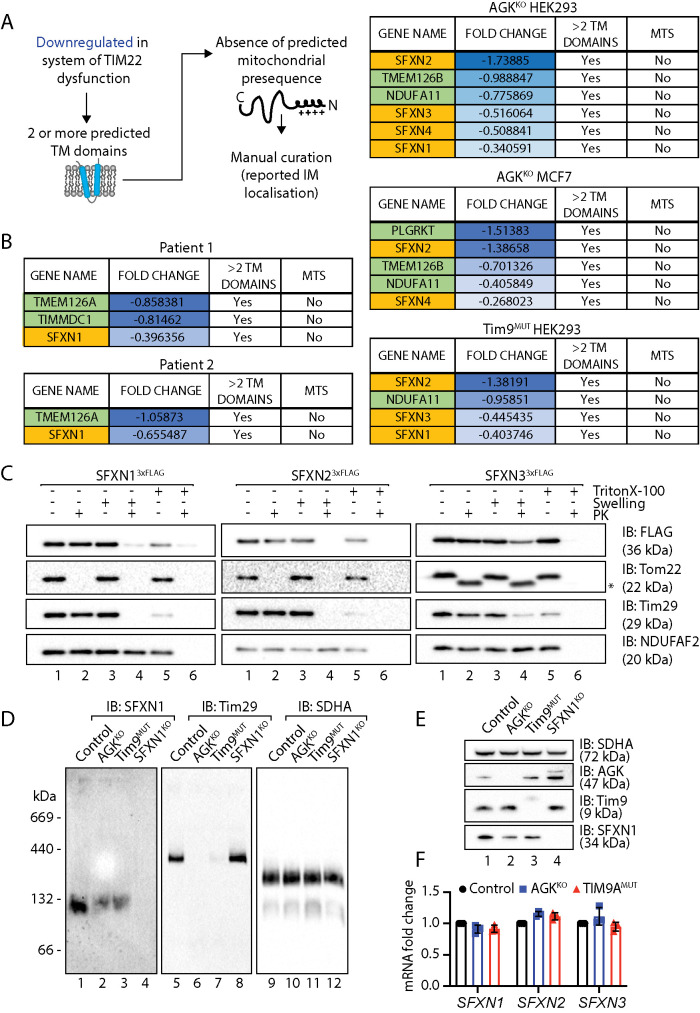
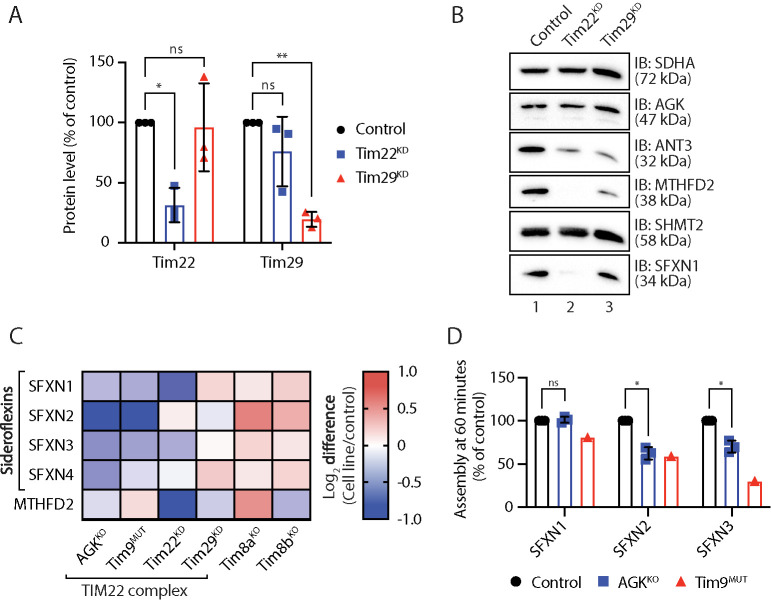
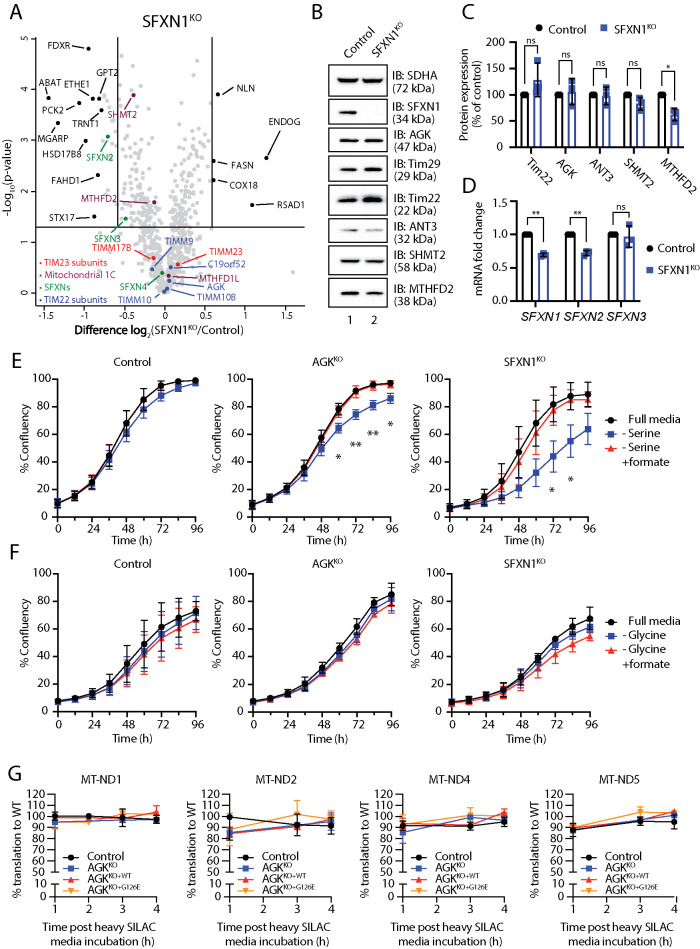
Acylglycerol kinase (AGK) is a mitochondrial lipid kinase that contributes to protein biogenesis as a subunit of the TIM22 complex at the inner mitochondrial membrane. Mutations in AGK cause Sengers syndrome, an autosomal recessive condition characterized by congenital cataracts, hypertrophic cardiomyopathy, skeletal myopathy, and lactic acidosis. We mapped the proteomic changes in Sengers patient fibroblasts and AGKKO cell lines to understand the effects of AGK dysfunction on mitochondria. This uncovered down-regulation of a number of proteins at the inner mitochondrial membrane, including many SLC25 carrier family proteins, which are predicted substrates of the complex. We also observed down-regulation of SFXN proteins, which contain five transmembrane domains, and show that they represent a novel class of TIM22 complex substrate. Perturbed biogenesis of SFXN proteins in cells lacking AGK reduces the proliferative capabilities of these cells in the absence of exogenous serine, suggesting that dysregulation of one-carbon metabolism is a molecular feature in the biology of Sengers syndrome.


Figures

FIGURE 1:
FIGURE 1:
Proteomic characterization of an AGKKO HEK293 cell line. (A–D) Mitochondria were isolated from control and AGKKO HEK cells and subjected to label-free quantitative mass spectrometric analysis. (A) Gene Ontology (GO) enrichment analysis was performed for all proteins up-regulated or down-regulated >1.5-fold with p < 0.05. Significantly enriched GO terms are displayed, ranked by the p value associated with the term. Terms are associated with genes that have reduced abundance in AGKKO cells. (B) Volcano plot depicting the relative levels of proteins in AGKKO mitochondria compared with control HEK293. n = 3 biological replicates. The horizontal cutoff represents a p value of 0.05, while the vertical cutoffs represent 1.5-fold up- or down-regulation. SLC25 (carrier) family members (dark blue) and Complex I subunits (green) are indicated. (C) Log2 fold-change values (as compared with control) with p < 0.05 are depicted for SLC25 proteins in the AGKKO HEK293 cells. (D) Relative abundance of respiratory chain complexes (Complexes I–V) in AGKKO HEK293 cells as compared with control. Mean ± 95% CI is depicted. ****, p < 0.0001. (E) Log2-transformed LFQ values were determined for the indicated proteins from control, AGKKO, AGKKO+WT, and AGKKO+G126E HEK293 cells. Mean ± SD is depicted (n = 3). Statistical significance was determined using a one-way analysis of variance and Dunnett’s multiple comparisons test: *, p < 0.05, **, p < 0.01, ***, p < 0.001, ****, p < 0.0001.
FIGURE 2:
FIGURE 2:
Proteomic characterization of Sengers syndrome patient fibroblasts. (A, B) Mitochondria isolated from three independent control fibroblast cell lines and two Sengers patient fibroblast cell lines (Patient 1 [P1] and Patient 2 [P2]) were subjected to label-free mass spectrometric analysis. (A) Volcano plots depicting the relative levels of proteins in Sengers patient mitochondria compared with the averaged control data set. Significantly altered proteins are located outside the lines (p value: <0.05, fold change: >1.5× up or down). SLC25 members (dark blue), Complex I subunits or assembly factors (light blue), TIM complex subunits (green), and 1C metabolism proteins (plum) are indicated. (B) Log2 fold-change values (as compared with controls) with p < 0.05 are depicted for SLC25 family proteins in both patient fibroblast cell lines. (C) Log2 fold-change values (as compared with controls) are depicted for 1C metabolism proteins in both patient fibroblast cell lines. (D) Schematic depiction of 1C metabolism. 1C metabolism is a series of parallel and reversible reactions occurring in the mitochondria and the cytosol. In proliferating cells, the reaction proceeds such that formate is produced in the mitochondria and exported to the cytosol for use in biosynthetic reactions. (E) Mitochondrial lysates from control, Sengers syndrome Patient 1 and Patient 2 fibroblasts were analyzed by SDS–PAGE and Western blotting with the indicated antibodies. (F) The relative level of each protein was quantified and is represented as the mean ± SD (n = 3). One sample t test: *, p < 0.05, ***, p < 0.001.
FIGURE 3:
FIGURE 3:
Proteomic characterization of an AGKKO MCF7 cell line. (A) Mitochondria isolated from control and AGKKO MCF7 cells were subjected to label-free mass spectrometric analysis (n = 3). The volcano plot depicts the relative levels of proteins in AGKKO MCF7 mitochondria compared with control. Significantly altered proteins are located outside the lines (p value: <0.05, fold change: >1.5× up or down). SLC25 members (dark blue), Complex I subunits or assembly factors (light blue), nucleotide biosynthesis enzymes (green), and 1C metabolism proteins (plum) are indicated. (B) Log2 fold-change values (as compared with control) are depicted for SLC25 proteins (p < 0.05) identified in the AGKKO MCF7 cells. (C) Relative abundance of respiratory chain complexes (complexes I–V) in AGKKO MCF7 cells as compared with control. Mean ± 95% CI is depicted. Ratio paired t test: *, p < 0.05, **, p < 0.05, ***, p < 0.001, ****, p < 0.0001 (n = 3). (D) Log2 fold-change values (as compared with control) for 1C metabolism proteins (p < 0.05) identified in the AGKKO MCF7 cells.
FIGURE 4:
FIGURE 4:
Identification of TIM22 complex substrates. (A) Schematic representation of the parameters used to filter proteins from proteomic data sets to screen for novel TIM22 substrates. (B) Candidate TIM22 substrates identified following the pipeline in A in the indicated cell lines. SFXNs are highlighted in yellow. (C) Mitochondria were isolated from HEK293 cells stably expressing SFXN13xFLAG or SFXN23xFLAG or from HEK293 cells transiently transfected with SFXN33xFLAG. Intact mitochondria, mitoplasts (generated by hypoosmotic swelling of the outer membrane) or solubilized mitochondria were treated with or without proteinase K and analyzed by SDS–PAGE and Western blotting with the indicated antibodies. * indicates a proteolytic fragment of Tom22 sometimes detected due to incomplete proteolytic processing. (D) Mitochondria isolated from control, AGKKO, Tim9MUT, and SFXN1KO HEK293 cells were solubilized in 1% digitonin containing buffer and analyzed by BN-PAGE and immunoblotting with the indicated antibodies. (E) Mitochondrial lysates from control, AGKKO, Tim9MUT, and SFXN1KO HEK293 cells were analyzed by SDS–PAGE and Western blotting with the indicated antibodies. (F) Fold changes in mRNA expression for SFXN1, SFXN2, and SFXN3 in AGKKO and Tim9MUT HEK293 compared with control HEK293 cells were quantified by RT-qPCR and are expressed as mean ± SD (n = 3).
FIGURE 5:
FIGURE 5:
Sideroflexins require the TIM22 complex for their biogenesis. (A) Mitochondrial lysates from triplicate sets of control, Tim22 knockdown (KD), and Tim29 KD HEK293 cells were analyzed by SDS–PAGE and Western blotting with antibodies specific for Tim22, Tim29, and SDHA (loading control). Levels of Tim22 and Tim29 were quantified and tabulated as mean ± SD (n = 3). One-sample t test: *, p < 0.05, **, p < 0.01. (B) Mitochondrial lysates from control, Tim22 KD, and Tim29 KD HEK293 cells were analyzed by SDS–PAGE and Western blotting. (C) Log2 fold-change values (as compared with respective controls) are depicted for selected proteins in the indicated cell lines. (D) [35S]-SFXN1, [35S]-SFXN2, and [35S]-SFXN3 were incubated with mitochondria isolated from control, AGKKO, and Tim9MUT HEK293 cells for 60 min before proteinase K (PK) treatment. Samples were solubilized in 1% digitonin containing buffer and analyzed by BN-PAGE and autoradiography. Assembled protein at 60 min in control, AGKKO, and Tim9MUT mitochondria was quantified. Graph depicts mean ± SD (n = 3 for AGKKO, n = 1 for Tim9MUT). One-sample t test: *, p < 0.05.
FIGURE 6:
FIGURE 6:
Loss of AGK limits cell proliferation in the absence of exogenous serine. (A) Mitochondria isolated from control and SFXN1KO HEK293 cells were subjected to label-free quantitative mass spectrometric analysis. Volcano plots depict the relative levels of mitochondrial proteins in each sample compared with control. n = 3 biological replicates. Horizontal cutoff represents p = 0.05 and vertical cutoffs represent – and + 1.5× fold change. TIM23 complex subunits (red), TIM22 complex subunits (blue), SFXN proteins (green), and 1C metabolism enzymes (plum) are indicated. (B) Mitochondrial lysates from control and SFXN1KO HEK293 cells were analyzed by SDS–PAGE and Western blotting. (C) Relative protein levels of selected proteins were quantified and are represented as mean ± SD (n = 3). One-sample t test: * p < 0.05. (D) Relative fold changes of mRNA expression for SFXN1, SFXN2, and SFXN3 in control and SFXN1KO HEK293 cells were determined using RT-qPCR and are represented as the mean ± SD (n = 3). One-sample t test: *, p < 0.05, **, p < 0.01. (E) Proliferation of control, AGKKO, and SFXN1KO HEK293 cells was monitored in complete media, serine-free media, and serine-free media supplemented with 1 mM formate. Confluency was measured at 12-h intervals and is depicted as mean ± SD (n = 4). Unpaired t test, * p < 0.05, ** p < 0.01. (F) Proliferation of control, AGKKO, and SFXN1KO HEK293 cells was monitored in complete media, glycine-free media, and glycine-free media supplemented with 1 mM formate. Confluency was measured at 12-h intervals and is depicted as mean ± SD (n = 3). (G) Pulse SILAC analysis of newly translated mtDNA-encoded OXPHOS subunits. SILAC media was added following 24 h treatment with chloramphenicol and analysis was performed at 1, 3, and 4 h post-SILAC media incubation. Log2-transformed heavy-peptide derived intensities are plotted relative to control. Statistical analysis was performed on each time point (n = 3) compared with control WT using a t test and FDR-1% with no significance recorded. Data are depicted as mean ± SD.

References

    1. Acín-Pérez R, Fernández-Silva P, Peleato ML, Pérez-Martos A, Enriquez JA (2008). Respiratory active mitochondrial supercomplexes. Mol Cell 32, 529–539. - PubMed
    1. Anderson AJ, Jackson TD, Stroud DA, Stojanovski D (2019). Mitochondria—hubs for regulating cellular biochemistry: emerging concepts and networks. Open Biol 9, 190126. - PMC - PubMed
    1. Bao XR, Ong SE, Goldberger O, Peng J, Sharma R, Thompson DA, Vafai SB, Cox AG, Marutani E, Ichinose F, et al. (2016). Mitochondrial dysfunction remodels one-carbon metabolism in human cells. eLife 6, e10575. - PMC - PubMed
    1. Bektas M, Payne SG, Liu H, Goparaju S, Milstien S, Spiegel S (2005). A novel acylglycerol kinase that produces lysophosphatidic acid modulates cross talk with EGFR in prostate cancer cells. J Cell Biol 169, 801–811. - PMC - PubMed
    1. Benjamini Y, Abba MK, Daniel Y (2006). Adaptive linear step-up procedures that control the false discovery rate. Biometrika 93, 491–507.

Publication types

MeSH terms

Substances

LinkOut - more resources