

A Machine Learning Prediction Model of Respiratory Failure Within 48 Hours of Patient Admission for COVID-19: Model Development and Validation
- PMID: 33476281
- PMCID: PMC7879728
- DOI: 10.2196/24246
A Machine Learning Prediction Model of Respiratory Failure Within 48 Hours of Patient Admission for COVID-19: Model Development and Validation
Abstract
Background: Predicting early respiratory failure due to COVID-19 can help triage patients to higher levels of care, allocate scarce resources, and reduce morbidity and mortality by appropriately monitoring and treating the patients at greatest risk for deterioration. Given the complexity of COVID-19, machine learning approaches may support clinical decision making for patients with this disease.
Objective: Our objective is to derive a machine learning model that predicts respiratory failure within 48 hours of admission based on data from the emergency department.
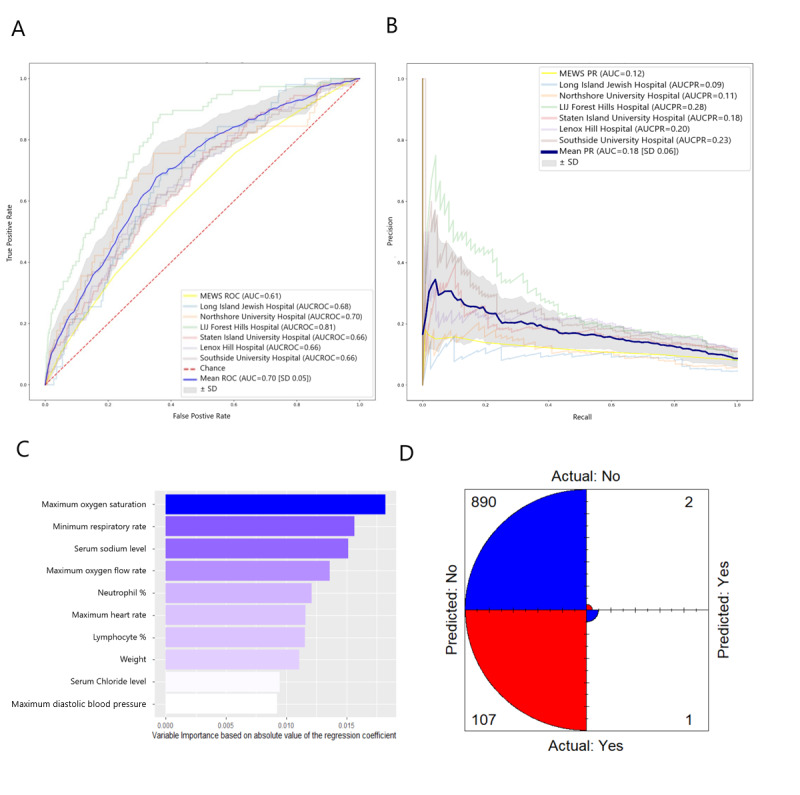
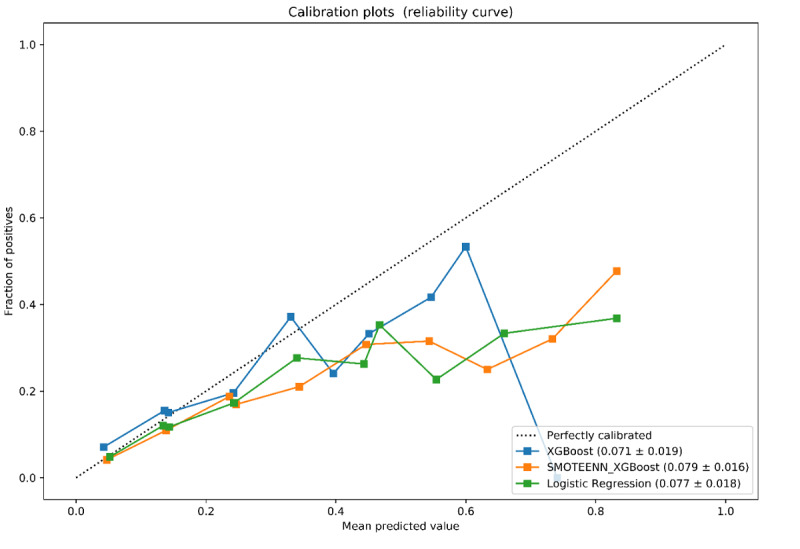
Methods: Data were collected from patients with COVID-19 who were admitted to Northwell Health acute care hospitals and were discharged, died, or spent a minimum of 48 hours in the hospital between March 1 and May 11, 2020. Of 11,525 patients, 933 (8.1%) were placed on invasive mechanical ventilation within 48 hours of admission. Variables used by the models included clinical and laboratory data commonly collected in the emergency department. We trained and validated three predictive models (two based on XGBoost and one that used logistic regression) using cross-hospital validation. We compared model performance among all three models as well as an established early warning score (Modified Early Warning Score) using receiver operating characteristic curves, precision-recall curves, and other metrics.
Results: The XGBoost model had the highest mean accuracy (0.919; area under the curve=0.77), outperforming the other two models as well as the Modified Early Warning Score. Important predictor variables included the type of oxygen delivery used in the emergency department, patient age, Emergency Severity Index level, respiratory rate, serum lactate, and demographic characteristics.
Conclusions: The XGBoost model had high predictive accuracy, outperforming other early warning scores. The clinical plausibility and predictive ability of XGBoost suggest that the model could be used to predict 48-hour respiratory failure in admitted patients with COVID-19.
Keywords: COVID-19; artificial intelligence; development; machine learning; model; modeling; pandemic; prognostic; severe acute respiratory syndrome coronavirus 2; validation.
©Siavash Bolourani, Max Brenner, Ping Wang, Thomas McGinn, Jamie S Hirsch, Douglas Barnaby, Theodoros P Zanos, Northwell COVID-19 Research Consortium. Originally published in the Journal of Medical Internet Research (http://www.jmir.org), 10.02.2021.
Conflict of interest statement
Conflicts of Interest: None declared.
Figures


References
-
- WHO Director-General's opening remarks at the media briefing on COVID-19 - 11 March 2020. World Health Organization. 2020. Mar 11, [2021-02-01]. https://www.who.int/dg/speeches/detail/who-director-general-s-opening-re....
-
- Coronavirus in the US: Latest Map and Case Count. The New York Times. 2020. Mar 3, [2020-05-08]. https://www.nytimes.com/interactive/2020/us/coronavirus-us-cases.html.
-
- Richardson S, Hirsch J, Narasimhan M, Crawford J, McGinn T, Davidson K, the Northwell COVID-19 Research Consortium. Barnaby D, Becker L, Chelico J, Cohen S, Cookingham J, Coppa K, Diefenbach M, Dominello A, Duer-Hefele J, Falzon L, Gitlin J, Hajizadeh N, Harvin T, Hirschwerk D, Kim E, Kozel Z, Marrast L, Mogavero J, Osorio G, Qiu M, Zanos T. Presenting Characteristics, Comorbidities, and Outcomes Among 5700 Patients Hospitalized With COVID-19 in the New York City Area. JAMA. 2020 May 26;323(20):2052–2059. doi: 10.1001/jama.2020.6775. http://europepmc.org/abstract/MED/32320003 - DOI - PMC - PubMed
-
- Myers L, Parodi S, Escobar G, Liu V. Characteristics of Hospitalized Adults With COVID-19 in an Integrated Health Care System in California. JAMA. 2020 Jun 02;323(21):2195–2198. doi: 10.1001/jama.2020.7202. http://europepmc.org/abstract/MED/32329797 - DOI - PMC - PubMed
-
- Tsertsvadze T, Ezugbaia M, Endeladze M, Ratiani L, Javakhishvili N, Mumladze L, Khotchava M, Janashia M, Zviadadze D, Gopodze L, Gokhelashvili A, Metchurchtlishvili R, Abutidze A, Chkhartishvili N. Characteristics and outcomes of hospitalized adult COVID-19 patients in Georgia. MedRxiv. doi: 10.1101/2020.10.23.20218255. Preprint published online on October 27, 2020. - DOI
Publication types
MeSH terms
Grants and funding
LinkOut - more resources
Full Text Sources
Other Literature Sources
Medical
