. 2021 Jan 21;17(1):e1009190.
doi: 10.1371/journal.ppat.1009190. eCollection 2021 Jan.

Inositol phosphates promote HIV-1 assembly and maturation to facilitate viral spread in human CD4+ T cells

Affiliations

Inositol phosphates promote HIV-1 assembly and maturation to facilitate viral spread in human CD4+ T cells

Gregory A Sowd et al. PLoS Pathog. .

Erratum in

Abstract

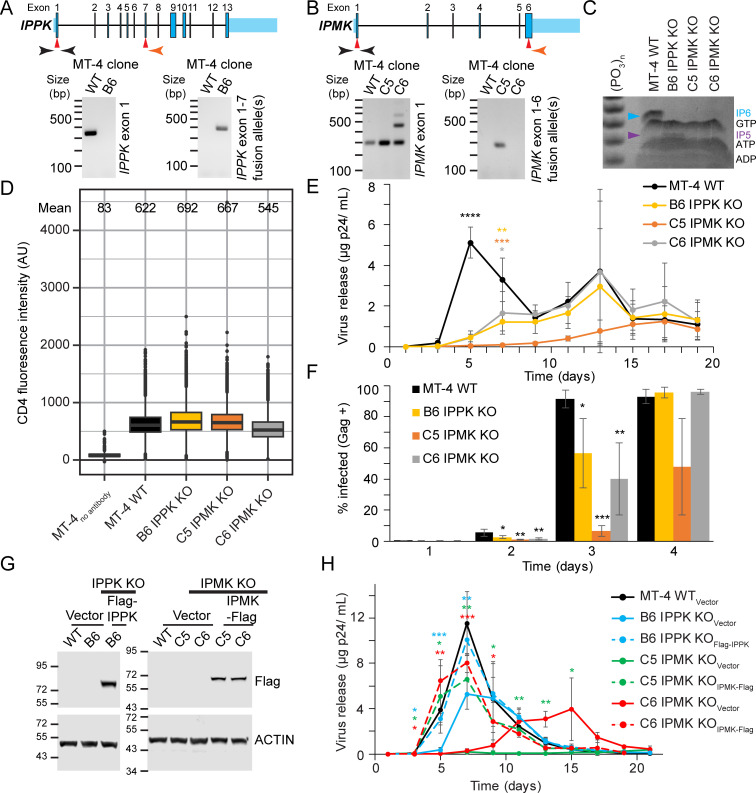
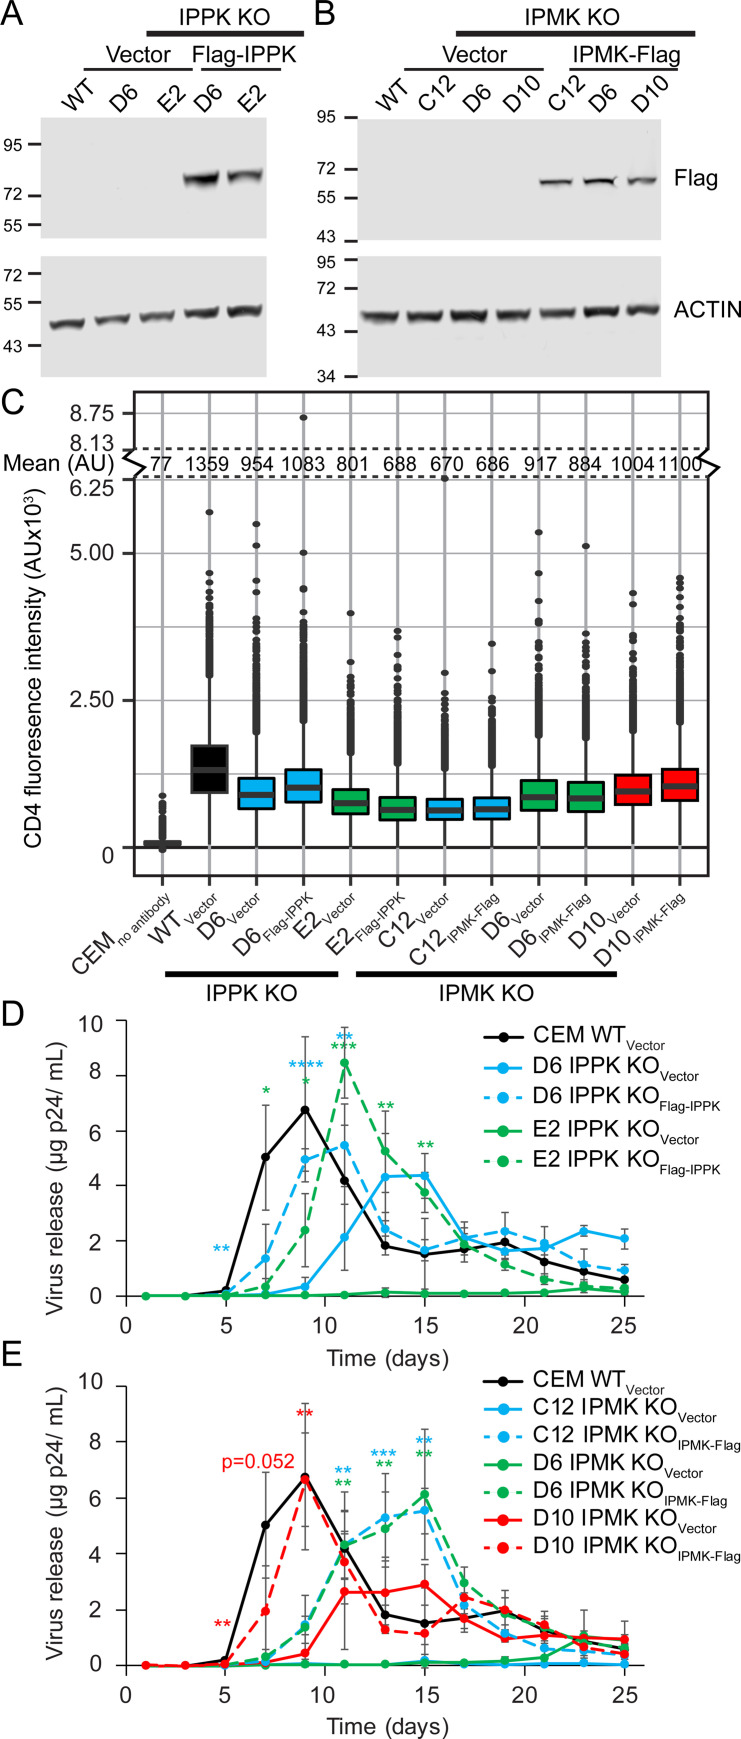
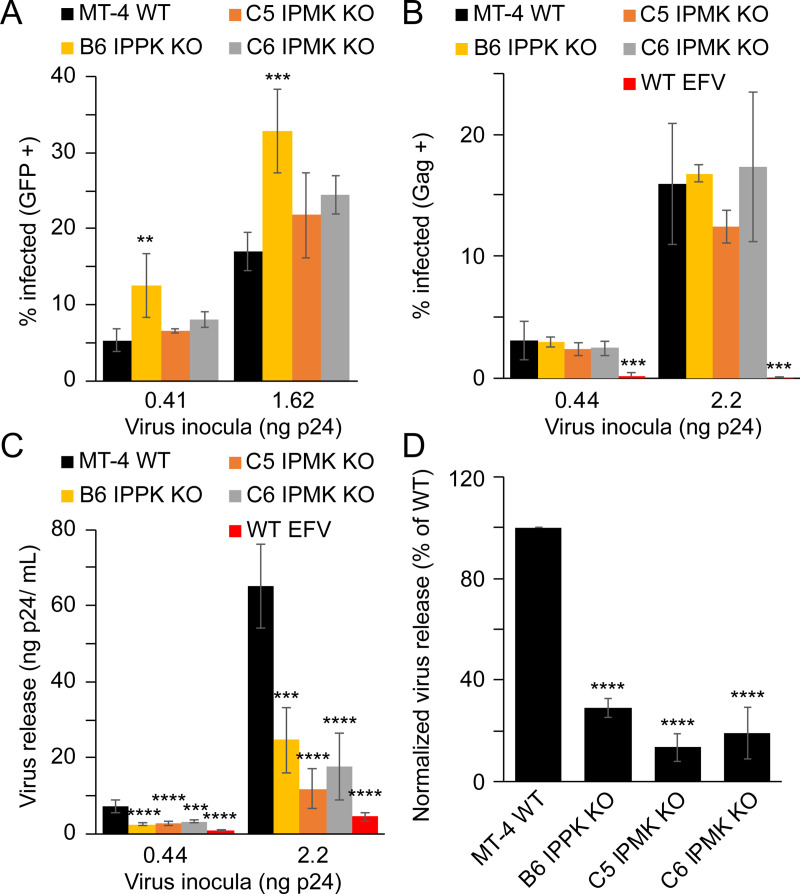
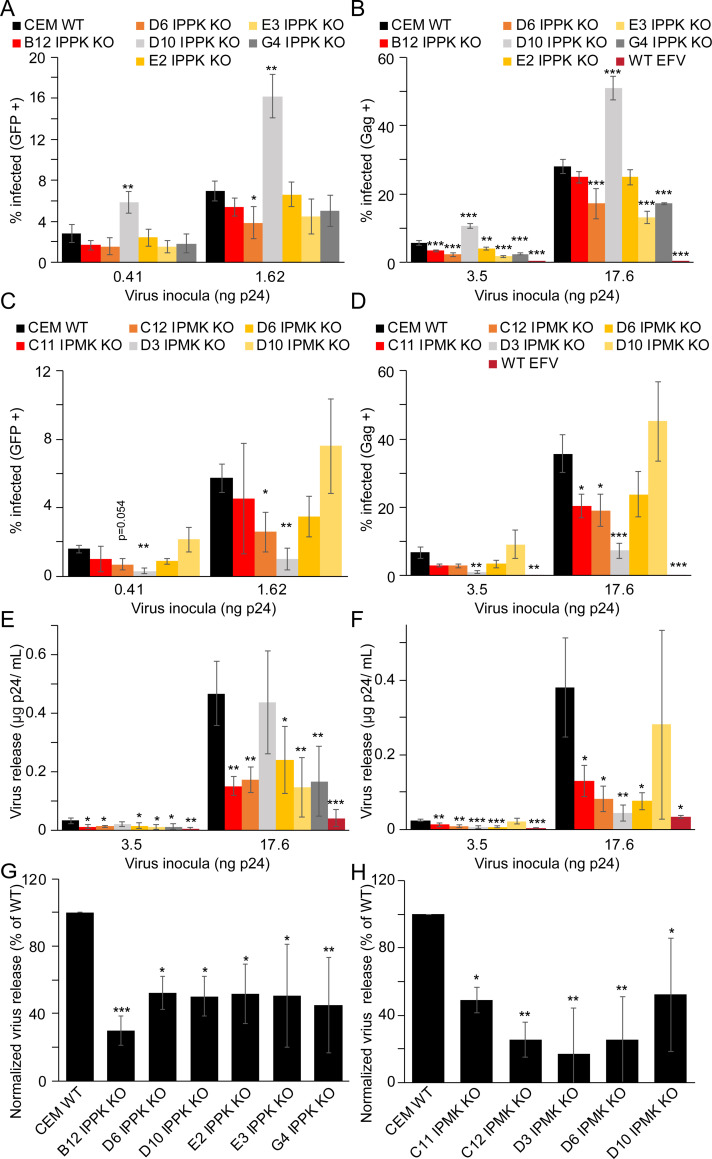
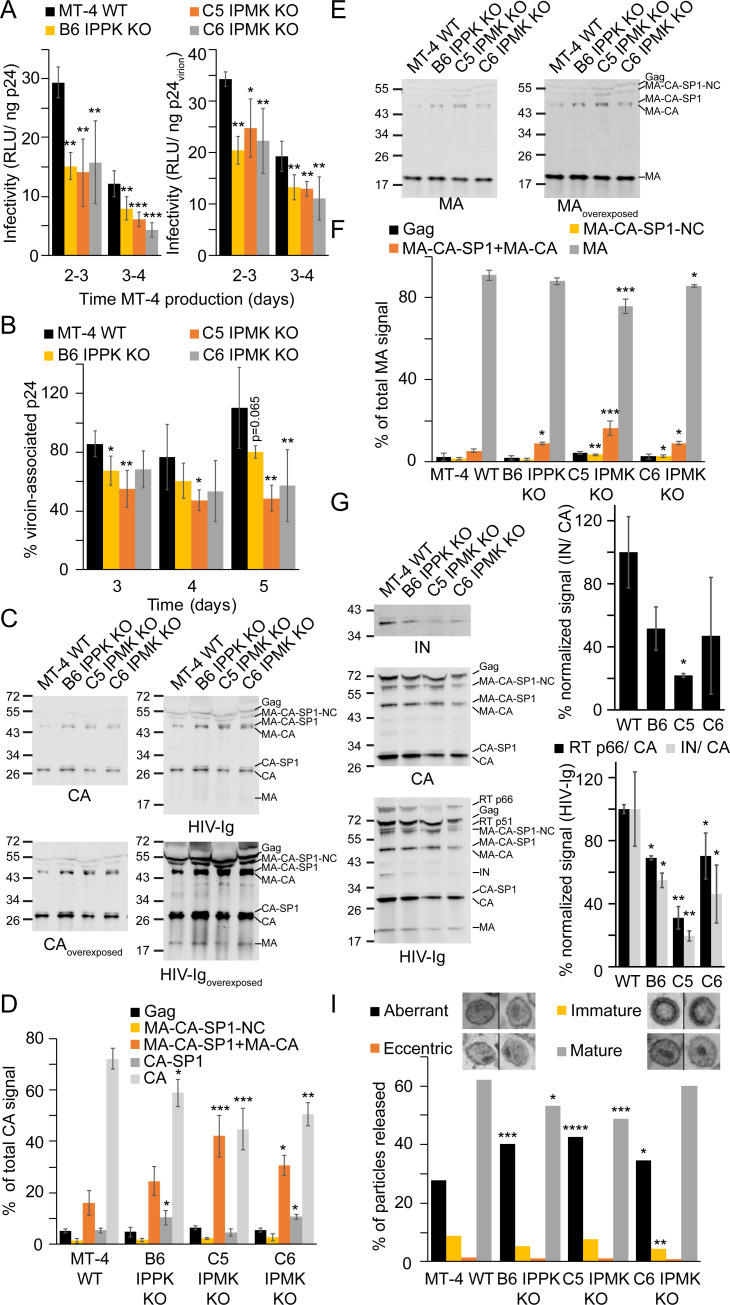
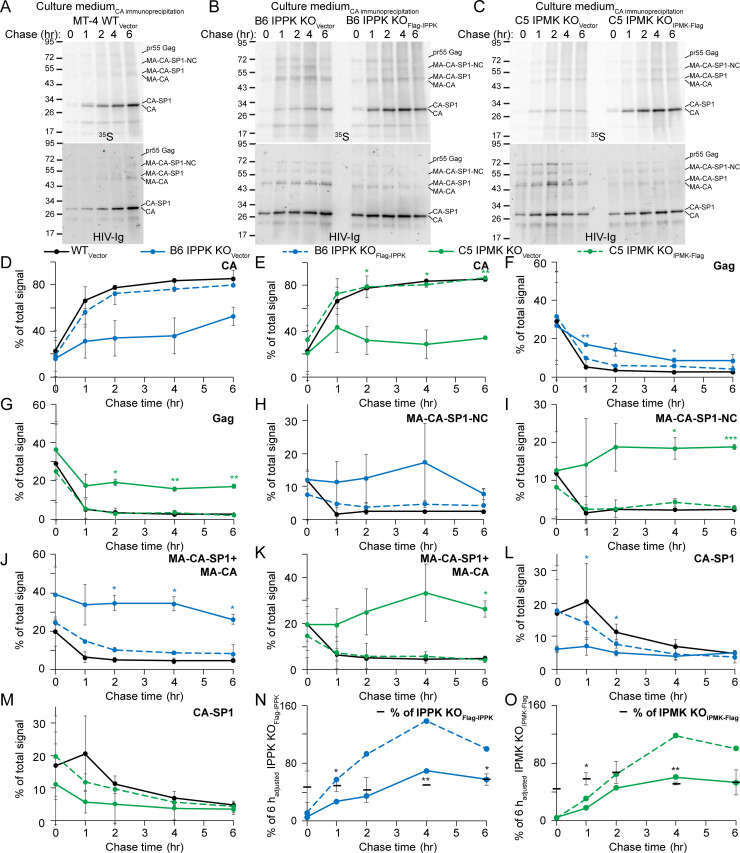
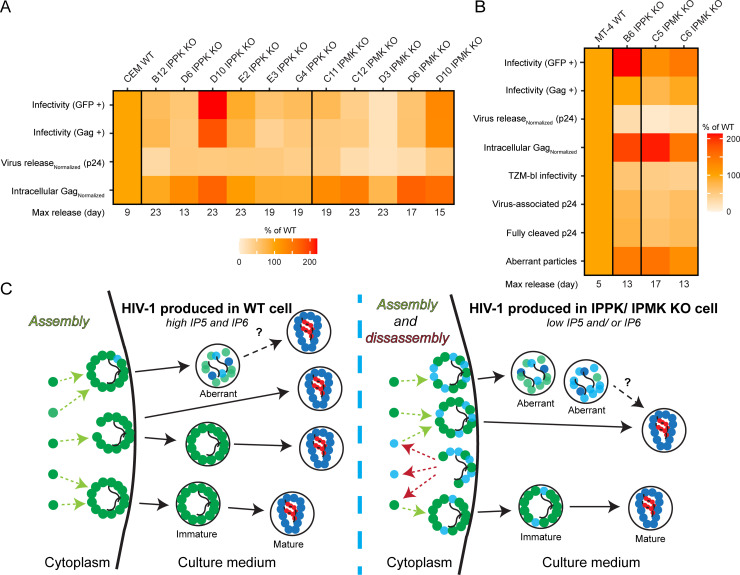
Gag polymerization with viral RNA at the plasma membrane initiates HIV-1 assembly. Assembly processes are inefficient in vitro but are stimulated by inositol (1,3,4,5,6) pentakisphosphate (IP5) and inositol hexakisphosphate (IP6) metabolites. Previous studies have shown that depletion of these inositol phosphate species from HEK293T cells reduced HIV-1 particle production but did not alter the infectivity of the resulting progeny virions. Moreover, HIV-1 substitutions bearing Gag/CA mutations ablating IP6 binding are noninfectious with destabilized viral cores. In this study, we analyzed the effects of cellular depletion of IP5 and IP6 on HIV-1 replication in T cells in which we disrupted the genes encoding the kinases required for IP6 generation, IP5 2-kinase (IPPK) and Inositol Polyphosphate Multikinase (IPMK). Knockout (KO) of IPPK from CEM and MT-4 cells depleted cellular IP6 in both T cell lines, and IPMK disruption reduced the levels of both IP5 and IP6. In the KO lines, HIV-1 spread was delayed relative to parental wild-type (WT) cells and was rescued by complementation. Virus release was decreased in all IPPK or IPMK KO lines relative to WT cells. Infected IPMK KO cells exhibited elevated levels of intracellular Gag protein, indicative of impaired particle assembly. IPMK KO compromised virus production to a greater extent than IPPK KO suggesting that IP5 promotes HIV-1 particle assembly in IPPK KO cells. HIV-1 particles released from infected IPPK or IPMK KO cells were less infectious than those from WT cells. These viruses exhibited partially cleaved Gag proteins, decreased virion-associated p24, and higher frequencies of aberrant particles, indicative of a maturation defect. Our data demonstrate that IP6 enhances the quantity and quality of virions produced from T cells, thereby preventing defects in HIV-1 replication.


Conflict of interest statement

No authors have competing interests.

Figures

Fig 1
Fig 1. HIV-1 replication in IPPK or IPMK KO MT-4 T cells.
A. and B. Diagram of IPPK (A) and IPMK (B). Top panel: Diagram of IPPK. Red arrows indicate approximate Cas9 cleavage site. Genomic PCR primer locations are indicated in black and orange. Primer locations are not exact. Bottom panel: Ethidium bromide stained agarose gel of the indicated, PCR amplified (A) IPPK or (B) IPMK loci. C. Toluidine blue stained polyacrylamide gel of TiO2 enriched phosphorylated compounds. D. Extracellular CD4 expression in the specified cell lines as assessed by flow cytometry. Box shows the 25th to 75th quartiles with the line denoting the median. Outlier points are shown as dots. E. The indicated MT-4 cells (100,000 cells) were infected with 0.1 ng p24 of HIV-1NL4-3. Virus release is graphed against time for each MT-4 cell line. F. Bar graph of Gag expression over time for the denoted MT-4 cell lines infected using the 1 ng p24 of HIV-1NL4-3 per 100,000 cells. Each bar shows the average of 4 independent experiments. G. Western blot of cell lysates from the designated clones transduced with lentiviral vectors. Protein size markers are shown to the left of the blot in kiloDaltons. H. HIV-1NL4-3 release over time using the same amount of p24 per cell as panel (E), but with HIV-1NL4-3 concentrated by ultracentrifugation. Each point in (E) and (H) represents the average of 4 independent infections. Asterisks signify significance from WT cells (E) or the respective KOVector cell line (H). Significance levels: * p<0.05, ** p<0.01, *** p<0.001, **** p<0.0001.
Fig 2
Fig 2. The effect of IPPK or IPMK KO on HIV-1 spread in CEM T cells.
A and B. Immunoblot of lysates from the denoted vector only or complemented cell lines. Reference molecular weight markers are shown to the left in kiloDaltons. C. Flow cytometry of extracellular CD4 expression in the denoted CEM cell lines is graphed on a box and whiskers. Box shows the 25th to 75th quartiles with the line denoting the median. Dots show outlier points. D and E. HIV-1 release plotted over time. Each point represents the average of 4 independent infections. Asterisks signify significance from the respective KOVector cell line. Significance levels: * p<0.05, ** p<0.01, *** p<0.001, **** p<0.0001.
Fig 3
Fig 3. HIV-1 single cycle infection of IPPK or IPMK KO MT-4 cells.
A-D. HIV-GFPVSVg single cycle infection (A), HIV-1VSVg single cycle infection (B), virus release from HIV-1VSVg-infected cells (C), and single cycle infection normalized p24 release from HIV-1VSVg-infected cells (D). Bars in (A-D) represent the average of 3 independent experiments. In panels (A) and (B) single cycle infection measurements are by flow cytometry. Efavirenz is abbreviated as EFV. Asterisks signify significance from WT cells. Significance levels: * p<0.05, ** p<0.01, *** p<0.001, **** p<0.0001.
Fig 4
Fig 4. Effect of IPPK or IPMK KO in CEM cells on HIV-1 early and late events.
A-H. Bar graphs of HIV-GFPVSVg single round infection (A and C), HIV-1VSVg single round infection (B and D), virus release from HIV-1VSVg infected cells (E and F), and single cycle infection normalized virus release from HIV-1VSVg infected cells (G and H). In all panels, bars represent the average of a minimum of 3 independent experiments. In panels (A) through (D) single cycle infection measurements are by flow cytometry. Efavirenz is abbreviated as EFV. Asterisks signify significance from WT cells. Significance levels: * p<0.05, ** p<0.01, *** p<0.001.
Fig 5
Fig 5. HIV-1 progeny virions from IPPK or IPMK KO MT-4 cells.
A. Left panel: infectivity of HIV-1 particles released from the infected WT and KO MT-4 cells expressed as relative light units (RLU) per ng of input p24, assessed by titration on TZM-bl reporter cells. Right panel: same as left panel except values were adjusted to account for differences in virion-associated (i.e. pelletable) p24. B. Fraction of virion-associated p24 at each day post infection. C and E. Immunoblots of HIV-1NL4-3 virions from cell-free supernatant probed with the indicated antibodies. Sizes are denoted to the left of the blot in kiloDaltons. D and F. Quantification of immunoblots in (C) and (E), respectively. G. Left panel: Western blot of HIV-1NL4-3 particles released from the indicated cell lines pelleted through a 20% sucrose cushion. Sizes to the left of the blot are in kiloDaltons. Right panel: Quantification of the immunoblots described in the left panel. The signal of the indicated protein was normalized for loading using the total CA signal for the respective lane. IN signal using an antibody against IN is quantified in the top graph. The signal corresponding to RT p66 or IN upon probing with HIV-Ig is shown in the bottom graph. H. Morphologies of HIV-1 particles released from the indicated cell lines as determined by thin section electron microscopy. In (A) and (B) each bar represents the average of 4 independent experiments. In (D) and (F) each bar represents the average of 3 independent experiments. In (G) each bar represents the average of 2 independent experiments. Asterisks signify significance from WT cells. Significance levels: * p<0.05, ** p<0.01, *** p<0.001, **** p<0.0001.
Fig 6
Fig 6. 35S pulse chase of HIV-1 virions produced in IPMK or IPPK KO cells.
A–C. Immunoblots of CA immunoprecipitants from 35S labeled progeny virions released from the indicated cell lines. Protein sizes are to the left of each blot in kiloDaltons. Top panel: Phosphorimaging scan. Bottom panel: Blot probed with HIV-Ig. D–O. Quantification of the 35S signal from released HIV-1 particles at each chase time point in hours (hr) for CA (D and E), Gag (F and G), MA-CA-SP1-NC (H and I), MA-CA-SP1+MA-CA (J and K), CA-SP1 (L and M), and the adjusted total signal in each lane relative to the respective 6 hour (h) back complemented cell line (N and O). In N and O, values for the KOVector data points are adjusted by dividing by the transcription/translation efficiency for the respective KO cell line. In panels A–O, HIV-1 particles released into the cell medium were used for CA immunoprecipitation. Points represent the average value from to 2 independent 35S pulse/ chase experiments. Significance levels: * p<0.05, ** p<0.01, *** p<0.001.
Fig 7
Fig 7. Summary of IPMK or IPPK dependent HIV-1 phenotypes.
A–B. Heatmaps summarizing the effects of IPPK or IPMK deficiency on HIV-1 replication in (A) CEM or (B) MT-4 cells. For experiments where multiple HIV-1 inocula were used, values shown are the average of the percent of WT. C. Model of the effect of depletion of IP5 and/or IP6. Green circles represent Gag. Teal circles represent MA-CA-SP1/MA-CA. Red circles represent NC. Squiggly lines represent viral RNA. Solid black lines with arrows depict release and changes in virion morphology. Dashed arrows portray assembly (light green) or disassembly (dark red) of Gag or Gag processing intermediates.

Similar articles

Cited by

References

    1. Bell NM, Lever AML. HIV Gag polyprotein: Processing and early viral particle assembly. Trends in Microbiology. Elsevier; 2013. pp. 136–144. 10.1016/j.tim.2012.11.006 - DOI - PubMed
    1. Grigorov B, Décimo D, Smagulova F, Péchoux C, Mougel M, Muriaux D, et al. Intracellular HIV-1 Gag localization is impaired by mutations in the nucleocapsid zinc fingers. Retrovirology. 2007;4 10.1186/1742-4690-4-54 - DOI - PMC - PubMed
    1. Freed EO, Orenstein JM, Buckler-White AJ, Martin MA. Single amino acid changes in the human immunodeficiency virus type 1 matrix protein block virus particle production. J Virol. 1994;68: 5311–5320. 10.1128/JVI.68.8.5311-5320.1994 - DOI - PMC - PubMed
    1. von Schwedler UK, Stemmler TL, Klishko VY, Li S, Albertine KH, Davis DR, et al. Proteolytic refolding of the HIV-1 capsid protein amino-terminus facilitates viral core assembly. EMBO J. 2000;19: 2391–2391. 10.1038/sj.emboj.7593063 - DOI - PMC - PubMed
    1. Joshi A, Nagashima K, Freed EO. Mutation of Dileucine-Like Motifs in the Human Immunodeficiency Virus Type 1 Capsid Disrupts Virus Assembly, Gag-Gag Interactions, Gag-Membrane Binding, and Virion Maturation. J Virol. 2006;80: 7939–7951. 10.1128/JVI.00355-06 - DOI - PMC - PubMed

Publication types

MeSH terms