. 2021 Feb 26;49(4):2005-2026.
doi: 10.1093/nar/gkaa1293.

RPA complexes in Caenorhabditis elegans meiosis; unique roles in replication, meiotic recombination and apoptosis

Affiliations

RPA complexes in Caenorhabditis elegans meiosis; unique roles in replication, meiotic recombination and apoptosis

Adam Hefel et al. Nucleic Acids Res. .

Erratum in

Abstract

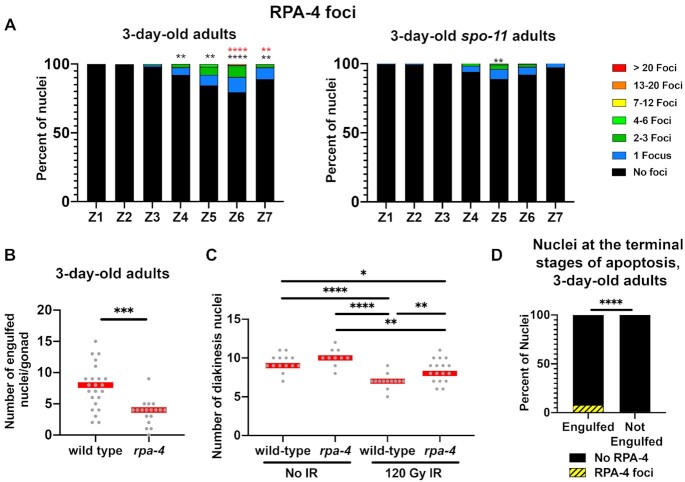
Replication Protein A (RPA) is a critical complex that acts in replication and promotes homologous recombination by allowing recombinase recruitment to processed DSB ends. Most organisms possess three RPA subunits (RPA1, RPA2, RPA3) that form a trimeric complex critical for viability. The Caenorhabditis elegans genome encodes RPA-1, RPA-2 and an RPA-2 paralog RPA-4. In our analysis, we determined that RPA-2 is critical for germline replication and normal repair of meiotic DSBs. Interestingly, RPA-1 but not RPA-2 is essential for somatic replication, in contrast to other organisms that require both subunits. Six different hetero- and homodimeric complexes containing permutations of RPA-1, RPA-2 and RPA-4 can be detected in whole animal extracts. Our in vivo studies indicate that RPA-1/4 dimer is less abundant in the nucleus and its formation is inhibited by RPA-2. While RPA-4 does not participate in replication or recombination, we find that RPA-4 inhibits RAD-51 filament formation and promotes apoptosis of a subset of damaged nuclei. Altogether these findings point to sub-functionalization and antagonistic roles of RPA complexes in C. elegans.


Figures

Figure 1.
Figure 1.
RPA-1 and RPA-2 are involved in replication in the pre-meiotic tip, where mutants of rpa-2 and not rpa-4 results in replication defects. (A) Model for possible RPA complex combinations in C. elegans. RPA-4 and RPA-2 are interchangeable components of the complex, and RPA-3 is unknown. (B) Larval lethality and arrest in rpa-1 mutants (chi-square test performed, P-value < 0.0001). (C) Proportion of nuclei in the PMT with immunofluorescence staining for each of the tagged RPA subunits. (D) Co-staining of gonads with FLAG::RPA-2 and PCN-1 (PCNA ortholog). Scale bar is 10 μm. (E) Number of proliferative zone nuclei as counted by position and morphology. (F) Percent of nuclei with PCN-1 staining representing S-phase nuclei. (G) percent of pH3 (histone H3 phosphorylated at serine 10) positive nuclei representing mitotic index. (H) Proliferative zone nuclear volumes as estimated by calculations using FIJI acquired data of SUN-1-stained nuclei (see Materials and Methods). Mann–Whitney tests performed for C, E, F and G, and t-test performed with welches correction for H, where P-values are represented as ****P < 0.0001, ***P < 0.001, **P < 0.01 and *P < 0.05. Red lines in E–G indicate the median and in H the mean with standard deviation.
Figure 2.
Figure 2.
RPA-1 and RPA-2 colocalize and interact in vitro; interaction is at DSBs in pachytene. (A) Percent of nuclei with indicated amount of OLLAS::RPA-1 foci. Black asterisks are comparison with wild type, and red asterisks are comparison with rpa-2 mutants, comparing individual foci (<20 foci). Blue asterisks indicate a comparison of >20 foci nuclei between mutants and wild type (for more comparisons, see Supplementary Figure S5D). (B) Percent of nuclei with indicated amount of FLAG::RPA-2 foci. Black asterisks represent comparison with wild type, for foci numbers in categories of <20. Blue asterisk represent comparison of >20 versus <20 category (C) Image of mid-pachytene nuclei showing colocalization of FLAG::RPA-2 and OLLAS:RPA-1 in otherwise wild-type background. Scale bar is 2 μm. (D) Percent of colocalization of FLAG::RPA-2 and OLLAS:RPA-1 in pachytene zones 4–6. A cartoon explaining how the data were quantified is presented on the right. (E) Pull down of FLAG::RPA-2 with Co-IP of OLLAS::RPA-1. Mann–Whitney tests performed, where P-values are represented as ****P < 0.0001, ***P < 0.001, **P < 0.01 and *P < 0.05.
Figure 3.
Figure 3.
RPA-4 forms rare foci in wild-type worms that become more abundant in rpa-2 mutants, and localize to SPO-11-independent and exogenous DSBs following RPA-1. (A) Percent of FLAG::RPA-4 foci in wild type and spo-11 mutants. An adjusted image of RPA-4-positive nuclei is presented below. Scale bar is 2 μm. (B) Abundance of OLLAS::RPA-1 and FLAG::RPA-4 MIR foci in indicated zones and time periods in ollas::rpa-1; flag::rpa-4 gonads, out of all MIR nuclei targeted. Indicated zone on x-axis refers to location of nuclei analyzed. For TZ 1 h post-MIR and MLP 24 h post-MIR, TZ nuclei were targeted for laser induced DSBs, while for MLP 1 h post-MIR, MLP nuclei were targeted for laser induced DSBs. (C) Percent of nuclei with indicated number of FLAG::RPA-4 foci in wild type and rpa-2 mutant gonads. (D) number of RPA-1 foci in RPA-4-positive and negative mid-pachytene nuclei. Red lines indicate the median. (E) A cartoon representing how the data in D and F were quantified. (F) number of RPA-4 foci in RPA-4-positive and negative mid-pachytene nuclei. Red lines indicate the median. (G and H) Percent of FLAG::RPA-4 and OLLAS::RPA-1 foci in mid-pachytene nuclei that colocalize in RPA-4-positive nuclei. Please refer to the cartoon in 2D for how the data were quantified (replace RPA-2 with RPA-4). Mann–Whitney tests performed, where P-values are represented as ****P < 0.0001, ***P < 0.001, **P < 0.01 and *P < 0.05.
Figure 4.
Figure 4.
Single-molecule pulldown reveals presence of three possible complex arrangements. (A) Colocalization in mid-pachytene nuclei of OLLAS::RPA-1, FLAG::RPA-2 and MYC::RPA-4, in 3-day-old germline of wild type worms. (B) Number of RPA-2 and RPA-4 pull down counts through interaction with surface-tethered RPA-1. (C) Number of RPA-1 and RPA-4 pull down counts through interaction with RPA-2. (D) Number of RPA-1 and RPA-2 pull down counts through interaction with RPA-4. (E) Number of RPA-1 and RPA-2 pull down counts through interaction with RPA-1. (F) Number of RPA-1 and RPA-2 pull down counts through interaction with RPA-2. (G) Number of RPA-2 and RPA-4 pull down counts through interaction with RPA-4. In each panel, the surface immobilization and imaging strategy is shown as a cartoon. The data are shown for at least three independent experiments. In all panels RPA-1, which is being detected using fluorescently labeled anti-OLLAS antibody is shown in orange, RPA-2 (anti-FLAG antibody) is shown blue and RPA-4 (anti-MYC antibody) is shown in purple. Pre-Ab is a control for non-specific signals in the flow cell treated with respective biotinylated antibody and worm extract. Wild type (WT) control reflects the experiments using worms expressing un-tagged RPA forms. The data for each pulled pair were compared using multiple t tests. The respective P value is shown under the graph. (H) Model interpretation of the results, as related to the panels indicated. t-tests performed, where P-values are represented as ****P < 0.0001, ***P < 0.001, **P < 0.01 and *P < 0.05.
Figure 5.
Figure 5.
Deletion of rpa-2 and not rpa-4 leads to defects in meiotic HR, FLAG::RPA-4 localizes to exogenously induced DSBs, and rpa-4 deletion leads to HU and IR sensitivity. (A) Brood size (number of viable progeny) for each mutant genotype, each point represents the number of adult progeny from a single parent. (B) Number of DAPI bodies counted in diakinesis –1 nuclei. (C) Percent viability of eggs laid in wild type and rpa-4 mutants that have been irradiated with 100 Gy gamma-IR as young adult worms and the respective controls. (D) Percent of nuclei with the indicated number of FLAG::RPA-4 foci for gamma irradiated young-adult germlines dissected 6 h after irradiation. (E) Representative image of mid-pachytene nuclei with and without gamma-IR. Scale bar is 2 μm. (F) On the left- representative images of FLAG::RPA-4 gonad dissected and stained 20 h after treatment with 40 mM HU and 3-day-old adult not treated with HU. On the right- FLAG::RPA-4 foci in HU treated germlines, on the left worms grown for the same amount of time without HU. Black stars are comparison between the two graphs. Scale bar is 20 μm (G) Brood size of HU treated wild type and rpa-4 mutant worms. Mann–Whitney tests performed, where P-values are represented as ****P < 0.0001, ***P < 0.001, **P < 0.01 and *P < 0.05. Red lines in A–C and G indicate the median.
Figure 6.
Figure 6.
rpa-2 and rpa-2; rpa-4 mutants have decreased RAD-51 foci compared to wild type, and RAD-51 MIR foci are more abundant in rpa-4 mutants. (A) Percent of nuclei with indicated amount of RAD-51 foci. Black asterisks are comparison with wild type, and red asterisks are comparison with rpa-2 mutants. (Mann-Whitney tests performed, where P-values are represented as ****P < 0.0001, ***P < 0.001, **P <0.01 and *P < 0.05, where black asterisks represent comparison with wild-type, and red asterisks represent comparison with rpa-2). (B) Time of appearance of GFP::RAD-51 foci in spo-11 mutant background after treatment with UV laser MIR. Mann-Whitney, P-value = 0.0157. (C) Number of GFP::RAD-51 foci following treatment with UV laser MIR. Mann–Whitney, P-value = 0.0847. Red lines in B and C indicate the median.
Figure 7.
Figure 7.
Double deletion of rpa-2 and rpa-4 leads to meiotic progression defects, with defects in apoptosis. (A) Representative images of gonads in Carnoy's fixed whole worms. Scale bar is 50 μm. (B) Length of pachytene extension in indicated mutants measured from bend to first diakinesis nucleus. (C) Number of diakinesis oocytes in each mutant background. (D) Number of CED-1::GFP engulfed nuclei in indicated mutants of 1-day-old worms. (E) Number of acridine orange staining nuclei in distal gonad measured until the end of the ‘bend’ region. (F) Number of acridine orange staining nuclei in proximal gonad measured from the end of the ‘bend’ region to the spermatheca. (G) Length of pachytene extension in indicated mutants from bend to first diakinesis nucleus in 2-day-old adults. Mann–Whitney tests performed, where P-values are represented as ****P < 0.0001, ***P < 0.001, **P < 0.01 and *P < 0.05. Red lines in B–F indicate the median.
Figure 8.
Figure 8.
RPA-4 foci appear in greater abundance in aging worms. (A) Percent of nuclei with indicated amount of FLAG::RPA-4 foci in 3-day-old hermaphrodites. Black asterisks are comparison with wild type 1-day-old adult worms and red asterisks are comparison with 3-day-old spo-11 mutants. (B) Number of CED-1::GFP engulfed nuclei in wild type and rpa-4 mutant 3-day-old worms. (C) Number of diakinesis oocytes in wild type and rpa-4 worms in 24 h post-IR and mock-IR. (D) Presence of FLAG::RPA-4 or foci in unmarked or CED-1::GFP engulfed nuclei in 3-day-old hermaphrodites. Mann–Whitney tests performed, where P-values are represented as ****P < 0.0001, ***P < 0.001, **P < 0.01 and *P < 0.05. Red line in B, C and E indicate the median.

Similar articles

Cited by

References

    1. Oakley G.G., Patrick S.M.. Replication protein A: directing traffic at the intersection of replication and repair. Front. Biosci. 2010; 15:883–900. - PMC - PubMed
    1. Caldwell C.C., Spies M.. Dynamic elements of replication protein A at the crossroads of DNA replication, recombination, and repair. Crit. Rev. Biochem. Mol. Biol. 2020; 55:482–507. - PMC - PubMed
    1. Treuner K., Ramsperger U., Knippers R.. Replication protein A induces the unwinding of long double-stranded DNA regions. J. Mol. Biol. 1996; 259:104–112. - PubMed
    1. Wold M.S., Kelly T.. Purification and characterization of replication protein A, a cellular protein required for in vitro replication of simian virus 40 DNA. Proc. Natl Acad. Sci. U.S.A. 1988; 85:2523–2527. - PMC - PubMed
    1. Wobbe C.R., Weissbach L., Borowiec J.A., Dean F.B., Murakami Y., Bullock P., Hurwitz J.. Replication of simian virus 40 origin-containing DNA in vitro with purified proteins. Proc. Natl Acad. Sci. U.S.A. 1987; 84:1834–1838. - PMC - PubMed

Publication types

MeSH terms