. 2021 Mar;62(3):729-741.
doi: 10.1111/epi.16819. Epub 2021 Jan 21.

Focal to bilateral tonic-clonic seizures are associated with widespread network abnormality in temporal lobe epilepsy

Affiliations

Focal to bilateral tonic-clonic seizures are associated with widespread network abnormality in temporal lobe epilepsy

Nishant Sinha et al. Epilepsia. 2021 Mar.

Abstract

Objective: Our objective was to identify whether the whole-brain structural network alterations in patients with temporal lobe epilepsy (TLE) and focal to bilateral tonic-clonic seizures (FBTCS) differ from alterations in patients without FBTCS.

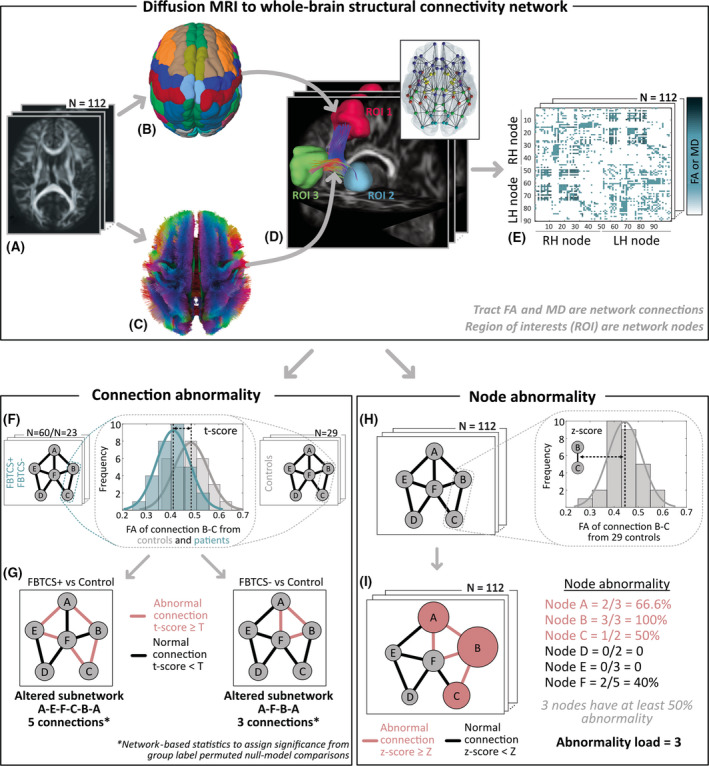
Methods: We dichotomized a cohort of 83 drug-resistant patients with TLE into those with and without FBTCS and compared each group to 29 healthy controls. For each subject, we used diffusion-weighted magnetic resonance imaging to construct whole-brain structural networks. First, we measured the extent of alterations by performing FBTCS-negative (FBTCS-) versus control and FBTCS-positive (FBTCS+) versus control comparisons, thereby delineating altered subnetworks of the whole-brain structural network. Second, by standardizing each patient's networks using control networks, we measured the subject-specific abnormality at every brain region in the network, thereby quantifying the spatial localization and the amount of abnormality in every patient.

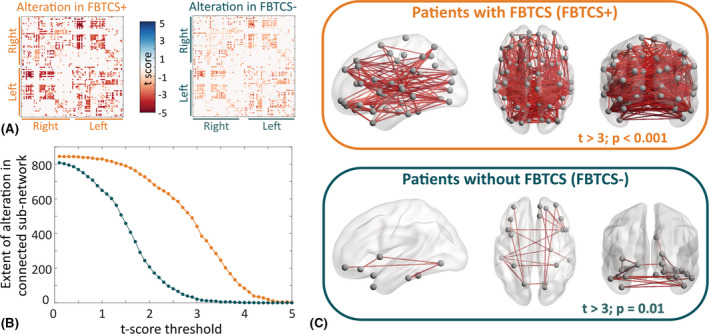
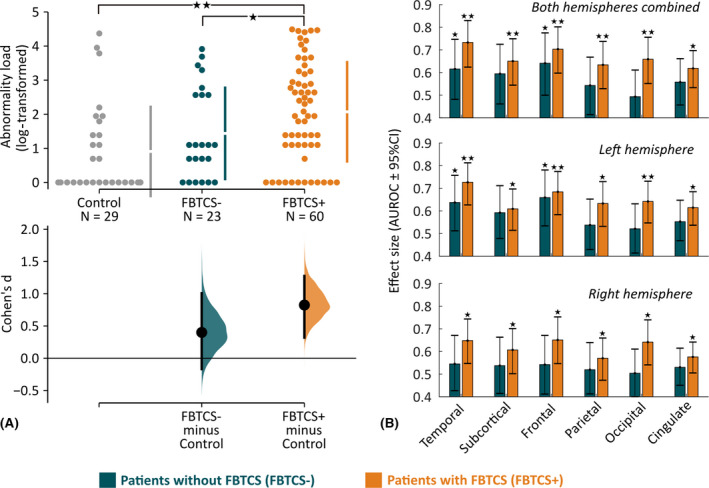
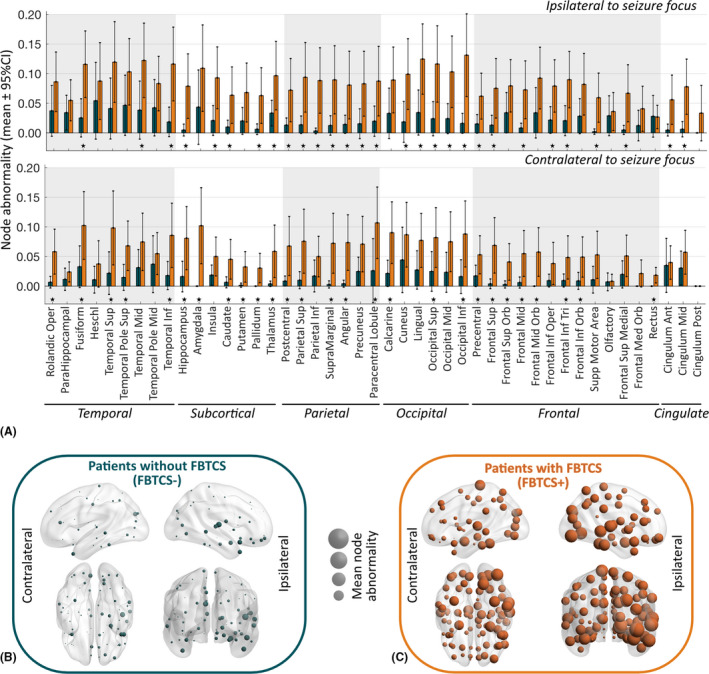
Results: Both FBTCS+ and FBTCS- patient groups had altered subnetworks with reduced fractional anisotropy and increased mean diffusivity compared to controls. The altered subnetwork in FBTCS+ patients was more widespread than in FBTCS- patients (441 connections altered at t > 3, p < .001 in FBTCS+ compared to 21 connections altered at t > 3, p = .01 in FBTCS-). Significantly greater abnormalities-aggregated over the entire brain network as well as assessed at the resolution of individual brain areas-were present in FBTCS+ patients (p < .001, d = .82, 95% confidence interval = .32-1.3). In contrast, the fewer abnormalities present in FBTCS- patients were mainly localized to the temporal and frontal areas.

Significance: The whole-brain structural network is altered to a greater and more widespread extent in patients with TLE and FBTCS. We suggest that these abnormal networks may serve as an underlying structural basis or consequence of the greater seizure spread observed in FBTCS.

Keywords: connectome; diffusion MRI; drug-resistant epilepsy; network abnormality; node abnormality; secondary generalized seizures.


Conflict of interest statement

None of the authors has any conflict of interest to disclose.

Figures

FIGURE 1
FIGURE 1
(A–E) Overall approach: diffusion magnetic resonance imaging (MRI) to whole‐brain structural connectivity network. (A) Diffusion MRI data from 112 participants (60 focal to bilateral tonic–clonic seizures [FBTCS]+ patients, 23 FBTCS− patients, and 29 controls) were QSDR reconstructed to align with the ICBM‐152 standard space. (B) Automated anatomical labeling parcellation atlas defined 90 cortical and subcortical regions of interest (ROIs). (C) The white‐matter streamlines constrained with neuroanatomical priors defined the connections between the ROIs. Streamlines are color‐coded as per the standard convention to indicate direction: red, left–right; green, anterior–posterior; blue, superior–inferior. (D) Three example ROIs with the streamlines ending in them as connections. By delineating connections between all pairs of ROIs, we derived a whole‐brain structural network for each participant (illustrated in the inset). (E) A network represented as a connectivity matrix with ROIs as nodes on the x‐ and y‐axes and connections encoded as the matrix element. We weighted the connections by averaging the fractional anisotropy (FA) or mean diffusivity (MD) values along the streamlines from diffusion tensor imaging measurements. Next, we assessed connection abnormality and node abnormality on these whole‐brain structural connectivity networks. For simplicity, we illustrate these concepts for a sample six‐node network. LH, left hemisphere; RH, right hemisphere. (F, G) Connection abnormality. (F) At every connection of the FBTCS+/FBTCS− patient groups and control group, we computed the t‐score as illustrated for a sample FA distribution of the connection B–C. (G) We defined abnormal (normal) connections as those above (below) a set t‐score threshold, T. By tracing the interconnected patterns of abnormal connections, we delineated an altered subnetwork, as shown in red, for FBTCS+ versus control and FBTCS− versus control comparisons. Network‐based statistics assessed the size of altered subnetwork from chance‐level occurrences in null models and assigned significance on the extent of alteration detected in the FBTCS+ and FBTCS− patient groups. (H, I) Node abnormality. (H) We computed the z‐score at each connection for every participant from the equivalent connection distribution in controls (illustrated for a sample connection (B–C). (I) We defined connections with z‐score higher or lower than a set threshold, Z, as abnormal (in red) or normal (in black). Node abnormality is the ratio of abnormal connections to the total number of connections in a node (illustrated by the size of the nodes). We identified abnormal nodes, shown in red, as those above a set node abnormality threshold, consequently quantifying abnormality load as the total number of abnormal nodes in the network.
FIGURE 2
FIGURE 2
Widespread network alteration is associated with secondary generalization of temporal lobe seizures. We applied network‐based statistics (NBS) to compare fractional anisotropy (FA)‐weighted connectivity matrices of focal to bilateral tonic–clonic seizures (FBTCS)+ and FBTCS− patient groups with the control group. (A) Alteration of each connection quantified by t‐scores computed within the NBS analysis for FBTCS+ versus control group comparison on the left and FBTCS− versus control group comparison on the right. Negative (positive) t‐score indicates reduction (increase) in FA of patients compared to controls. We found that the lower negative t‐scores were widespread across many connections in FBTCS+ patients compared to FBTCS− patients. (B) Applying NBS analysis, we identified a significantly reduced subnetwork (connected component) at prespecified t‐score thresholds in FBTCS+ and FBTCS− patient groups compared to the control group. The number of edges contained in the altered subnetwork represents the extent of alteration. We detected that the FBTCS+ patients (in orange) have a higher extent of alteration than the FBTCS− patients (in teal) across all t‐score thresholds. (C) An example of a significantly reduced connected subnetwork in FBTCS+ and FBTCS− patients. FA at every edge of this subnetwork was reduced in patients with respect to controls with t > 3. While the altered subnetwork is widespread in the FBTCS+ patient group (upper panel), it is limited primarily to the regions in the temporal and frontal lobes in the FBTCS− patient group (lower panel)
FIGURE 3
FIGURE 3
Abnormality load and its spatial distribution are associated with secondary generalization of temporal lobe seizures. (A) Abnormality load, that is, the total number of abnormal brain regions, is plotted on the estimation plot for the control, focal to bilateral tonic–clonic seizures (FBTCS)−, and FBTCS+ groups. Each dot represents a subject, the vertical lines represent the group mean with group standard deviation, and the lower panel shows the point estimate of Cohen d with 95% confidence interval (CI) from 5000 bootstrap resamples with replacement. We found that the abnormality load was significantly higher for FBTCS+ versus control group comparison as opposed to FBTCS− versus control group comparison. We also detected that the abnormality load in the FBTCS+ group was significantly higher than in the FBTCS− group. Statistical estimates: FBTCS− versus control: p = .04, d = .4, 95% CI = −.17 to 1; FBTCS+ versus control: p < .001, d = .82, 95% CI = .32–1.28; FBTCS+ versus FBTCS−: p = .03, d = .44, 95% CI = −.07 to .92. (B) At the resolution of individual lobes, the bar plot illustrates the effect size of abnormality load to discriminate between FBTCS− and control (in teal) and between FBTCS+ and control (in orange). We found that across all lobes, taken individually as left/right or combined, abnormality load in FBTCS+ was significantly higher than in the control group. In contrast, in the FBTCS− group only the abnormality load in temporal lobe (left and left‐right hemisphere combined) was significantly higher than in the control group. Two stars represent p < .005, and a single star represents .005 < p < .05. AUROC, area under receiver operating characteristic curve
FIGURE 4
FIGURE 4
Node abnormality in regions ipsilateral and contralateral to seizure focus between patients with and without focal to bilateral tonic–clonic seizures (FBTCS). (A) At every region of interest (ROI) expressed as ipsilateral or contralateral to seizure focus, we computed the mean node abnormality with 95% confidence interval (CI) at z‐score > 2.5. Node abnormality in the ipsilateral hemisphere was higher than in the contralateral hemisphere. The FBTCS+ patient group (in orange) had greater node abnormality than the FBTCS− patient group (in teal) across all ROIs. Specific ROIs with significantly higher node abnormality in the FBTCS+ group than in the FBTCS− group are highlighted by stars representing p < .05 after Benjamini–Hochberg false discovery rate correction for multiple comparisons. Lobewise occurrence of ROIs with significantly higher node abnormality in the FBTCS+ group was as follows: temporal 8/18 (44%), subcortical 11/14 (78%), parietal 12/14 (85%), occipital 8/12 (66%), frontal 15/26 (57%), cingulate 2/6 (33%). (B, C) Mean node abnormality is mapped for FBTCS− patients in B and FBTCS+ patients in C. The size of the nodes, shown by spheres, is scaled to their mean node abnormality value. We found that in both patient groups node abnormality is higher in the ipsilateral temporal lobe relative to the abnormality in the rest of the brain. High node abnormality was widespread in the FBTCS+ patient group, whereas in the FBTCS− patient group the abnormal nodes were localized mainly in the temporal and frontal areas

Similar articles

Cited by

References

    1. Jobst BC, Williamson PD, Neuschwander TB, Darcey TM, Thadani VM, Roberts DW. Secondarily generalized seizures in mesial temporal epilepsy: clinical characteristics, lateralizing signs, and association with sleep‐wake cycle. Epilepsia. 2001;42:1279–87. - PubMed
    1. Yoo JY, Farooque P, Chen WC, Youngblood MW, Zaveri HP, Gerrard JL, et al. Ictal spread of medial temporal lobe seizures with and without secondary generalization: an intracranial electroencephalography analysis. Epilepsia. 2014;55:289–95. - PMC - PubMed
    1. Lawn ND, Bamlet WR, Radhakrishnan K, O’Brien PC, So EL. Injuries due to seizures in persons with epilepsy: a population‐based study. Neurology. 2004;63:1565–70. - PubMed
    1. Devinsky O, Hesdorffer DC, Thurman DJ, Lhatoo S, Richerson G. Sudden unexpected death in epilepsy: epidemiology, mechanisms, and prevention. Lancet Neurol. 2016;15:1075–88. - PubMed
    1. Harden C, Tomson T, Gloss D, Buchhalter J, Cross JH, Donner E, et al. Practice guideline summary: sudden unexpected death in epilepsy incidence rates and risk factors: report of the Guideline Development, Dissemination, and Implementation Subcommittee of the American Academy of Neurology and the American Epilepsy Society. Neurology. 2017;88:1674–80. - PubMed

Publication types