Review
. 2022 Jul:82:120-133.
doi: 10.1016/j.semcancer.2020.12.016. Epub 2021 Jan 18.

LRIG1, a regulator of stem cell quiescence and a pleiotropic feedback tumor suppressor

Affiliations
Review

LRIG1, a regulator of stem cell quiescence and a pleiotropic feedback tumor suppressor

Yibing Ji et al. Semin Cancer Biol. 2022 Jul.

Abstract

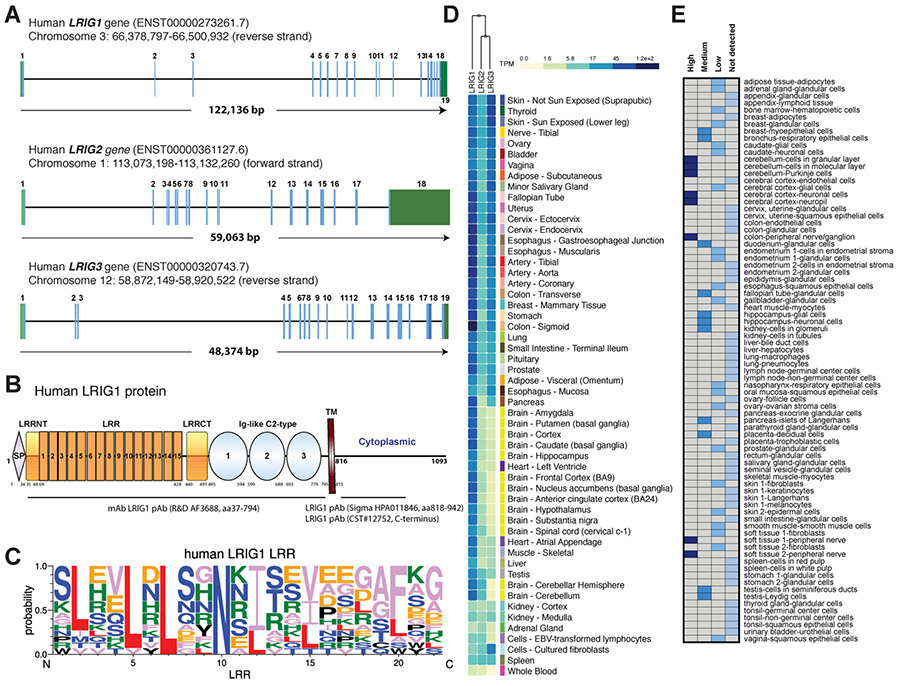
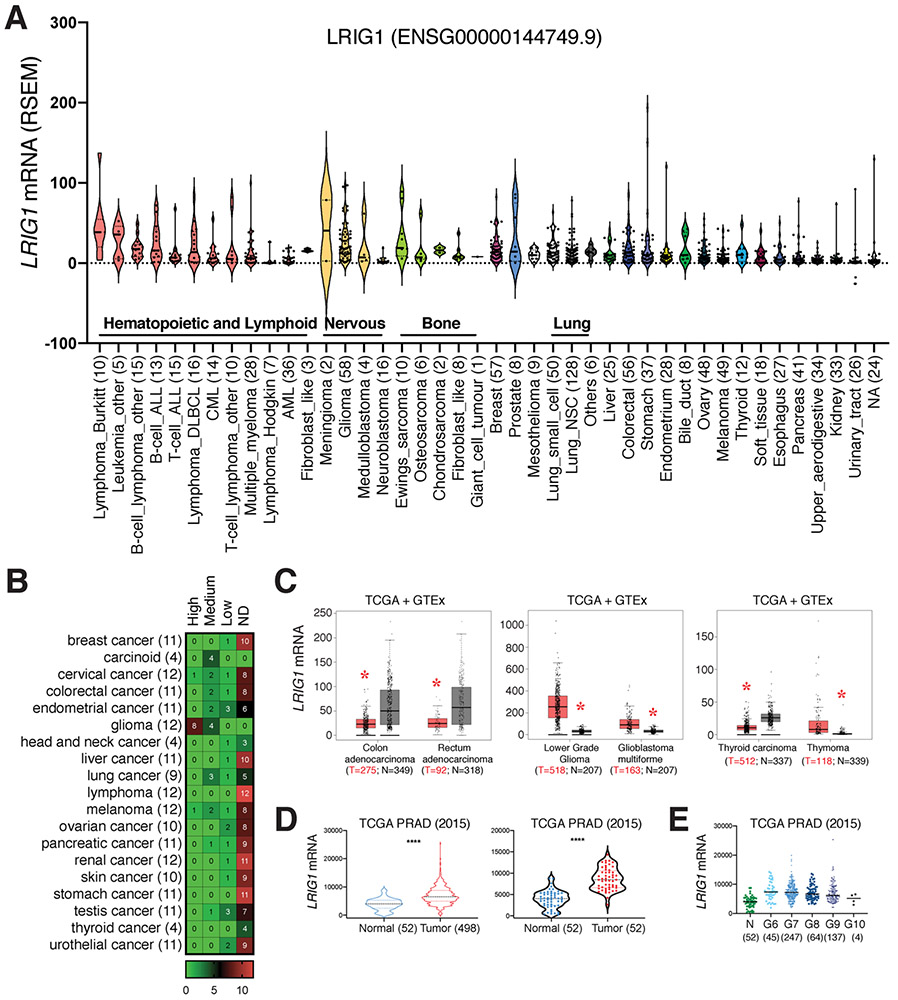
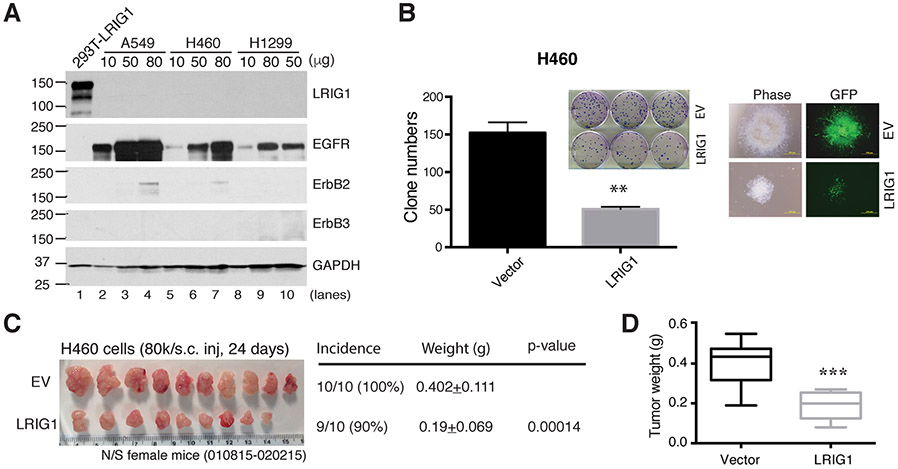
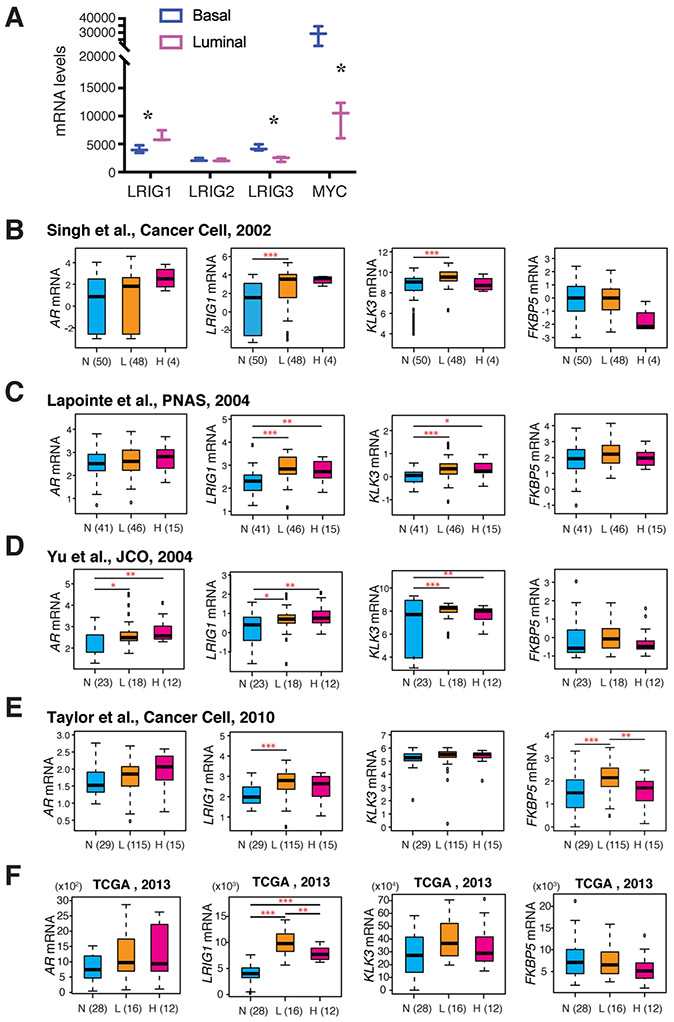
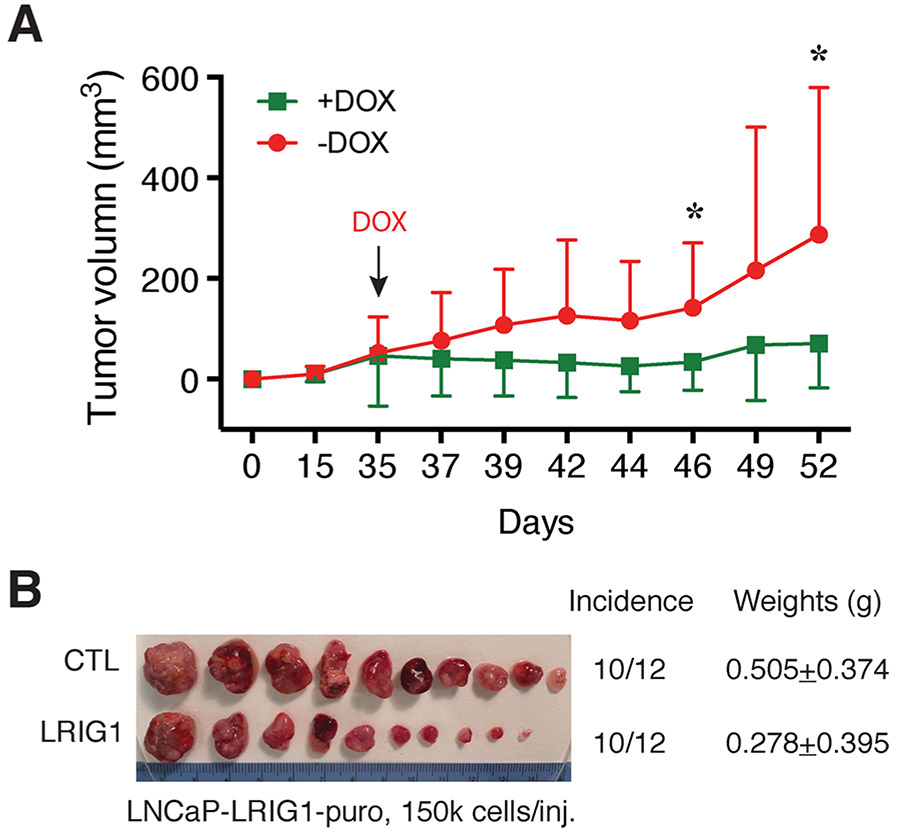
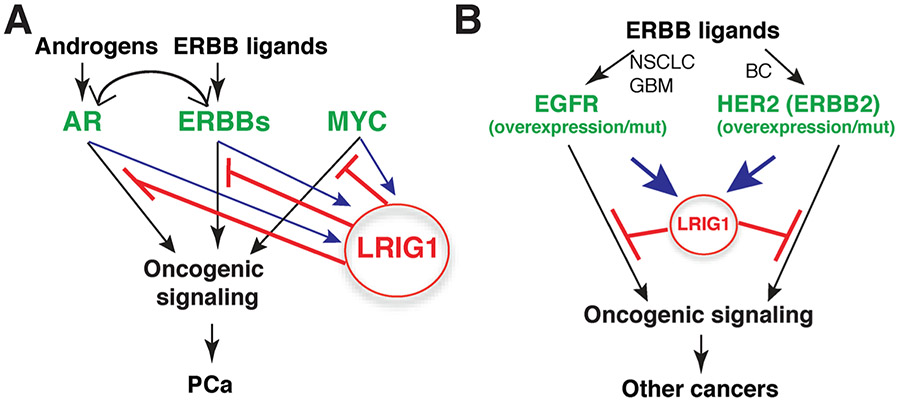
LRIG1, leucine-rich repeats and immunoglobulin-like domains protein 1, was discovered more than 20 years ago and has been shown to be downregulated or lost, and to function as a tumor suppressor in several cancers. Another well-reported biological function of LRIG1 is to regulate and help enforce the quiescence of adult stem cells (SCs). In both contexts, LRIG1 regulates SC quiescence and represses tumor growth via, primarily, antagonizing the expression and activities of ERBB and other receptor tyrosine kinases (RTKs). We have recently reported that in treatment-naïve human prostate cancer (PCa), LRIG1 is primarily regulated by androgen receptor (AR) and is prominently overexpressed. In castration-resistant PCa (CRPC), both LRIG1 and AR expression becomes heterogeneous and, frequently, discordant. Importantly, in both androgen-dependent PCa and CRPC models, LRIG1 exhibits tumor-suppressive functions. Moreover, LRIG1 induction inhibits the growth of pre-established AR+ and AR- PCa. Here, upon a brief introduction of the LRIG1 and the LRIG family, we provide an updated overview on LRIG1 functions in regulating SC quiescence and repressing tumor development. We further highlight the expression, regulation and functions of LRIG1 in treatment-naïve PCa and CRPC. We conclude by offering the perspectives of identifying novel cancer-specific LRIG1-interacting signaling partners and developing LRIG1-based anti-cancer therapeutics and diagnostic/prognostic biomarkers.

Keywords: Cancer stem cells; LRIG1; Prostate cancer; Stem cells; Tumor suppressor.


Figures

Fig. 1.
Fig. 1.
LRIG1 mRNA expression in normal human tissues. (A) Genomic structure of human LRIG1-3. The human LRIG1 gene, located on Chr3q14, spans 122,136 bp and consists of 19 exons. The LRIG2 and LRIG3 genes are smaller than the LRIG1 gene. The sizes of exons and introns are not drawn to scale. (B) Schematic of the human LRIG1 protein structure. SP, signal peptide; LRR, leucine-rich repeat; LRRNT, LRR N-terminal flanking; LRRCT, LRR C-terminal flanking; TM, transmembrane. Shown below are several commonly used anti-LRIG1 antibodies (mAb, monoclonal antibody; pAb, polyclonal antibody). (C) Sequence logos for human LRIG1 LRR amino acid alignments. (D) Heat map of LRIG1, LRIG2 and LRIG3 mRNA levels from GTEx. (E) Heat map presentation of the relative LRIG1 protein expression levels in human normal tissues based on immunohistochemistry staining (using the HPA011846; B) in samples from 44 normal tissue types of 144 individuals in the Human Protein Atlas. The box colors, dark blue, medium blue, blue and light blue, respectively, represent the “High, Medium, Low, Not Detected’ expression levels of the LRIG1 protein, as indicated on the top of the heat map.
Fig. 2.
Fig. 2.. LRIG1 expression in human cancers and cancer cell lines.
(A) Low levels of LRIG1 mRNA expression in most cultured human cancer cell lines. Gene expression data was extracted from the CCLE Cancer Cell Line Encyclopedia (https://portals.broadinstitute.org/ccle). Shown are the violin plots of the LRIG1 mRNA levels (RSEM) in the indicated cancer cell types (n indicated in parentheses). Median and quartiles as indicated. Each dot represents an individual cell line. (B) Heat map of LRIG1 protein expression in the indicated human cancers. The LRIG1 protein expression data was extracted from the Human Protein Atlas, based on immunohistochemistry staining of LRIG1 (HPA011846; see Fig. 1B) in samples from 189 cancer patients of 19 different cancer types (total n indicated in parentheses, scale bar represents case number). ND, not detected. The numbers in individual boxes represent the number of cases. Note that the majority of patient tumors expressed undetectable LRIG1 protein with the glioma as an exception. (C) LRIG1 mRNA expression is decreased in colorectal and thyroid cancers but increased in glioma and thymoma. Shown are the box plots of LRIG1 mRNA levels in tumor samples from TCGA and combined normal tissues from TCGA and GTEx (http://gepia.cancer-pku.cn). *p < 0.05 (ANOVA). (D) Increased LRIG1 mRNA levels in human PCa. Shown are LRIG1 mRNA levels in two different tumor-normal comparisons from the TCGA-PRAD dataset. ****p < 0.0001 (paired Student’s t-test). (E) In TCGA-PRAD dataset, LRIG1 mRNA levels are increased in PCa of all Gleason (G) grades compared to normal (N). p < 0.001 (paired Student’s t-test). However, LRIG1 mRNA levels gradually declined accompanying the increased tumor grade. p < 0.0001 (Jonckheere-Terpstra test).
Fig. 3.
Fig. 3.. LRIG1 overexpression inhibits lung cancer xenograft growth.
(A) WB of LRIG1 in lung cancer cells. A549, H460 and H1299 cells infected with pLVX-LRIG1 (LRIG1) or empty control (EV) lentivirus were used to prepare whole cell lysate in WB analysis of LRIG1 (a mAb against LRIG1 was used) and other proteins indicated. 293T-LRIG1 cells were used as positive control. Varying amounts of proteins were loaded in WB and GAPDH was used as a control. Note that that these 3 lung cancer cell lines do not express detectable endogenous LRIG1 and also lacked appreciable expression of ERBB2/ERBB3. (B) Clonal assays in H460 cells infected with pLVX-LRIG1 lentivirus (LRIG1) and the control empty lentivirus (EV) for 72 h and plated in 6-well plates (300 cells/well). Clones were counted 13 days after plating. Presented are the mean ± SD from triplicate cells. **p < 0.01 when compared with the corresponding EV controls (paired Student’s t-test). Shown on the right are representative images of the clones. (C-D) LRIG1 expression inhibits lung cancer xenograft growth. Shown in C are the tumor images and tumor incidence (# tumors/# injections), endpoint tumor weights (mean ± S.D) and the corresponding p-value (Student’s t-test). Shown in D is the boxplot of tumor weights (***p < 0.001).
Fig. 4.
Fig. 4.. LRIG1 is expressed in normal human prostate luminal cells and upregulated in PCa.
(A) Contrasting mRNA expression patterns between LRIG1 and MYC and between LRIG1 and LRIG3 in normal human prostate (NHP) luminal and basal cells. Shown are the mRNA levels (normalized read_counts) for the indicated genes based on our RNA-seq profiling data (GSE67070). *p < 0.05 (paired Student’s t-test). (B-F). LRIG1 mRNA levels are up-regulated in low grade prostate tumor tissues (L) compared with the matched normal tissues (N), but slightly downregulated in high grade tumor tissues (H) in 4 representative Oncomine datasets (B-E) and in TCGA (F). Similar trend was observed in some datasets with PSA (KLK3) and FKBP5 mRNA levels. Patient numbers are indicated. Note that the AR mRNA levels were elevated in only one dataset (D). *p < 0.05; **p < 0.01; ***p < 0.001; ****p < 0.0001.
Fig. 5.
Fig. 5.. LRIG1 induction inhibits the growth of AR+ LNCaP xenograft tumors.
LNCaP cells were infected with a doxycycline (DOX) inducible LRIG1-encoding lentiviral vector (MOI of 5) and selected with puromycin for ~2 weeks [100]. The LNCaP-LRIG1-puro cells were implanted subcutaneously (s.c) into two groups of male NOD/SCIDγ mice (12 mice/group), and, on day 35, one group of mice received DOX-supplemented chow (+DOX) and the other group the regular chow (−DOX). Tumor volumes were monitored and measured using a digital caliper and data presented in A (*p < 0.05; paired Student’s t-test). The experiment was terminated on day 52 and tumors harvested. Presented in B is the image of endpoint tumors with incidence and weights indicated. Note that the LRIG1-expressing tumors were nearly twice as smaller as the control (CTL) tumors (i.e., −DOX) although the p-value is not statistically significant due to big variations in tumor size.
Fig. 6.
Fig. 6.. Dynamic relationship between LRIG1 and ERBB family members.
(A) In normal prostate tissues, ERBB2 mRNA was expressed at highest levels followed by ERBB3 and EGFR while ERBB4 mRNA was barely detectable, and there was reasonable correlation between the ERBB2 and ERBB3 mRNA levels with LRIG1. Pearson correlation coefficient for linear regression was calculated based on expression data of the 5 genes in 232 normal prostate tissues from the GTEx project, with R and p-value indicated. (B) In PCa, ERBB3 was expressed at the highest level and there was a significant correlation between ERBB3 mRNA levels with LRIG1. Pearson correlation coefficient for linear regression was calculated based on expression data in 498 PCa samples from TCGA project, with R and p-value indicated.
Fig. 7.
Fig. 7.. Persistent and increased LRIG1 expression in CRPC.
(A) Heterogeneous LRIG1 mRNA expression in CRPC. Shown are the relative LRIG1 mRNA levels in CRPC compared to corresponding hormone-naïve PCa in 3 Oncomine datasets. LRIG1 was upregulated in the Tomlins dataset (FC = 2.359; p = 0.009) and showed reduced trend in the Best dataset (FC= −1.635; p = 0.095) whereas LRIG1 did not change in Holzbeirlein dataset (FC = 1.029; p = 0.483). (B) Discordant LRIG1 and AR expression and persistently high LRIG1 expression in patient CRPC. Shown are matched IHC images of AR and LRIG1 in the whole-mount slides of 4 patient CRPC specimens (adapted with permission from [100]). Note that most CRPC cells lost AR expression but retained high levels of LRIG1. (C) Persistent LRIG1 expression in CRPC xenograft models. Whole cell lysates (60 μg/lane) prepared from 4 pairs of androgen-dependent (AD) and androgen-independent (AI; castration-resistant) xenograft tumors (lanes 1-8) and from 1 pair of in vitro castrated (i.e., CDSS for 48 h) LNCaP cells (lanes 9-10) were used in WB analysis of the molecules indicated. (D) Alterations of LRIG1 in an in vitro castration model. As detailed in [108], LNCaP cells were subjected to 3 regimens of long-term castration in culture, i.e., CDSS (charcoal dextran stripped serum), ENZA (enzalutamide; 10 μM), or CDSS plus bica (bicalutamide; 20 μM) for the time intervals indicated (w, week; m, month). Whole cell lysates (60 μg/lane) were used in WB analysis of the molecules indicated. *, cleaved ~110-kD and 100-kD LRIG1 ECD fragments. The arrow indicates the 60-kD ECD fragment.
Fig. 8.
Fig. 8.. LRIG1 as a pleiotropic feedback tumor suppressor.
(A) In PCa, oncogenic signaling from androgen/AR, ERBB/ligands and MYC induces LRIG1 expression and the upregulated LRIG1, in turn, antagonizes tumorigenesis driven by these pathways. Adapted with permission from [100]. (B) LRIG1 similarly functions as a feedback tumor suppressor in other ERBB-driven human cancers (see Text).

Similar articles

Cited by

References

    1. Ghiglione C, Carraway KL 3rd, Amundadottir LT, et al., The transmembrane molecule kekkon 1 acts in a feedback loop to negatively regulate the activity of the Drosophila EGF receptor during oogenesis, Cell 96 (6) (1999) 847–856, 10.1016/s0092-8674(00)80594-2. - DOI - PubMed
    1. Nilsson J, Vallbo C, Guo D, et al., Cloning, characterization, and expression of human LIG1, Biochem. Biophys. Res. Commun 284 (5) (2001) 1155–1161, 10.1006/bbrc.2001.5092. - DOI - PubMed
    1. Suzuki Y, Sato N, Tohyama M, et al., cDNA doning of a novel membrane glycoprotein that is expressed specifically in glial cells in the mouse brain. LIG-1, a protein with leucine-rich repeats and immunoglobulin-like domains, J. Biol. Chem 271 (37) (1996) 22522–22527, 10.1074/jbc.271.37.22522. - DOI - PubMed
    1. Holmlund C, Nilsson J, Guo D, et al., Characterization and tissue-specific expression of human LRIG2, Gene 332 (2004) 35–43, 10.1016/j.gene.2004.02.002. - DOI - PubMed
    1. Guo D, Holmlund C, Henriksson R, et al., The LRIG gene family has three vertebrate paralogs widely expressed in human and mouse tissues and a homolog in Ascidiacea, Genomics 84 (1) (2004) 157–165, 10.1016/j.ygeno.2004.01.013. - DOI - PubMed

Publication types

Substances