

Restructuring of amygdala subregion apportion across adolescence
- PMID: 33476872
- PMCID: PMC7820032
- DOI: 10.1016/j.dcn.2020.100883
Restructuring of amygdala subregion apportion across adolescence
Abstract
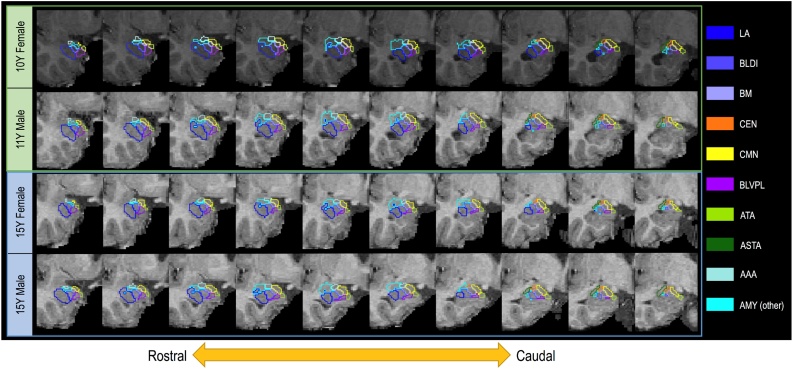
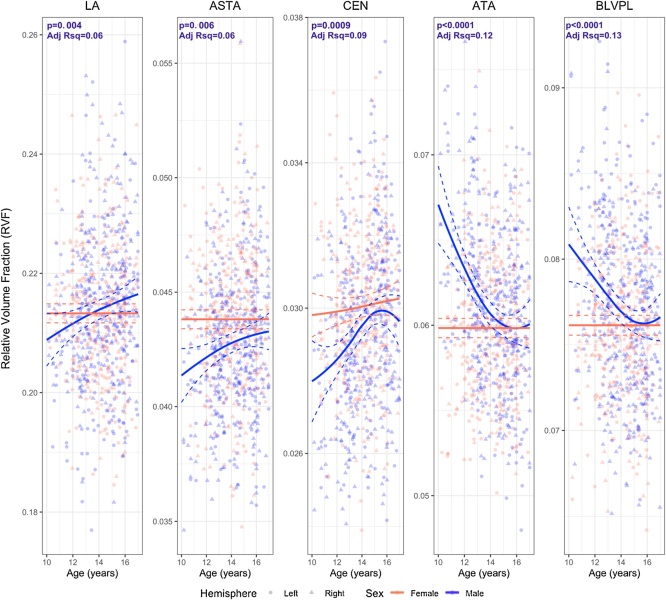
Total amygdala volumes develop in association with sex and puberty, and postmortem studies find neuronal numbers increase in a nuclei specific fashion across development. Thus, amygdala subregions and composition may evolve with age. Our goal was to examine if amygdala subregion absolute volumes and/or relative proportion varies as a function of age, sex, or puberty in a large sample of typically developing adolescents (N = 408, 43 % female, 10-17 years). Utilizing the in vivo CIT168 atlas, we quantified 9 subregions and implemented Generalized Additive Mixed Models to capture potential non-linear associations with age and pubertal status between sexes. Only males showed significant age associations with the basolateral ventral and paralaminar subdivision (BLVPL), central nucleus (CEN), and amygdala transition area (ATA). Again, only males showed relative differences in the proportion of the BLVPL, CEN, ATA, along with lateral (LA) and amygdalostriatal transition area (ASTA), with age. Using a best-fit modeling approach, age, and not puberty, was found to drive these associations. The results suggest that amygdala subregions show unique variations with age in males across adolescence. Future research is warranted to determine if our findings may contribute to sex differences in mental health that emerge across adolescence.
Keywords: Adolescent; Amygdala; Basolateral nuclear complex; Central amygdaloid nucleus; Corticomedial nuclear complex; Puberty; Sex characteristics.
Copyright © 2020 The Authors. Published by Elsevier Ltd.. All rights reserved.
Conflict of interest statement
The authors declare that they have no known competing financial interests or personal relationships that could have appeared to influence the work reported in this paper.
Figures


References
-
- Amaral D.G., Price J.L. Amygdalo-cortical projections in the monkey (Macaca fascicularis) J. Comp. Neurol. 1984;230(4):465–496. - PubMed
-
- Amunts K., Kedo O., Kindler M., Pieperhoff P., Mohlberg H., Shah N.J., Habel U., Schneider F., Zilles K. Cytoarchitectonic mapping of the human amygdala, hippocampal region and entorhinal cortex: intersubject variability and probability maps. Anat. Embryol. (Berl.) 2005;210(5–6):343–352. - PubMed
-
- Andersen S.L., Teicher M.H. Stress, sensitive periods and maturational events in adolescent depression. Trends Neurosci. 2008;31(4):183–191. - PubMed
-
- Avants B., Anderson C., Grossman M., Gee J.C. Spatiotemporal normalization for longitudinal analysis of gray matter atrophy in frontotemporal dementia. Med. Image Comput. Comput. Assist. Interv. 2007;10(Pt 2):303–310. - PubMed
Publication types
MeSH terms
Grants and funding
LinkOut - more resources
Full Text Sources
Other Literature Sources
Medical
Research Materials
