. 2021 Jan 18;14(2):439.
doi: 10.3390/ma14020439.

Correlating Local Volumetric Tissue Strains with Global Lung Mechanics Measurements

Affiliations

Correlating Local Volumetric Tissue Strains with Global Lung Mechanics Measurements

Hari Arora et al. Materials (Basel). .

Abstract

The mechanics of breathing is a fascinating and vital process. The lung has complexities and subtle heterogeneities in structure across length scales that influence mechanics and function. This study establishes an experimental pipeline for capturing alveolar deformations during a respiratory cycle using synchrotron radiation micro-computed tomography (SR-micro-CT). Rodent lungs were mechanically ventilated and imaged at various time points during the respiratory cycle. Pressure-Volume (P-V) characteristics were recorded to capture any changes in overall lung mechanical behaviour during the experiment. A sequence of tomograms was collected from the lungs within the intact thoracic cavity. Digital volume correlation (DVC) was used to compute the three-dimensional strain field at the alveolar level from the time sequence of reconstructed tomograms. Regional differences in ventilation were highlighted during the respiratory cycle, relating the local strains within the lung tissue to the global ventilation measurements. Strains locally reached approximately 150% compared to the averaged regional deformations of approximately 80-100%. Redistribution of air within the lungs was observed during cycling. Regions which were relatively poorly ventilated (low deformations compared to its neighbouring region) were deforming more uniformly at later stages of the experiment (consistent with its neighbouring region). Such heterogenous phenomena are common in everyday breathing. In pathological lungs, some of these non-uniformities in deformation behaviour can become exaggerated, leading to poor function or further damage. The technique presented can help characterize the multiscale biomechanical nature of a given pathology to improve patient management strategies, considering both the local and global lung mechanics.

Keywords: alveoli; digital volume correlation; lung mechanics; micro-CT; synchrotron.


Conflict of interest statement

The authors declare no conflict of interest. The funders had no role in the design of the study; in the collection, analyses, or interpretation of data; in the writing of the manuscript; or in the decision to publish the results.

Figures

Figure 1
Figure 1
Schematic of the Controlled inflation Tester (CiT) hardware and its functionality.
Figure 2
Figure 2
Experimental overview including the in situ ventilation setup on the beamline at branch line I13 Diamond Light Source: lung mechanical measurements acquired using the custom-built Controlled inflation Tester (CiT) for each scan are illustrated alongside the postprocessing steps performed for each image.
Figure 3
Figure 3
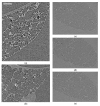
Sample raw reconstructed images from mouse and rat lungs under different states of motion to illustrate the differences between static and dynamic images when optimizing dwell times prior to scanning: (a,b) mouse lung at low inflation state (0 cmH2O) and essentially static; (c) rat lung recently inflated; (d) rat lung continuously inflated slowly with air during the scan (approximately 0.1 mL); and (e) rat lung cyclically inflated/deflated by 0.1 mL during the scan. The image scale bar (top left) indicates 200 µm for all images in the figure.
Figure 4
Figure 4
Repeatability of mechanical ventilation (4 cycles shown) and the zero-strain test Digital volume correlation (DVC) results performed at 20 cmH2O are shown. A P-V curve for each cycle is overlaid on the same plot (left) plus the DVC strain fields for the zero-strain test (right): the unfiltered images (top right) and Paganin-filtered images (bottom right), with both showing strains below 5%. The image scale bar (top right) indicates 200 µm for all images in the figure.
Figure 5
Figure 5
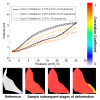
Sample degradation after 20 exposures indicated by a drop in compliance plus the lowering of correlation quality where large deformations occur: P-V curves show the stability of the lung compliance and the gradual degradation over time. The image scale bar (bottom left) indicates 200 µm for all images in the figure.
Figure 6
Figure 6
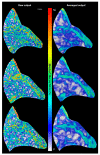
Results overview of the pressure cycles between −5 cmH2O and 30 cmH2O with stopping pressures at 0 cmH2O (top row), 5 cmH2O (middle row), and 10 cmH2O (bottom row): the DVC results are shown with detailed strains (left), with mild averaging of 7 local data points, plus the same strain field averaged over 15 local data points (centre) to illustrate the averaged behaviour in the region, plus mechanical data for each run including the true end pressure recorded during the scan and the sample compliance. The strain peak is around 60% in these colour contour maps. The image scale bar (top left) indicates 200 µm for all images in the figure. The images are of a single representative specimen at multiple inflation states.
Figure 7
Figure 7
Results overview of the pressure cycles between −5 cmH2O and 30 cmH2O with stopping pressures at 15 cmH2O (top row), 25 cmH2O (middle row), and 30 cmH2O (bottom row): the DVC results are shown with detailed strains (left), with mild averaging of 7 local data points, plus the same strain field averaged over 15 local data points (centre) to illustrate the averaged behaviour in the region, plus mechanical data for each run including the true end pressure recorded during the scan and the sample compliance. A strain peak >100% is shown in these colour contour maps. The image scale bar (top left) indicates 200 µm for all images in the figure. The images are of a single representative specimen at multiple inflation states.
Figure 8
Figure 8
Sample results from higher magnification lung ventilations (2× compared to 1.25×): the higher magnification enables more detailed strain fields approaching the scales of the alveolar walls to be resolved. The image scale bar (top left) indicates 200 µm for all images in the figure.

References

    1. Tawhai M.H., Lin C.-L. Image-based modeling of lung structure and function. J. Magn. Reson. Imaging. 2010;32:1421–1431. doi: 10.1002/jmri.22382. - DOI - PMC - PubMed
    1. Xiao Q., Cetto R., Doorly D., Bates A.J., Rose J.N., McIntyre C., Comerford A., Madani G., Tolley N.S., Schroter R. Assessing Changes in Airflow and Energy Loss in a Progressive Tracheal Compression Before and After Surgical Correction. Ann. Biomed. Eng. 2020;48:822–833. doi: 10.1007/s10439-019-02410-1. - DOI - PMC - PubMed
    1. Kimura S., Sakamoto T., Sera T., Yokota H., Ono K., Doorly D.J., Schroter R.C., Tanaka G. Voxel-based modeling of airflow in the human nasal cavity. Comput. Methods Biomech. Biomed. Eng. 2019;22:331–339. doi: 10.1080/10255842.2018.1555584. - DOI - PubMed
    1. Bates A.J., Comerford A., Cetto R., Doorly D.J., Schroter R.C., Tolley N.S. Computational fluid dynamics benchmark dataset of airflow in tracheas. Data Brief. 2017;10:101–107. doi: 10.1016/j.dib.2016.11.091. - DOI - PMC - PubMed
    1. Kitaoka H., Takaki R., Suki B. A three-dimensional model of the human airway tree. J. Appl. Physiol. 1999;87:2207–2217. doi: 10.1152/jappl.1999.87.6.2207. - DOI - PubMed