Review
. 2021 Jan 18;22(2):911.
doi: 10.3390/ijms22020911.

Congenital Diseases of DNA Replication: Clinical Phenotypes and Molecular Mechanisms

Affiliations
Review

Congenital Diseases of DNA Replication: Clinical Phenotypes and Molecular Mechanisms

Megan Schmit et al. Int J Mol Sci. .

Abstract

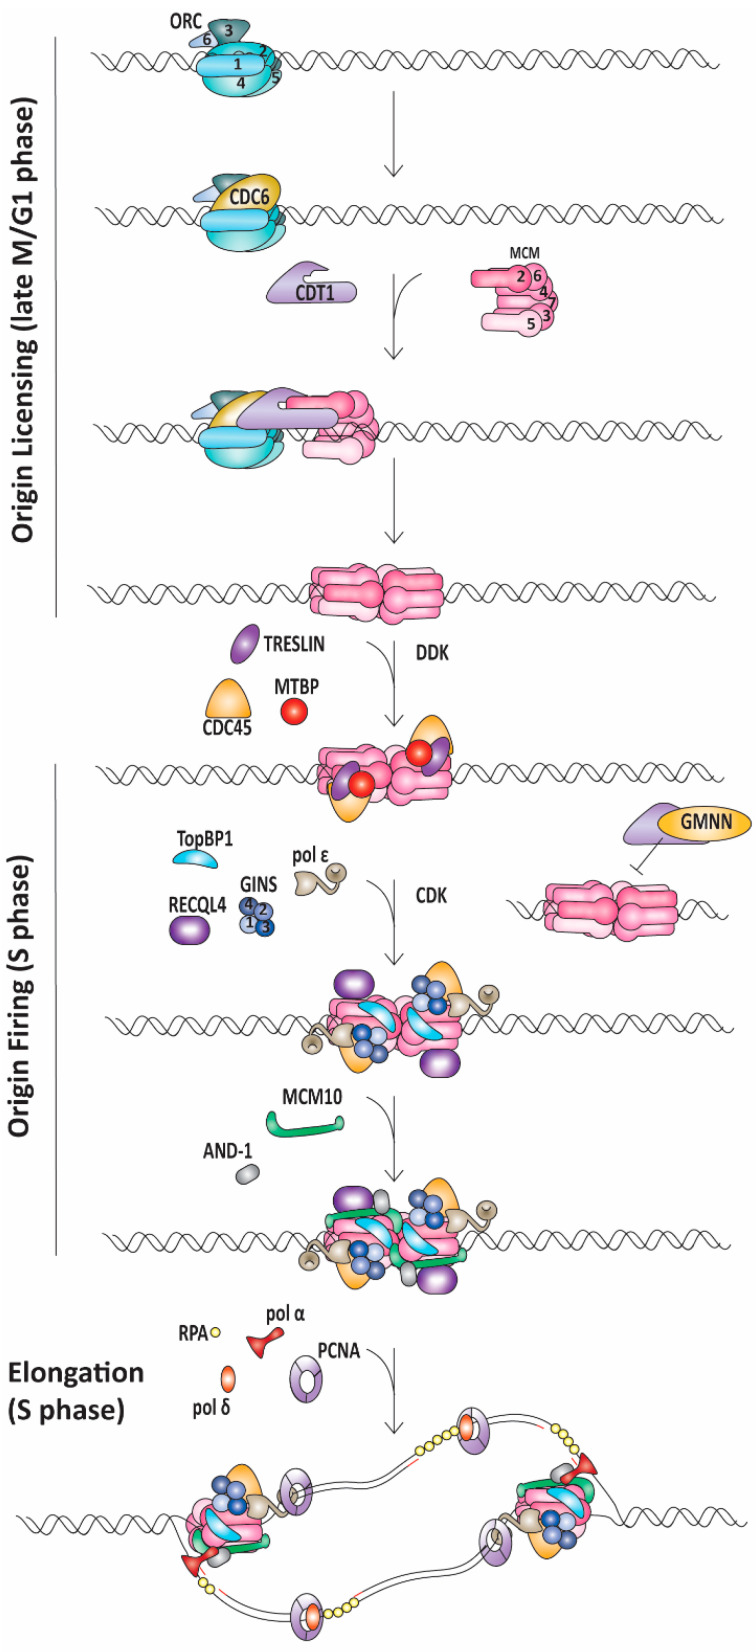
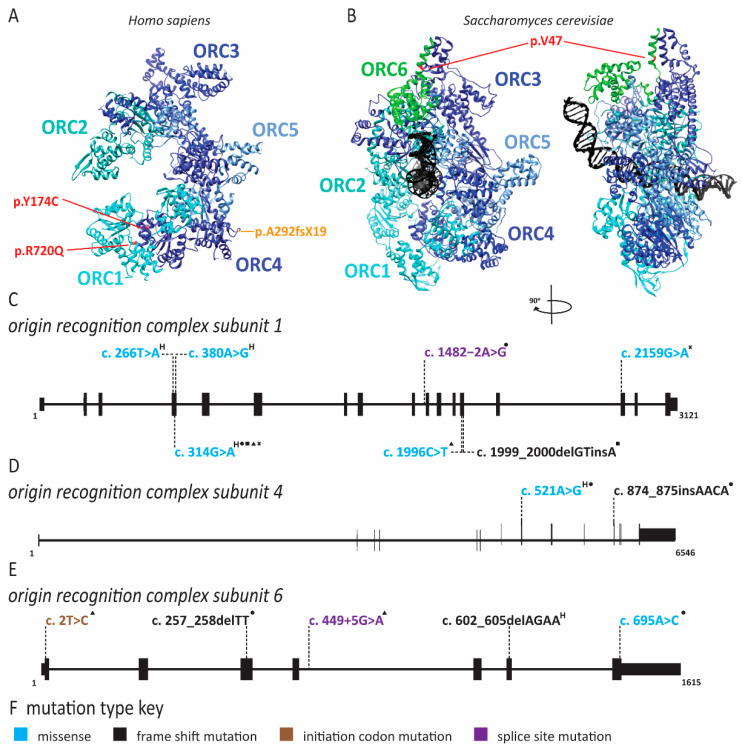
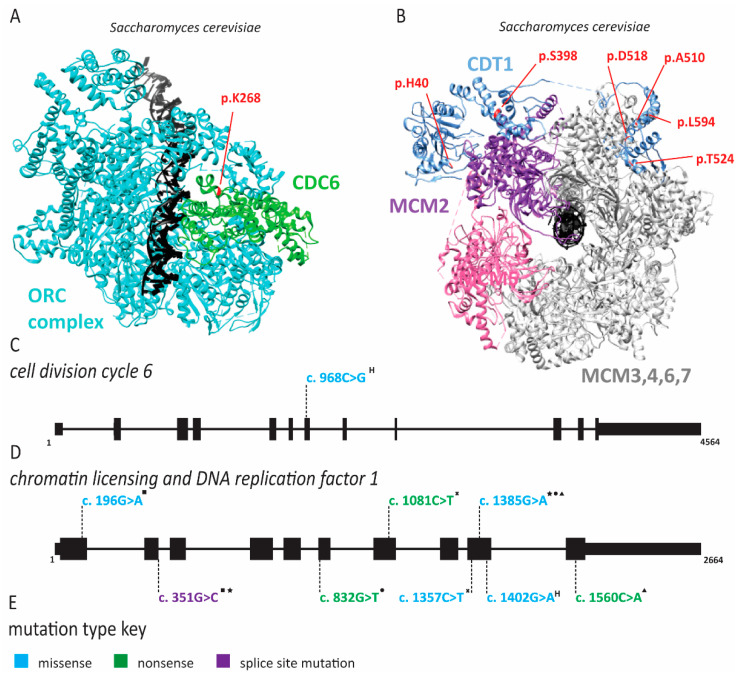
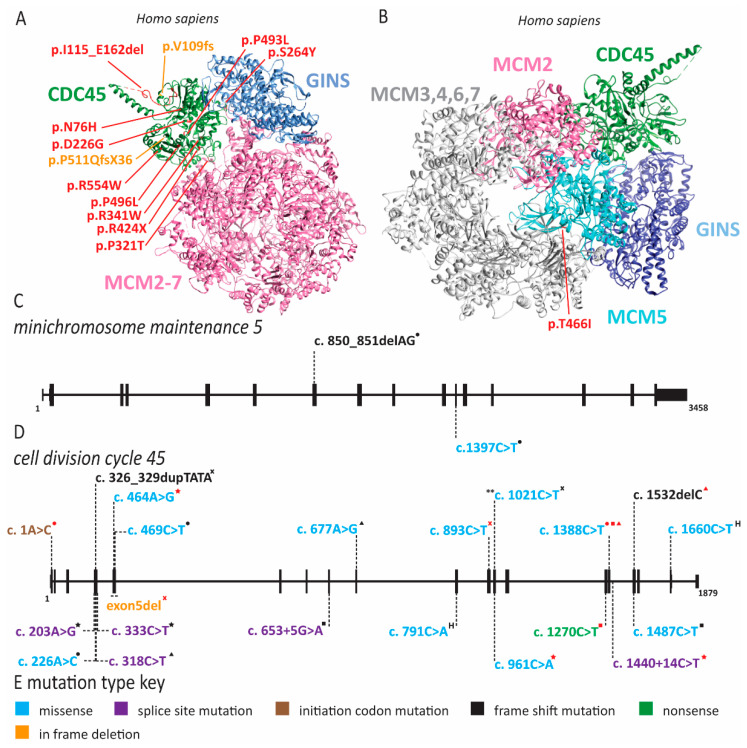
Deoxyribonucleic acid (DNA) replication can be divided into three major steps: initiation, elongation and termination. Each time a human cell divides, these steps must be reiteratively carried out. Disruption of DNA replication can lead to genomic instability, with the accumulation of point mutations or larger chromosomal anomalies such as rearrangements. While cancer is the most common class of disease associated with genomic instability, several congenital diseases with dysfunctional DNA replication give rise to similar DNA alterations. In this review, we discuss all congenital diseases that arise from pathogenic variants in essential replication genes across the spectrum of aberrant replisome assembly, origin activation and DNA synthesis. For each of these conditions, we describe their clinical phenotypes as well as molecular studies aimed at determining the functional mechanisms of disease, including the assessment of genomic stability. By comparing and contrasting these diseases, we hope to illuminate how the disruption of DNA replication at distinct steps affects human health in a surprisingly cell-type-specific manner.

Keywords: Baller-Gerold syndrome; FILS syndrome; IMAGe syndrome; Meier-Gorlin syndrome; RAPADILINO; Rothmund-Thomson syndrome; Van Esch-O’Driscoll disease; X-linked pigmentary reticulate disorder; natural killer cell deficiency.


Conflict of interest statement

The authors declare no conflict of interest.

Figures

Figure 1
Figure 1
Origin licensing and firing require the coordinated action of multiple protein complexes. Origin licensing and firing require the coordinated action of multiple protein complexes. This cartoon depicts the steps and essential proteins involved in DNA replication origin licensing and firing, drawing from knowledge gained by studying yeast and human systems. Origin licensing occurs in the late M and G1 phase of the cell cycle when ORC1-6 binds to origins of replication. Together, CDC6 and ORC recruit CDT1 and MCM2-7, loading two MCM2-7 complexes onto dsDNA. In budding yeast, CDT1 binds to the MCM2-7 hexamer; however, these proteins have not been identified in a soluble complex without DNA in human cells. As cells transition into the S phase, Treslin, CDC45 and MTBP are recruited in a DDK-dependent manner. Pol ε and the GINS complex are recruited together with TopBP1 and RECQL4 in a CDK-dependent manner. During the S phase, licensing of additional origins is prevented by multiple mechanisms including sequestering of CDT1 by GMNN. Activation of DNA replication or origin firing requires MCM10, which aids in the bypass of the two CMG helicases past each other. MCM10 and AND-1 anchor pol α-primase to initiate DNA synthesis. As the CMG helicases progress in opposite directions, two replication forks form with pol α-primase, pol δ, pol ε and PCNA to promote DNA synthesis. Pol ε synthesizes the leading strand, while RPA binds single-stranded DNA on the lagging strand template until Okazaki fragments are produced by the consecutive action of pol α-primase and pol δ. Abbreviations: ORC, origin recognition complex; CDC, cell division cycle; CDT1, chromatin licensing and DNA replication factor 1; MCM, minichromosome maintenance; MTBP, Mdm2-binding protein; DDK, Dbf4-dependent kinase; GINS, go-ichi-ni-san; TopBP1, DNA topoisomerase II binding protein 1; RECQL4, ATP-dependent DNA helicase Q4; CDK, cyclin-dependent kinases; GMNN, geminin; AND-1, acidic nucleoplasmic DNA-binding protein 1; PCNA, proliferating cell nuclear antigen; RPA, replication protein A.
Figure 2
Figure 2
Mutations in origin recognition complex (ORC) subunits cause Meier-Gorlin syndrome. Pathogenic mutations in ORC subunits are depicted on a schematic of each gene and the crystal structure of either Homo sapiens or Saccharomyces cerevisiae proteins. Mutations that do not have corresponding amino acids in the structure or resulted in abnormal splicing are not depicted. For a complete list of mutations and associated protein changes, see Supplementary Table S1. Structures were generated with the Chimera program (http://www.cgl.ucsf.edu/chimera). Exon and intron schematics were generated with the UCSD genome browser. Reference sequences are ORC1 NM_004153.4, ORC4 NM_181742.4 and ORC6 NM_014321.4. (A) Crystal structure of human ORC subunits with mutations depicted, including missense mutations (red) and frame shift mutations (orange). The structure was generated using pdb file 5UJM. (B) Alignment of Homo sapiens and Saccharomyces cerevisiae ORC6 was completed using UniProt alignment tool (https://www.uniprot.org/align/). The amino acid corresponding to missense mutation p.Y232S (c.695A > C) is identified in red on the crystal structure of yeast ORC6. The structure was generated using pdb file 5zr1. Schematic of (C) ORC1, (D) ORC4 and (E) ORC6 genes depicted with exons as black boxes and introns as horizontal lines. Mutations are mapped to the appropriate gene regions. “H” superscript indicates a homozygous mutation. Compound heterozygous mutation pairs are indicated by superscript symbols. Each mutation combination is depicted, and certain alleles may be present in multiple combinations such as ORC1 c.314G > A. The frequency of each allele in the affected population is not indicated. (F) For each gene, the color of the mutations indicates the type of mutation according to this key.
Figure 3
Figure 3
Mutations in chromatin licensing and DNA replication factor 1 (CDT1) and cell division cycle 6 (CDC6) cause Meier-Gorlin syndrome. Pathogenic mutations of CDC6 and CDT1 are depicted on a schematic of each gene and crystal structure of Saccharomyces cerevisiae proteins. Mutations that do not have corresponding amino acids in the structure or resulted in abnormal splicing are not depicted. For a complete list of mutations and associated protein changes, see Supplementary Table S1. Alignment of Homo sapiens and Saccharomyces cerevisiae genes was completed using UniProt alignment tool (https://www.uniprot.org/align/). The structure was generated using pdb file 5v8f and the Chimera program (http://www.cgl.ucsf.edu/chimera). Exon and intron schematics were generated with the UCSD genome browser. Reference sequences are CDC6 NM_001254.4 and CDT1 NM_030928.4. (A). Crystal structure of yeast CDC6-ORC-MCM2-7-CDT1 complex (MCM2-7 and CDT1 not shown) with the amino acid associated with missense mutation p.T323R (c.968C > G) is depicted. (B) Crystal structure of yeast CDC6-ORC-MCM2-7-CDT1 complex (CDC6 and ORC not shown) with amino acids corresponding to missense and nonsense mutations in the human protein identified in red on the crystal structure of yeast CDT1. Schematic of (C) CDC6 and (D) CDT1 genes depicted with exons as black boxes and introns as horizontal lines. Mutations are mapped to the appropriate gene regions. “H” superscript indicates a homozygous mutation. Compound heterozygous mutation pairs are indicated by superscript symbols. Each mutation combination is depicted, and certain alleles may be present in multiple combinations. The frequency of each allele in the affected population is not indicated. (E) For each gene, the color of the mutations indicates the type of mutation according to this key.
Figure 4
Figure 4
Mutations in helicase component minichromosome maintenance 5 (MCM5) and cell division cycle 45 (CDC45) cause Meier-Gorlin syndrome. Pathogenic mutations of MCM5 and CDC45 are depicted on a schematic of each gene and the crystal structure of Homo sapiens proteins. Mutations that do not have corresponding amino acids in the structure or resulted in abnormal splicing are not depicted. For a complete list of mutations and associated protein changes, see Supplementary Table S1. The structure was generated using pdb file 6xtx and the Chimera program (http://www.cgl.ucsf.edu/chimera). Exon and intron schematics were generated with the UCSD genome browser. Reference sequences are CDC45 NM_003504.4 and MCM5 NM_006739.4. (A) Crystal structure of human CDC45 with mutations depicted including missense mutations (red) and frame shift mutations (orange). Note p.115_E162del is a large deletion of exon 5, with all lost amino acids highlighted in red. (B) Crystal structure of human MCM5 with missense mutation p.T466I (c.1397C > T) depicted in red. Schematic of (C) MCM5 and (D) CDC45 genes depicted with exons as black boxes and introns as horizontal lines. Mutations are mapped to the appropriate gene regions. “H” superscript indicates a homozygous mutation. ** denotes different than reported due to different reference sequence. Compound heterozygous mutation pairs are indicated by superscript symbols. Each mutation combination is depicted, and certain alleles may be present in multiple combinations. The frequency of each allele in the affected population is not indicated. (E) For each gene, the color of the mutations indicates the type of mutation according to this key.
Figure 5
Figure 5
Mutations in downstream neighbor of son (DONSON) and geminin (GMNN) cause Meier-Gorlin syndrome. Exon and intron schematic was generated with the UCSD genome browser. Reference sequences are DONSON NM_017613.4 and GMNN NM_015895.5. Schematic of (A) DONSON and (B) GMNN genes depicted with exons as black boxes and introns as horizontal lines. Mutations are mapped to the appropriate gene regions. “H” superscript indicates a homozygous mutation. “D” superscript indicates a heterozygous dominant mutation. Compound heterozygous mutation pairs are indicated by superscript symbols. Each mutation combination is depicted, and certain alleles may be present in multiple combinations. The frequency of each allele in the affected population is not indicated. (C) For each gene, the color of the mutations indicates the type of mutation according to this key.
Figure 6
Figure 6
Minichromosome maintenance 2 heterozygous variant is linked to familial deafness. Exon and intron schematic was generated with the UCSD genome browser. Reference sequence is MCM2 NM_004526.4. Schematic of MCM2 gene is depicted with exons as black boxes and introns as horizontal lines. Missense mutation is mapped to the appropriate gene regions. “D” superscript indicates a heterozygous dominant mutation.
Figure 7
Figure 7
Natural killer cell deficiency is caused by pathogenic variants disrupting DNA replication initiation. Pathogenic mutations in replication initiation factors are depicted on a schematic of each gene and the crystal structure of either Homo sapiens or Xenopus laevis proteins. Mutations that do not have corresponding amino acids in the structure or resulted in abnormal splicing are not depicted. For a complete list of mutations and associated protein changes, see Supplementary Table S1. Structures were generated with the Chimera program (http://www.cgl.ucsf.edu/chimera). Exon and intron schematics were generated with the UCSD genome browser. Reference sequences are MCM4 NM_005914.4, MCM10 NM_018518.5 and GINS1 NM_021067.5. (A) Alignment of Homo sapiens and Xenopus laevis MCM10 was completed using UniProt alignment tool (https://www.uniprot.org/align/). Crystal structure of the internal domain of Xenopus laevis MCM10 is shown with PCNA binding peptide box in pink, heat shock protein 10 like domain in purple, and the first zinc finger in green. The Xenopus laevis amino acid corresponding to missense mutation p.R426C (c.1276C > T) is depicted in red. The structure was generated using pdb file 3ebe. (B) Missense mutation p.R83C (c.247C > T) in GINS1 is identified in red on the crystal structure of GINS complex. The structure was generated using pdb file 2q9q. Schematic of (C) MCM4, (D) MCM10 and (E) GINS1 genes depicted with exons as black boxes and introns as horizontal lines. Mutations are mapped to the appropriate gene regions. For MCM4, two additional ATG sites that result in shorter isoforms occur in exon 2. “H” superscript indicates a homozygous mutation. Compound heterozygous mutation pairs are indicated by superscript symbols. Each mutation combination is depicted, and certain alleles may be present in multiple combinations. The frequency of each allele in the affected population is not indicated. (F) For each gene, the color of the mutations indicates the type of mutation according to this key.
Figure 8
Figure 8
Pathogenic variants in pol α cause a variety of diseases with high prevalence of immunodeficiency. Pathogenic mutations in pol α subunits are depicted on a schematic of each gene and the crystal structure of Homo sapiens proteins. Mutations that do not have corresponding amino acids in the structure or resulted in abnormal splicing are not depicted. For a complete list of mutations and associated protein changes, see Supplementary Table S1. Structures were generated with the Chimera program (http://www.cgl.ucsf.edu/chimera). Exon and intron schematics were generated with the UCSD genome browser. Reference sequences are POLA1 NM_016937.4 and PRIM1 NM_000946.3. (A) Crystal structure of human pol α subunits with mutations depicted including missense mutations (red) and frame shift mutations (orange). The structure was generated using pdb file 5exr. Schematic of (B) POLA1 and (C) PRIM1 genes depicted with exons as black boxes and introns as horizontal lines. Mutations are mapped to the appropriate gene regions. Note that POLA1 is on the X chromosome and has X-linked inheritance. Boxed alleles on POLA1 schematic occur in individuals with XLPRD while the remaining mutations occur in individuals with Van Esch-O’Driscoll disease. Exons 9 and 10 of POLA1 appear as a single line in this schematic. “H” superscript indicates a homozygous mutation. Compound heterozygous mutation pairs are indicated by superscript symbols. Each mutation combination is depicted, and certain alleles may be present in multiple combinations. The frequency of each allele in the affected population is not indicated. (D) For each gene, the color of the mutations indicates the type of mutation according to this key.
Figure 9
Figure 9
Pathogenic variants in pol ε cause immunodeficiency. Pathogenic mutations in pol ε subunits are depicted on a schematic of each gene and the crystal structure of Saccharomyces cerevisiae proteins. Mutations that do not have corresponding amino acids in the structure or resulted in abnormal splicing are not depicted. For a complete list of mutations and associated protein changes, see Supplementary Table S1. Structures were generated with the Chimera program (http://www.cgl.ucsf.edu/chimera). Exon and intron schematics were generated with the UCSD genome browser. Reference sequences are POLE1 NM_006231.4 and POLE2 NM_001197331.3. (A) Alignment of Homo sapiens and Saccharomyces cerevisiae POLE1 and POLE2 was completed using UniProt alignment tool (https://www.uniprot.org/align/). Crystal structure of yeast pol ε subunits with amino acids corresponding to missense (red), nonsense mutations (red) and frame shift mutations (orange) depicted. The structure was generated using pdb file 6wjv. Schematic of (B) POLE1 and (C) POLE2 genes depicted with exons as black boxes and introns as horizontal lines. Mutations are mapped to the appropriate gene regions. Boxed alleles on POLE1 occur in individuals with FILS syndrome. “H” superscript indicates a homozygous mutation. Compound heterozygous mutation pairs are indicated by superscript symbols. Each mutation combination is depicted, and certain alleles may be present in multiple combinations such as c.1686 + 32C > G which is shared by all individuals with IMAGe syndrome. The frequency of each allele in the affected population is not indicated. (D) For each gene, the color of the mutations indicates the type of mutation according to this key.
Figure 10
Figure 10
Pathogenic variants in pol δ subunits cause human disease. Pathogenic mutations in pol δ subunits are depicted on a schematic of each gene and the crystal structure of Homo sapiens pol δ complex. Mutations that do not have corresponding amino acids in the structure or resulted in abnormal splicing are not depicted. For a complete list of mutations and associated protein changes, see Supplementary Table S1. Structures were generated with the Chimera program (http://www.cgl.ucsf.edu/chimera). Exon and intron schematics were generated with the UCSD genome browser. Reference sequences are POLD1 NM_001256849.1 and POLD2 NM_006230.4. (A) Crystal structure of human pol δ subunits with mutations depicted including missense and nonsense mutations depicted in red and frame shift mutations depicted in orange. The structure was generated using pdb file 6s1m. Schematic of (B) POLD1 and (C) POLD2 genes depicted with exons as black boxes and introns as horizontal lines. Mutations are mapped to the appropriate gene regions. Boxed alleles on POLD1 occur in individuals with immune deficiency. Note that the black circle symbol indicates mutations found together in an individual, p.Q684H and p.S939W were found in cis while p.R1074W was found in trans. Compound heterozygous mutation pairs are indicated by superscript symbols. Each mutation combination is depicted, and certain alleles may be present in multiple combinations. The frequency of each allele in the affected population is not indicated. (D) For each gene, the color of the mutations indicates the type of mutation according to this key.
Figure 11
Figure 11
PCNA pathogenic variant is on the outer surface of PCNA. Pathogenic mutation in PCNA is depicted on a schematic of the gene and crystal structure of Homo sapiens proteins. Structures were generated with the Chimera program (http://www.cgl.ucsf.edu/chimera). Exon and intron schematics were generated with the UCSD genome browser. Reference sequence is NM_002592.2. Schematic of the (A) PCNA gene is depicted with exons as black boxes and introns as horizontal lines. Missense mutation is mapped to the appropriate gene regions. “H” superscript indicates a homozygous mutation. (B) Crystal structure of human PCNA with missense mutation depicted in red. The structure was generated using pdb file 6fcm. (C) Crystal structure of human PCNA in complex with FEN1 and pol δ with missense mutation depicted in red. The structure was generated using pdb file 6tnz.
Figure 12
Figure 12
Pathogenic variants in RECQL4 are associated with three different syndromes, Rothmund–Thomson (RTS), Baller–Gerold (BGS) and RAPADILINO (RAdial hy-po/aplasia, PAellae hypo/aplasia and cleft PAlate, DIarrhea and DIslocated joint, LIttle size and LImb malformation, NOse slender and NOrmal intelligence). Mutations of RECQL4 in BGS, RAPADILINO and RTS are depicted on a schematic of the gene and crystal structure of Homo sapiens RECQL4. For a complete list of mutations and associated protein changes, see Supplementary Table S1. The structure was generated using pdb file 5lst and the Chimera program (http://www.cgl.ucsf.edu/chimera). Exon and intron schematics were generated with the UCSD genome browser. Reference sequence is RECQL4 NM_004260.4. Schematic of RECQL4 gene for (A) BGS and (B) RAPADILINO is depicted with exons as black boxes and introns as horizontal lines. Mutations are mapped to the appropriate gene regions. “H” superscript indicates a homozygous mutation. Compound heterozygous mutation pairs are indicated by superscript symbols. Each mutation combination is depicted, and certain alleles may be present in multiple combinations. The frequency of each allele in the affected population is not indicated. (C) Mutations that occur in multiple individuals with RTS are depicted. “*” indicates that these mutations occur in cis, c.1573delT does occur alone in some individuals (D) For each gene, the color of the mutations indicates the type of mutation according to this key. Crystal structure of human RECQL4 with the helicase domain highlighted in blue, missense and nonsense mutations highlighted in red and frameshift mutations highlighted in orange for (E) BGS, (F) RAPADILINO and (G) RTS. For RTS, one amino acid indicated in orange on the ribbon structure has two mutations associated with it. Mutations that do not have corresponding amino acids in the structure or resulted in abnormal splicing are not depicted.
Figure 12
Figure 12
Pathogenic variants in RECQL4 are associated with three different syndromes, Rothmund–Thomson (RTS), Baller–Gerold (BGS) and RAPADILINO (RAdial hy-po/aplasia, PAellae hypo/aplasia and cleft PAlate, DIarrhea and DIslocated joint, LIttle size and LImb malformation, NOse slender and NOrmal intelligence). Mutations of RECQL4 in BGS, RAPADILINO and RTS are depicted on a schematic of the gene and crystal structure of Homo sapiens RECQL4. For a complete list of mutations and associated protein changes, see Supplementary Table S1. The structure was generated using pdb file 5lst and the Chimera program (http://www.cgl.ucsf.edu/chimera). Exon and intron schematics were generated with the UCSD genome browser. Reference sequence is RECQL4 NM_004260.4. Schematic of RECQL4 gene for (A) BGS and (B) RAPADILINO is depicted with exons as black boxes and introns as horizontal lines. Mutations are mapped to the appropriate gene regions. “H” superscript indicates a homozygous mutation. Compound heterozygous mutation pairs are indicated by superscript symbols. Each mutation combination is depicted, and certain alleles may be present in multiple combinations. The frequency of each allele in the affected population is not indicated. (C) Mutations that occur in multiple individuals with RTS are depicted. “*” indicates that these mutations occur in cis, c.1573delT does occur alone in some individuals (D) For each gene, the color of the mutations indicates the type of mutation according to this key. Crystal structure of human RECQL4 with the helicase domain highlighted in blue, missense and nonsense mutations highlighted in red and frameshift mutations highlighted in orange for (E) BGS, (F) RAPADILINO and (G) RTS. For RTS, one amino acid indicated in orange on the ribbon structure has two mutations associated with it. Mutations that do not have corresponding amino acids in the structure or resulted in abnormal splicing are not depicted.

Similar articles

Cited by

References

    1. Chandrasekaran S., Reidy T.K., Gowen J. Fundamental Aspects of DNA Replication. IntechOpen; London, UK: 2011. Regulation of DNA Replication Origin Licensing. - DOI
    1. Courtot L., Hoffmann J.-S., Bergoglio V. The protective role of dormant origins in response to replicative stress. Int. J. Mol. Sci. 2018;19:3569. doi: 10.3390/ijms19113569. - DOI - PMC - PubMed
    1. Hiratani I., Takahashi S. DNA replication timing enters the single-cell era. Genes. 2019;10:221. doi: 10.3390/genes10030221. - DOI - PMC - PubMed
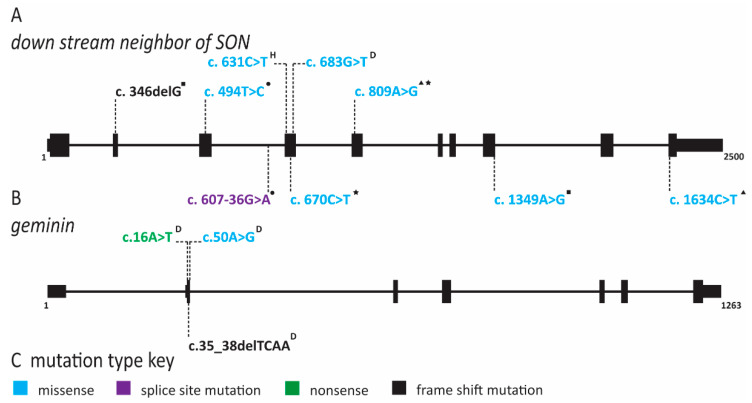
    1. Zhang J., Bellani M.A., James R.C., Pokharel D., Zhang Y., Reynolds J.J., McNee G.S., Jackson A.P., Stewart G.S., Seidman M.M. DONSON and FANCM associate with different replisomes distinguished by replication timing and chromatin domain. Nat. Commun. 2020;11:1–15. doi: 10.1038/s41467-020-17449-1. - DOI - PMC - PubMed
    1. Reynolds J.J., Bicknell L.S., Carroll P., Higgs M.R., Shaheen R., Murray J.E., Papadopoulos D.K., Leitch A., Murina O., Tarnauskaitė Ž., et al. Mutations in DONSON disrupt replication fork stability and cause microcephalic dwarfism. Nat. Genet. 2017;49:537–549. doi: 10.1038/ng.3790. - DOI - PMC - PubMed

LinkOut - more resources