. 2021 Jan 18;14(2):449.
doi: 10.3390/ma14020449.

Dependence of Heat Transport in Solids on Length-Scale, Pressure, and Temperature: Implications for Mechanisms and Thermodynamics

Affiliations

Dependence of Heat Transport in Solids on Length-Scale, Pressure, and Temperature: Implications for Mechanisms and Thermodynamics

Anne M Hofmeister. Materials (Basel). .

Abstract

Accurate laser-flash measurements of thermal diffusivity (D) of diverse bulk solids at moderate temperature (T), with thickness L of ~0.03 to 10 mm, reveal that D(T) = D (T)[1 - exp(-bL)]. When L is several mm, D (T) = FT -G + HT, where F is constant, G is ~1 or 0, and H (for insulators) is ~0.001. The attenuation parameter b = 6.19D -0.477 at 298 K for electrical insulators, elements, and alloys. Dimensional analysis confirms that D → 0 as L → 0, which is consistent with heat diffusion, requiring a medium. Thermal conductivity (κ) behaves similarly, being proportional to D. Attenuation describing heat conduction signifies that light is the diffusing entity in solids. A radiative transfer model with 1 free parameter that represents a simplified absorption coefficient describes the complex form for κ(T) of solids, including its strong peak at cryogenic temperatures. Three parameters describe κ with a secondary peak and/or a high-T increase. The strong length dependence and experimental difficulties in diamond anvil studies have yielded problematic transport properties. Reliable low-pressure data on diverse thick samples reveal a new thermodynamic formula for specific heat (∂ln(cP )/∂P = -linear compressibility), which leads to ∂ln(κ)/∂P = linear compressibility + ∂lnα/∂P, where α is thermal expansivity. These formulae support that heat conduction in solids equals diffusion of light down the thermal gradient, since changing P alters the space occupied by matter, but not by light.

Keywords: heat; infrared absorption; laser flash analysis; length-scale physics; optical thickness; pressure; radiative diffusion; temperature; transport properties.


Conflict of interest statement

The author declares no conflict of interest. The funders had no role in the design of the study; in the collection, analyses, or interpretation of data; in the writing of the manuscript, or in the decision to publish the results.

Figures

Figure 1
Figure 1
Thermal evolution in LFA (raw data) for thin samples: (a) Temperature-time curve of copper foil at 298 K, which initially heats due to the laser pulse (solid curve) and then cools to the surroundings. Raw data (grey) are fit with Cowan’s model. Black dot = position of t½. (b) Schematic of initial conditions in two parallel bars. Heavy dots represent application of a pulse. (c) Schematic of initial conditions for a blended bar, where Q = Q1 + Q2. (d) Operation essentials of LFA. Dashed box indicates the furnace enclosing the sample. Speckled rectangle depicts the edge-on the sample of thickness L. Grey shows graphite coatings. Arrows indicate arrival of laser energy and departure of emissions. Dashed arrows show fast ballistic transfer. Squiggle arrows indicate slow diffusive travel of heat across the sample. (e) Temperature–time curve of quartz at 298 K, showing a small amount of ballistic transfer, addressed by modeling (Section 3.1.2). Schematics after Figure 5a and Figure 21a,b from Criss and Hofmeister [9], which is open access.
Figure 2
Figure 2
Cowan’s model for LFA contrasted with DAC laser heating experiments: (a) Theoretical dimensionless cooling curves that assume small temperature changes and a narrow laser pulse (spike at Dt/L2 = 0) as in LFA experiments. Small radiative losses (℘ < 1) are calculated using Equation (16) without modification, whereas T-t curves for large losses (℘ = 2, 5, or 10) from (16) are rescaled with maximum temperature set near unity. Scaling provides a visual curve more like LFA data (Figure 1) and better shows the downshifting of the halftime. Dots = t½ and its multiples. (b) Temperatures (squares) ascertained by Beck et al. [30] from fitting emissions from laser heating the rear side of a 0.1 μm thick foil of iridium sandwiched between thin MgO slices in a DAC. Data were digitized and a polynomial fit was made to emissions processed at two different pressures. Unlike LFA, the laser serves as an unsteady furnace that provides a large surge in T, rather than adding an increment of heat. (c) Schematic of diamond anvil experiments on uncoated metal films. (d) Schematic of heat generated as the laser pulse penetrates and attenuates as it crosses an uncoated sample. Part (b) is modified after Beck et al. [30] with permission from AIP.
Figure 3
Figure 3
Temperature–time curves revealing fast electronic transport: (a) Raw data collected over a short time from a Fe-Ni meteorite with L = 4.59 mm at moderate T. Blue curves from [9], which is open access, used a holder and cap with apertures permitting laser light to reach the detector and/or to directly heat the thin graphite cap. Orange and green curves, offset for clarity, record emissions only from the meteorite and show electronic heat transport. (b) Long sample of electrolytic iron at high T. Purple curve shows a long duration where the sample is first heated by electrons, then cools radiatively to the surroundings, and next warms by vibrational transport. Long durations provide instabilities at long times. Both electronic T-t (inset) and vibrational evolution are fit to Cowan’s model. Pink curve shows data collected over a brief duration. Software used a large gain to meet a 1 Volt minimum signal strength, producing white noise. For long durations, wide spacing of points (inset) also produces noise. Similar Dele was obtained in [9] for other metals using short and long durations.
Figure 4
Figure 4
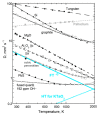
Log-log plot of thermal diffusivity vs. temperature for metals and single-crystal insulators with nearly end-member compositions, as labeled. Structures are various. Thickness, fits, and data sources are shown in Table 1. Because synthetic sapphire is thin, low T data points were not used in fitting (see below). Components of the fit for KTaO3 perovskite are shown in thick aqua solid and dotted curves.
Figure 5
Figure 5
Correlation of fitting coefficients F and G obtained using (21) for all 173 measurements compiled in [4] (Table 7.2) plus metals (Table 1; also [9,11,24,25]). Thicknesses exceed ~1 mm. Fits for anisotropic substances are made to each orientation explored. Exponential fits are provided for the various bonding types. Grainy samples (e.g., brucite, Mg(OH)2, and ceramics) fall slightly lower on the curves than similar crystals, due to porosity reducing D. Salts lie slightly below the curve for the silicates, which have ionic-covalent bonding. AgCl and metal Ti measurements were over small T-ranges, so F and G are less well constrained. Modified after Figure 7.5 in Hofmeister [4] with permissions.
Figure 6
Figure 6
Data on metals: (a) Non-adherence to the Wiedemann–Franz law. Grey = Sommerfeld’s Lorenz number for the ratio of measured κ to electrical conductivity (σ) times T, is low by a factor of 3, stemming from ETKG describing fluctuations, not heat flow down a thermal gradient [6]. Black symbols and curves = data on 7 elements from [45] (Table 14.2). These elements had at least 4 temperatures where κ and σ were independently measured. (b) Correlation of κele (obtained from measured D and electronic heat capacity) with the number of nearly free electrons. Part (b) is modified after Figure 20b in Criss and Hofmeister [9], which is open access.
Figure 7
Figure 7
Dependence of Dheat at 298 K on thickness. Fits are least squares to (22): (a) High D samples. Not shown is a point for MgO at 17.5 mm2 s−1 for L = 10.0 mm. Open plus = MgO. Circles = corundum, with black dots representing (1120) orientations. Grey dots = ceramic Al2O3. Squares = two orientations of quartz. X = Ge124 silica glass. (b) Expanded view showing low D and emphasizing thin samples. Triangles = yttrium stabilized cubic zirconia. These samples are fairly hard, permitting the preparation of sections approaching L = 0.1 mm at 5–6 mm across. Soft materials (alkali halides and micas), shown previously [4], are omitted due to difficulties in preparing very thin sections with parallel faces. Modified after Figure 7.9 in Hofmeister [4], with permission from Elsevier.
Figure 8
Figure 8
Dependence of D at 298 K on thickness for various elements and alloys: (a) Linear plot, showing fits to (22) for elements with >4 measurements over a wide range of L. Parker et al. [11] used an adiabatic model, rather than Cowan’s model used here. (b) Expanded view on logarithmic scales showing additional materials, mostly foils, and some single crystals. The power law fit is to brass and only for L < 0.5 mm. The steels are non-magnetic. Foils were obtained from Alfa/Aesar, the Washington U. Physics Department machine shop, and various other sources.
Figure 9
Figure 9
Logarithmic plot of fitting parameters in Table 2. Fused quartz and steel were not used in fitting because these measurements did not include very thin samples. High T data are shown only for MgO and YSZ.
Figure 10
Figure 10
Thermal diffusivity of cubic insulators vs. temperature for various thicknesses. Insets list samples from different sources and their thicknesses, plus fits: (a) MgO, where surface hydration is possible. Some datasets with similar thickness were merged, as indicated in the inset. The ~0.5 mm samples diverge from the power law but are still reasonably fit. (b) Yt-stabilized cubic zirconia. Colorless samples with L < 1 mm are from MTI Corp., whereas thick samples are from Morion Company. Lower D for brown colored YSZ from Pretty Rock Inc. is attributed to additional impurities. Solid lines are least squares fits to the high-T datasets using Equation (21). Data on the thinnest section is more uncertain, due to lateral size. However, even with an uncertainty of 20%, these D-values remain below trends for larger samples.
Figure 11
Figure 11
Thermal diffusivity of MgO and YSZ as a function of thicknesses at various temperatures. Insets list fits. Samples are described in Figure 10 and previously in [4,10].
Figure 12
Figure 12
Spectra in the visible (grey rectangle) and near-IR (white background) wavelength ranges relevant to laser heating of foils. Thin patterned black curves = blackbody emissions with T as labeled. Green, blue or orange curves = metal spectral properties calculated from indices of refraction tabulated in [83]. Pink vertical line = the laser wavelength. Purple horizontal bar = range of the detector used in [30,81,82]: (a) Comparison with high-T emission data (red curve) from [84] to 1-r, which is reasonable for metals, due to opacity; (b) Comparison of mean free paths (=1/A) to blackbody curves for temperatures commonly explored in laser-heating DAC studies.
Figure 13
Figure 13
Temperatures calculated in two-laser DAC experiments: (a) Example from [81], digitized and rescaled. Squares represent the front surface which absorbs the laser pulse and circles represent the rear. Conditions and T differences are listed. Y-axes limits were chosen so each T-t profile fills the graph. Platinum experiments [81] began with the rear surface being hotter (grey rectangle), which prohibits the diffusion of heat from the front to the rear but permits the travel of the laser beam. Thin black curve = laser pulse profile [81]. Since the relationship of data collection to the pulse was not specified, the laser profile was placed where the front surface began warming. Part (a) was modified after Figure 3d,f of McWilliams et al. [81], with permissions from Elsevier. (b) Temperature differences across the ~3 μm foil of Pt compared to those in experiments on iron [82], obtained from digitizing and subtracting temperature curves in [81,82]. Grey rectangle shows times where the rear surface is undesirably hotter than the front. Average T differences are rough.
Figure 14
Figure 14
Graphical representation of data compiled in Table 3. Metals and Si (red crosses) are included in the fits: (a) Comparison of values from Equation (24) to measurements of κ as a function of pressure. RbF was excluded due to uncertainites in cP [68]; (b) Dependence of ∂ln(κ)/∂P on compressibility (BT−1), excluding fused quartz where bonds bend rather than contract. In both panels, hard solids cluster. These involve small, difficult to measure, changes during compression. Soft halides have large changes, but deform and absorb water, producing systematic errors. Halides with BT < 15.5 GPa, which is accompanied by ∂lnκ/∂P > 60% GPa−1 and phase transformations at very low P, were excluded from these plots.
Figure 15
Figure 15
Calculations using (42) compared to measured transport data at pressure from Table 3. KBr exemplifies the soft, hydroscopic alkali halides (BT < 16 GPa). Reliable data on ∂B/∂T or δT were not found for Ni, Sn, or Gd.
Figure 16
Figure 16
Fits to various metals using the radiative diffusion model with two mechanisms. We assumed A~ν2 for the infrared region and A~ν for the near-IR. Parameters are listed in the inserted table. If κ had been non-dimensionalized, only 3 parameters would be needed. Fits are in black. Data (grey) are from Hust and Lackford [24], except for Al from Bradley and Radebaugh [106]. Al-1100 is an alloy with about 1% impurities, usually Si or Fe. Tungsten is sintered, with non-negligible porosity. Modified after Figure 11.10 in Hofmeister [4], with permission from Elsevier.

Similar articles

Cited by

References

    1. Hofmeister A.M., Pertermann M., Branlund J.M. Thermal conductivity of the Earth. In: Schubert G., editor. Treatise in Geophysics. Volume 2. Elsevier; Amsterdam, The Netherlands: 2007. pp. 543–578.
    1. Kellett B.S. Transmission of radiation through glass in tank furnaces. J. Soc. Glass Tech. 1952;36:115–123.
    1. Berman R., Brock J.C. The effect of isotopes on lattice heat conduction. I. Lithium fluoride. Proc. R. Soc. Lond. A. 1965;289:46–65.
    1. Hofmeister A.M. Measurements, Mechanisms, and Models of Heat Transport. Elsevier; Amsterdam, The Netherlands: 2019.
    1. Chen G. Thermal conductivity and ballistic-phonon transport in the cross-plane direction of superlattices. Phys. Rev. B. 1998;57:14985. doi: 10.1103/PhysRevB.57.14958. - DOI

LinkOut - more resources