Randomized Controlled Trial
. 2021 Jan 19;10(1):185.
doi: 10.3390/cells10010185.

Beneficial Effects of Akkermansia muciniphila Are Not Associated with Major Changes in the Circulating Endocannabinoidome but Linked to Higher Mono-Palmitoyl-Glycerol Levels as New PPARα Agonists

Affiliations
Randomized Controlled Trial

Beneficial Effects of Akkermansia muciniphila Are Not Associated with Major Changes in the Circulating Endocannabinoidome but Linked to Higher Mono-Palmitoyl-Glycerol Levels as New PPARα Agonists

Clara Depommier et al. Cells. .

Abstract

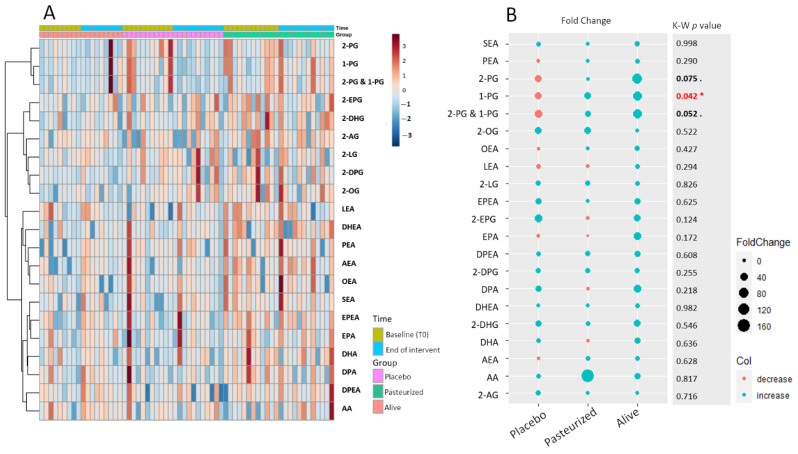
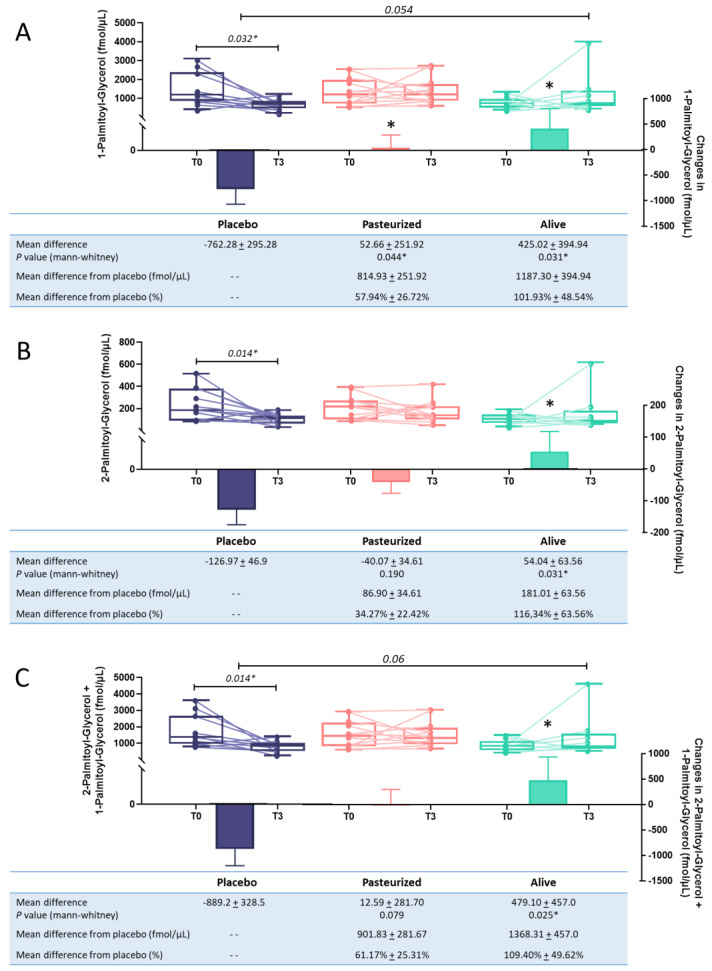
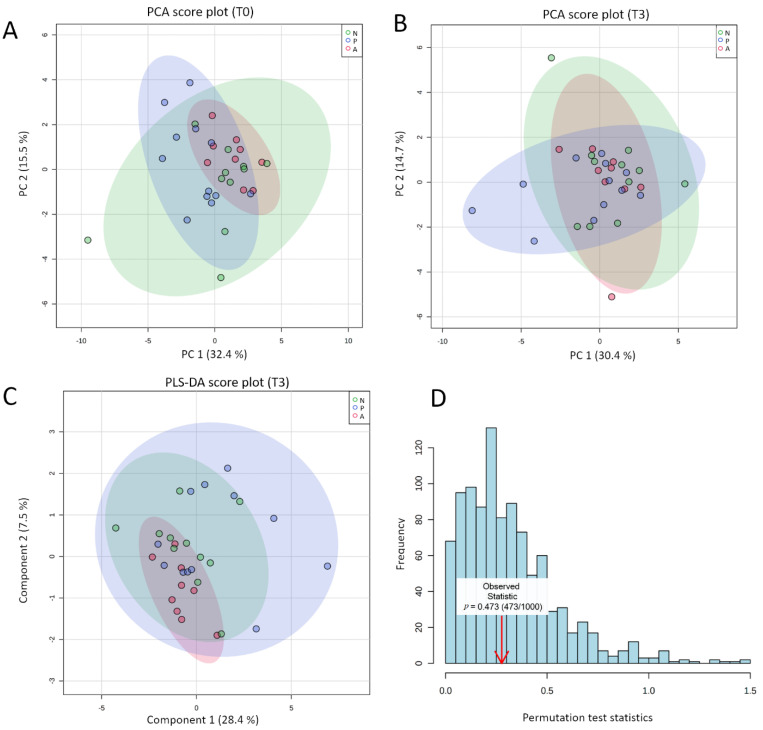
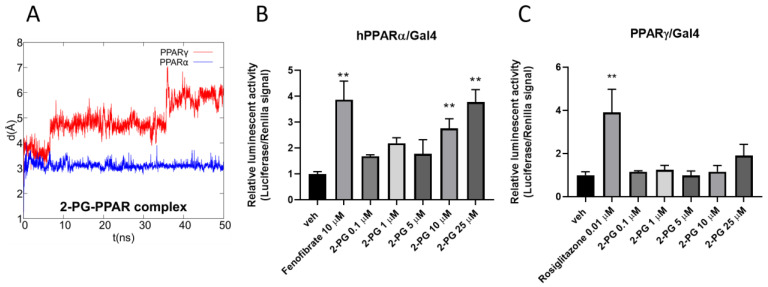
Akkermansia muciniphila is considered as one of the next-generation beneficial bacteria in the context of obesity and associated metabolic disorders. Although a first proof-of-concept of its beneficial effects has been established in the context of metabolic syndrome in humans, mechanisms are not yet fully understood. This study aimed at deciphering whether the bacterium exerts its beneficial properties through the modulation of the endocannabinoidome (eCBome). Circulating levels of 25 endogenous endocannabinoid-related lipids were quantified by liquid chromatography with tandem mass spectrometry (LC-MS/MS) in the plasma of overweight or obese individuals before and after a 3 months intervention consisting of the daily ingestion of either alive or pasteurized A. muciniphila. Results from multivariate analyses suggested that the beneficial effects of A. muciniphila were not linked to an overall modification of the eCBome. However, subsequent univariate analysis showed that the decrease in 1-Palmitoyl-glycerol (1-PG) and 2-Palmitoyl-glycerol (2-PG), two eCBome lipids, observed in the placebo group was significantly counteracted by the alive bacterium, and to a lower extent by the pasteurized form. We also discovered that 1- and 2-PG are endogenous activators of peroxisome proliferator-activated receptor alpha (PPARα). We hypothesize that PPARα activation by mono-palmitoyl-glycerols may underlie part of the beneficial metabolic effects induced by A. muciniphila in human metabolic syndrome.

Trial registration: ClinicalTrials.gov NCT02637115.

Keywords: Akkermansia muciniphila; endocannabinoidome; endocannabinoids; human; metabolic syndrome; mono-palmitoyl-glycerol; obesity; peroxisome proliferator-activated receptor alpha (PPARα).


Conflict of interest statement

P.D.C. and W.M.d.V. are co-founders of A-Mansia Biotech SA. A.E., P.D.C, C.D. (Céline Druart), W.M.d.V. are owners of patents on microbiota and metabolic diseases. C.D. (Céline Druart) is currently an employee at A-Mansia Biotech SA. The other authors declare no conflict of interest.

Figures

Figure 1
Figure 1
(A) Time-series hierarchical cluster analysis. The heat map visualized the levels of eCBome-related mediators according to each time and for each participant. Colored boxes indicate the normalized concentration of the corresponding eCB-related mediator from blue (lowest) to red (highest). Columns correspond to samples and rows to the eCB-related mediators. The algorithm for heatmap clustering was based on the Euclidean distance measure for similarity and Ward clustering algorithm. (B) Fold change in eCB-related mediators according to the group expressed in percentage. The size of the dot is proportional to the value of the fold change calculated within each group. The blue dots represent positive fold changes, meaning that the corresponding parameter had increased in average percentage following the treatment according to the baseline value, while the red dots represent negative fold changes, meaning that the corresponding parameter had decreased in average percentage following the treatment. The “K-W p-value” column shows the approximate p-value of the Kruskal–Wallis statistical test applied to the row delta taking into account the 3 groups. * Red writing: p < 0.05; bold writing 0.1 > p-value > 0.05. Placebo group, n = 11; pasteurized bacteria group, n = 12; alive bacteria group, n = 9. Abbreviations: see Table 1.
Figure 2
Figure 2
Evolution of plasmatic levels for 1-Palmitoyl-glycerol (A), 2-Palmitoyl-glycerol (B), and the combination of the 2 isomeric forms (C) following the intervention. Purple color was used for the placebo group, pink for the pasteurized group and green for the alive group. Differential values (mean difference and mean difference from placebo) are expressed as the mean ± s.e.m., either as raw data or as percentages. The “- -” in the table refers to “non applicable”. The bars represent the delta per group with the corresponding s.e.m., which corresponds to the mean difference between the value at the end of the intervention and the baseline value. Two-tailed Mann–Whitney U-tests were performed to compare the differential values of both treated groups versus the placebo group (intergroup changes). Below each plot are indicated the respective p-values and when the test is significant, the bars are marked with an asterisk. The horizontal lines represent the evolution of the raw values before and after the intervention. The box-and-whiskers plot illustrates the distribution of the raw values for each timing within each group. The line in the middle of the box is plotted at the median, while the superior and inferior limits of the box correspond to the 75th and the 25th percentiles, respectively. The whiskers correspond to the maximum and minimum values. Two-tailed matched-pairs Wilcoxon’s signed-rank tests were performed to verify changes from baseline (intragroup changes). When the difference is significant, a capped line is marked above the relevant group with the corresponding p-value. Changes between 0 and 3 months across the 3 groups were analyzed with Kruskal–Wallis test; group-wise comparisons were performed using Dunnet’s corrections for multiple testing. When the difference is close to significant, a line is marked above the relevant groups with the corresponding p-value. Placebo group, n = 11; pasteurized bacteria group, n = 12; alive bacteria group, n = 9. * p < 0.05.
Figure 3
Figure 3
(A,B) 2D PCA Score plot for comparison of the global eCBome profile at baseline (A) and following the intervention (B) according to the group. (C) 2D PLS-DA cross-validated score plot for comparison of the global eCBome profile between groups following the intervention (time 3 months). The semi-transparent area is the 95% confidence region for each group. Variance explanation (%) for each PC/component is indicated. Color code: green ellipses correspond to the placebo group; blue ellipses correspond to the pasteurized group; red ellipses correspond to the alive group, with each dot representing one participant. (D) Result of the permutation test with separation distance (B/W) select for a statistical test, set permutation numbers: 1000. Analyses and graphs were performed and generated using MetaboAnalyst v4.0 (26 November 2020). Placebo group, n = 11; pasteurized bacteria group, n = 12; alive bacteria group, n = 9. Abbreviations: A, alive; N, non-treated (Placebo); P, pasteurized; PCA, principal component analysis; PC, principal component; PLS-DA; partial least square discriminant analysis; T0, time 0 month; T3, time 3 months.
Figure 4
Figure 4
Theoretical complexes of PPARα (tan) (A) and PPARγ (light blue) (B) with 2-PG colored in dark grey and shown in ball & stick representation. Protein residues within 5 Å from the ligands are shown in stick representation. H-bonds are shown as green springs. Hydrogen, nitrogen, oxygen, and sulfur atom are painted white, blue, red, and yellow, respectively. A transparent surface for ribbons was used wherever they hide the ligand-binding site.
Figure 5
Figure 5
(A) Root-mean-square deviation (RMSD) plot of 2-PG in complex with PPARα/γ over the 50 ns of molecular dynamics (MD) trajectory after best fitting of protein backbones. Luciferase assays performed in PPARα- or PPARγ-transfected COS cells (B,C). Bar graphs showing the ratio between firefly and Renilla luciferase in response to increasing concentrations of 2-PG. Fenofibrate and rosiglitazone were used as positive controls for PPARα (B) and PPARγ (C), respectively. The vehicle group was set to 1; thus, the relative luciferase activities obtained for each tested compound and concentration are presented as fold induction in comparison to the vehicle control. Each point is the mean ± SEM of four separate determinations performed in duplicate. The double asterisk denotes a p-value ≤ 0.005 versus the vehicle group.
Figure 6
Figure 6
Theoretical complexes of PPARα (tan) with D-PG (steel blue) (A) and L-PG (slate blue) (B) with 1-PG shown in ball & stick representation. Protein residues within 5 Å from the ligands are shown in stick representation. H-bonds are shown as green springs. Hydrogen, nitrogen, oxygen, and sulfur atom are painted white, blue, red, and yellow, respectively. A transparent surface for ribbons was used wherever they hide the ligand-binding site.

References

    1. Dao M.C., Clement K. Gut microbiota and obesity: Concepts relevant to clinical care. Eur. J. Intern. Med. 2018;48:18–24. doi: 10.1016/j.ejim.2017.10.005. - DOI - PubMed
    1. Cani P.D. Human gut microbiome: Hopes, threats and promises. Gut. 2018;67:1716–1725. doi: 10.1136/gutjnl-2018-316723. - DOI - PMC - PubMed
    1. Rastelli M., Knauf C., Cani P.D. Gut Microbes and Health: A Focus on the Mechanisms Linking Microbes, Obesity, and Related Disorders. Obesity. 2018;26:792–800. doi: 10.1002/oby.22175. - DOI - PMC - PubMed
    1. Cani P.D., Everard A. Talking microbes: When gut bacteria interact with diet and host organs. Mol. Nutr. Food Res. 2016;60:58–66. doi: 10.1002/mnfr.201500406. - DOI - PMC - PubMed
    1. Belzer C., de Vos W.M. Microbes inside--from diversity to function: The case of Akkermansia. ISME J. 2012;6:1449–1458. doi: 10.1038/ismej.2012.6. - DOI - PMC - PubMed

Publication types

Supplementary concepts

Associated data

Grants and funding