. 2021 Jan 19;10(2):357.
doi: 10.3390/jcm10020357.

Transient Increase and Delay of Multifocal Electroretinograms Following Laser Photocoagulations for Diabetic Macular Edema

Affiliations

Transient Increase and Delay of Multifocal Electroretinograms Following Laser Photocoagulations for Diabetic Macular Edema

Yoshiaki Shimada et al. J Clin Med. .

Abstract

Background: The acute physiological changes induced by focal retinal photocoagulation (PC) have been largely unexplored.

Methods: This was a case-series study. We recorded multifocal electroretinograms (mfERGs) just before PC, and mfERGs were also recorded 5', 15', one hour, 24 h, and one week after the PCs. Transient changes of mfERGs were analyzed in eyes which underwent PCs to treat diabetic macular edema. The mfERGs recorded from the predominantly irradiated area and that from non-irradiated areas were analyzed separately.

Results: Fifteen eyes of 15 patients were included in this study. The mfERGs elicited from non-irradiated areas did not change after PC, but the mfERGs elicited from the irradiated area changed with time; the amplitude was larger at 60' than that before (p < 0.05) and at 5' after PC (p < 0.01) and significantly smaller at 24 h and 1 week than that before and at 60' after the PC (p < 0.01). The implicit time was significantly prolonged after PC. mfERG on irradiated area with the severe diabetic change was less altered after PCs.

Conclusions: The transient increase in the amplitude at 60' likely resulted from a biological amplification of partially damaged cells adjacent to the PC spots. The mfERGs manifested the dynamic alterations of the retinal function following PCs.

Keywords: diabetic macular edema; diabetic retinopathy; electroretinogram (ERG); multifocal electroretinogram (mfERG); photocoagulation.


Conflict of interest statement

The authors declare no conflict of interest.

Figures

Figure 1
Figure 1
Stimulus pattern superimposed on a fundus image, and distribution of multifocal electroretinograms (mfERGs) recorded at different retinal sites.
Figure 2
Figure 2
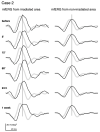
mfERGs recorded before and at different times after photocoagulation (PC). mfERGs from the irradiated area (left) and from the non-irradiated area (right) of Case 2 (same case as Figure 1) are shown. The pale curves represent the averaged normative mfERGs obtained from 8 healthy volunteers at the same loci.
Figure 3
Figure 3
mfERGs recorded from the irradiated area of five cases. The solid borders superimposed on the fundus images represent the location of the mfERGs from the irradiated areas. Dashed borders represent the non-irradiated areas. The mfERGs were unchanged throughout the recordings (not shown). The boundary regions without solid borders were excluded from the analyses. The pale mfERGs represent the mean normative mfERGs obtained from 8 healthy volunteers. Note that the PC was performed at different retinal sites in each case, and the normative mfERGs were obtained from the corresponding retinal sites.
Figure 4
Figure 4
Mean ± standard deviations over the time course of the changes in the amplitudes (a) and implicit times (b) of the mfERGs recorded from the irradiated area. Transitions, 2-combination from 6 time points; 15 comparisons were statistically analyzed by a paired t-test with Bonferroni correction. A p value less than 0.05 (*) was considered statistically significant. A p-value less than 0.01 was marked with **. Normative mfERG obtained from 8 healthy volunteers are also plotted (left most column, pale circles and error bars) to show that the mfERG from the irradiated area was altered by diabetic changes even before the PC. Normative values were not included in the statistical analysis.

References

    1. Stefánsson E. Ocular oxygenation and the treatment of diabetic retinopathy. Surv. Ophthalmol. 2006;51:364–380. doi: 10.1016/j.survophthal.2006.04.005. - DOI - PubMed
    1. Budzynski E., Smith J.H., Bryar P., Birol G., Linsenmeier R.A. Effects of photocoagulation on intraretinal PO2 in cat. Invest. Ophthalmol. Vis. Sci. 2008;49:380–389. doi: 10.1167/iovs.07-0065. - DOI - PubMed
    1. Frank R.N. Visual fields and electroretinography following extensive photocoagulation. Arch. Ophthalmol. 1975;93:591–598. doi: 10.1001/archopht.1975.01010020575004. - DOI - PubMed
    1. Ogden T.E., Callahan F., Riekhof F.T. The electroretinogram after peripheral retinal ablation in diabetic retinopathy. Am. J. Ophthalmol. 1976;81:397–402. doi: 10.1016/0002-9394(76)90293-2. - DOI - PubMed
    1. Moschos M. ERG and VER findings after laser photocoagulation of the retina. Metab. Pediatr. Syst. Ophthalmol. 1982;6:101–105. - PubMed

LinkOut - more resources