. 2021 Jan 19;9(1):199.
doi: 10.3390/microorganisms9010199.

Fecal Microbiota Transplant from Human to Mice Gives Insights into the Role of the Gut Microbiota in Non-Alcoholic Fatty Liver Disease (NAFLD)

Affiliations

Fecal Microbiota Transplant from Human to Mice Gives Insights into the Role of the Gut Microbiota in Non-Alcoholic Fatty Liver Disease (NAFLD)

Sebastian D Burz et al. Microorganisms. .

Abstract

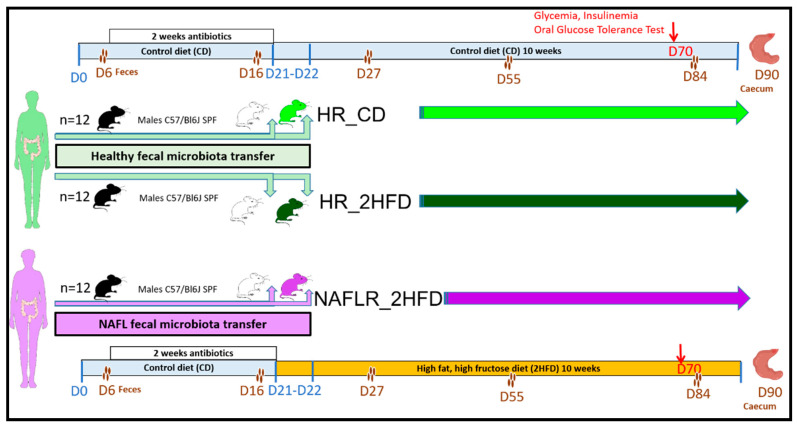
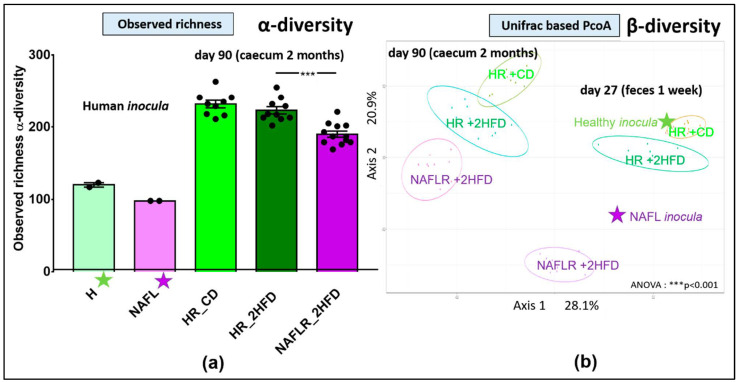
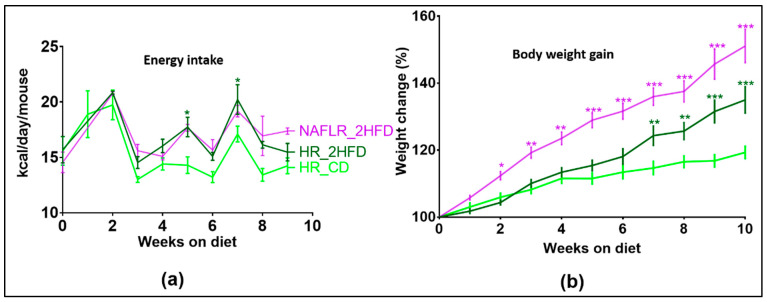
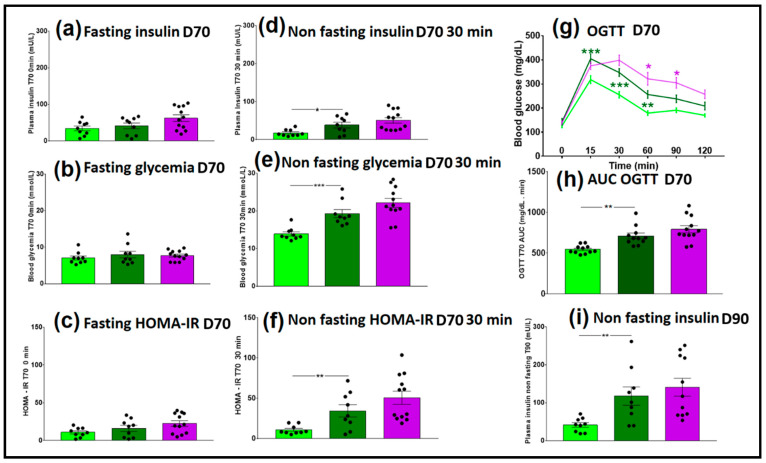
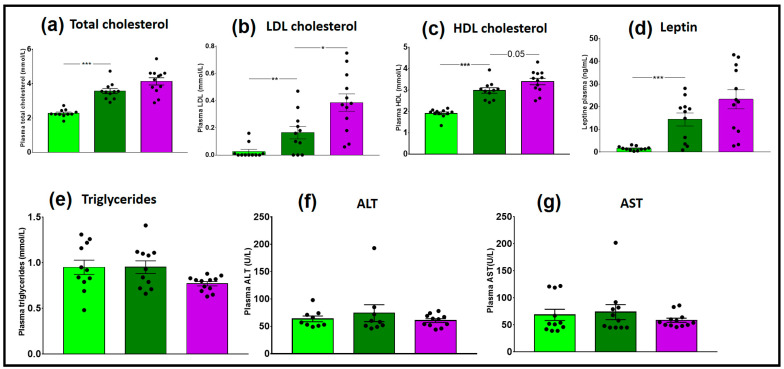
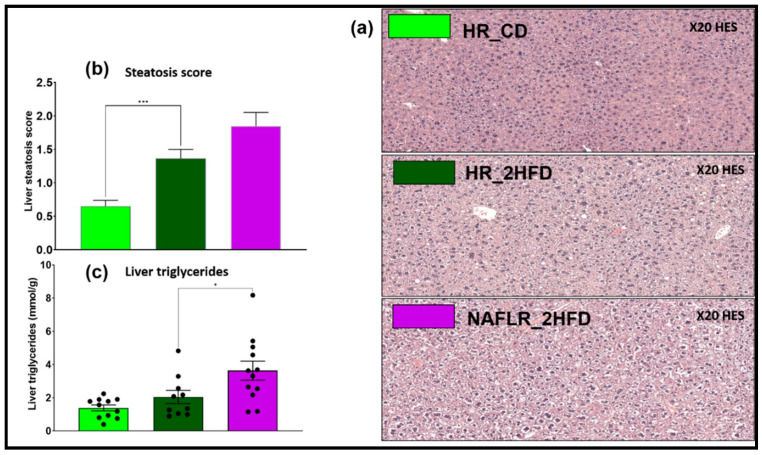
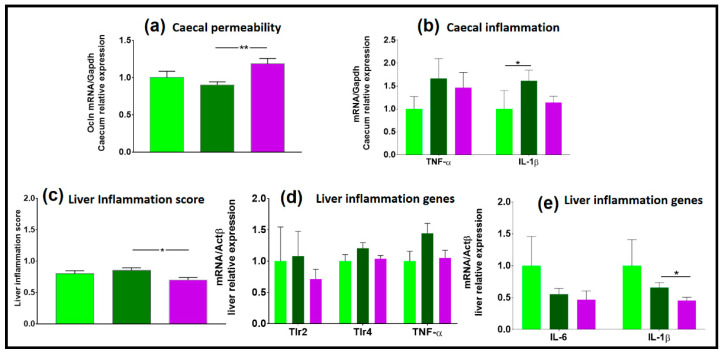
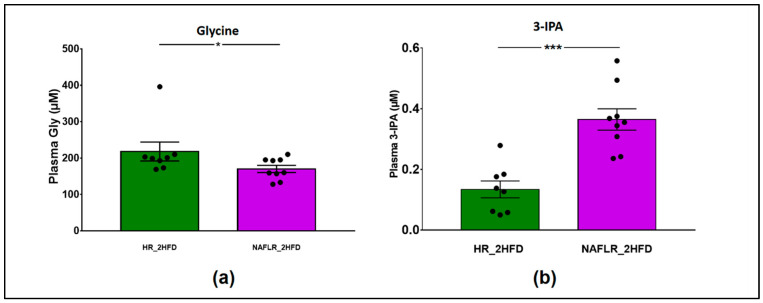
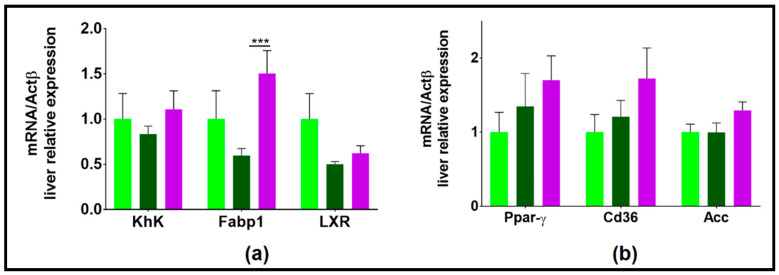
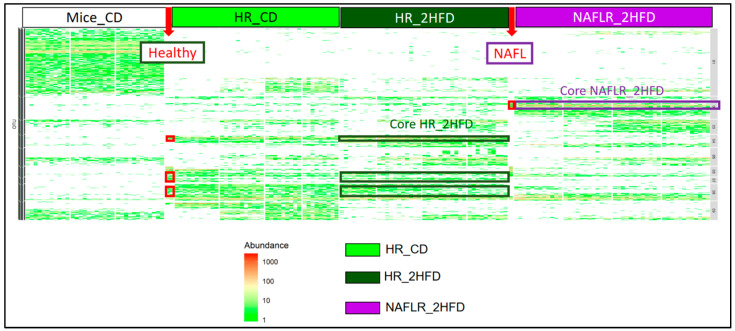
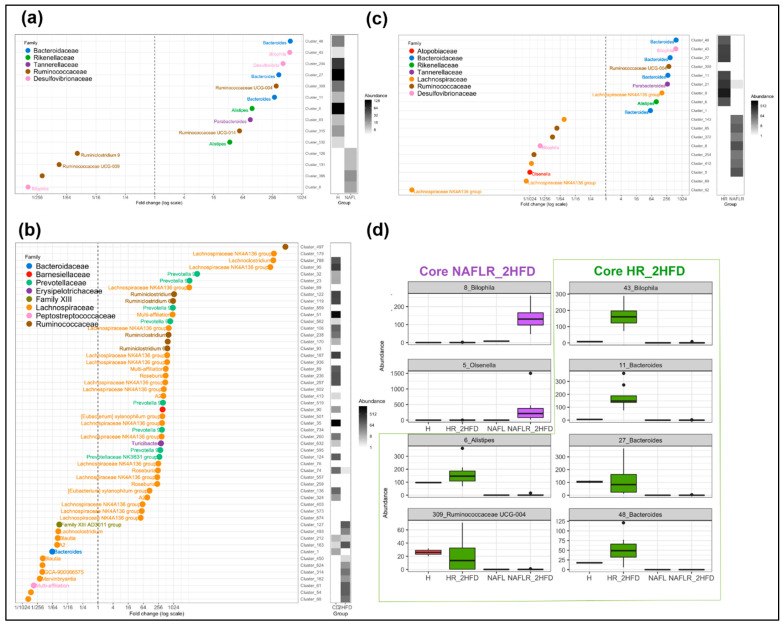
Non-alcoholic fatty liver diseases (NAFLD) are associated with changes in the composition and metabolic activities of the gut microbiota. However, the causal role played by the gut microbiota in individual susceptibility to NAFLD and particularly at its early stage is still unclear. In this context, we transplanted the microbiota from a patient with fatty liver (NAFL) and from a healthy individual to two groups of mice. We first showed that the microbiota composition in recipient mice resembled the microbiota composition of their respective human donor. Following administration of a high-fructose, high-fat diet, mice that received the human NAFL microbiota (NAFLR) gained more weight and had a higher liver triglycerides level and higher plasma LDL cholesterol than mice that received the human healthy microbiota (HR). Metabolomic analyses revealed that it was associated with lower and higher plasma levels of glycine and 3-Indolepropionic acid in NAFLR mice, respectively. Moreover, several bacterial genera and OTUs were identified as differently represented in the NAFLR and HR microbiota and therefore potentially responsible for the different phenotypes observed. Altogether, our results confirm that the gut bacteria play a role in obesity and steatosis development and that targeting the gut microbiota may be a preventive or therapeutic strategy in NAFLD management.

Keywords: NAFL; NAFLD; gut microbiome; health; high-fat diet; high-fructose; human; liver.


Conflict of interest statement

J.-M.P., W.F., F.S. and L.C. are employees of the Enterome Company. The other authors declare no conflict of interest. The funders had no role in the design of the study; in the collection, analyses, or interpretation of data; in the writing of the manuscript, or in the decision to publish the results.

Figures

Figure 1
Figure 1
Design of the mouse experiment. The experiment was performed on three groups each composed of 12 specific pathogen-free (SPF) C57BL/6J male antibiotic-treated mice: (1) healthy microbiota receiver on control diet (HR_CD) group; (2) healthy microbiota receiver on high-fructose, high-fat diet (HR_2HFD) group; (3) NAFL microbiota receiver on 2HFD (NAFLR_2HFD) group. HR, healthy human microbiota receiver mice; CD, control diet; 2HFD, high-fructose, high-fat diet; NAFLR, NAFL patient microbiota receiver mice; green woman, healthy microbiota donor; purple woman, NAFL microbiota donor; black mice, SPF mice; white mice, antibiotic-treated mice; light green mice, HR_CD mice, HR mice on CD; dark green mice, HR_2HFD mice, HR mice on 2HFD; purple mice, NAFLR_2HFD mice, NAFLR mice on 2HFD. Four brownish dots, mice feces harvest; D, day; D0, mice arrival; D6, basal SPF mice feces harvest; D16, feces harvest after 2 weeks antibiotic treatment; D21-D22, two human fecal microbiota transplants (FMTs) at 24-h intervals; D27, one week after FMT; D55, one month after FMT; D70, 7 weeks of 2HFD treatment, glycemia, insulinemia and oral glucose tolerance test; D84, two months after FMT; D90, 10 weeks of 2HFD treatment; SPF, specific pathogen-free.
Figure 2
Figure 2
16S rRNA inocula, fecal and caecal microbiome analysis. (a) Observed richness, n = 12 mice/group, *** p < 0.001 for microbiota statistical impact (NAFLR_2HFD vs. HR_2HFD). (b) Unifrac-based PcoA, ANOVA: *** p < 0.001. PcoA, principal coordinate analysis; green star, healthy human microbiota; purple star, NAFL human microbiota; HR, healthy human microbiota receiver mice; CD, control diet; 2HFD, high-fructose, high-fat diet; NAFLR, NAFL patient microbiota receiver mice; HR_CD, HR mice on CD; HR_2HFD, HR mice on 2HFD; NAFLR_2HFD, NAFLR mice on 2HFD; day 27, one week after FMT; day 90, 10 weeks after FMT.
Figure 3
Figure 3
(a) Food energy intake (kcal/day/mouse), n = 12 mice/group and (b) mice body weight gain (%) follow-up, n = 12 mice/group. HR, healthy human microbiota receiver mice; CD, control diet; 2HFD, high-fructose, high-fat diet; NAFLR, NAFL patient microbiota receiver mice; HR_CD, HR mice on CD; HR_2HFD, HR mice on 2HFD; NAFLR_2HFD, NAFLR mice on 2HFD; green (* p < 0.05, ** p < 0.01, *** p < 0.001) is used for diet impact (HR + 2HFD vs. HR + CD) statistical comparisons and purple (* p < 0.05, ** p < 0.01, *** p < 0.001) is used for microbiota impact (NAFLR_2HFD vs. HR_2HFD) statistical comparisons.
Figure 4
Figure 4
Glycemic and insulin resistance parameters of CD- and 2HFD-fed HR vs. NAFLR mice, n = 9–12 mice/group. (a) Fasting insulinemia at D70, t = 0 min Oral glucose tolerance test (OGTT); (b) fasting glycemia at D70, t = 0 min OGTT; (c) fasting Homeostasis Model Accessment of insuline resistance (HOMA-IR) at D70, t = 0 min OGTT; (d) non-fasting insulinemia at D70, t = 30 min OGTT; (e) non-fasting glycemia at D70, t = 30 min OGTT; (f) non-fasting HOMA-IR at D70, t = 30 min OGTT; (g) blood glucose follow-up during OGTT at D70; green (** p < 0.01, *** p < 0.001) is used for diet impact (HR_2HFD vs. HR_CD) and purple (* p < 0.05) is used for microbiota impact (NAFLR_2HFD vs. HR_2HFD) statistical comparisons; (h) AUC of the OGTT at D70; (i) non-fasting insulinemia at D90. HR, healthy human microbiota receiver mice; CD, control diet; 2HFD, high-fructose, high-fat diet; NAFLR, NAFL patient microbiota receiver mice; light green, HR_CD, HR mice on CD; dark green, HR_2HFD, HR mice on 2HFD; purple, NAFLR_2HFD, NAFLR mice on 2HFD; OGTT, oral glucose tolerance test; HOMA-IR, homeostatic model assessment of insulin resistance; AUC, area under the curve. D70, day 70, 7 weeks of 2HFD treatment; D90, day 90, 10 weeks of 2HFD treatment.
Figure 5
Figure 5
Plasma assay of CD- and 2HFD-fed HR vs. NAFLR mice, n = 11–12 mice/group. (a) Total cholesterol; (b) low-density lipoprotein (LDL) cholesterol; (c) high-density lipoprotein (HDL) cholesterol; (d) leptin; (e) triglycerides; (f) ALT; (g) AST. Light green, HR_CD, HR mouse on CD; dark green, HR_2HFD, HR mouse on 2HFD; purple, NAFLR_2HFD, NAFLR mice on 2HFD; LDL, low-density lipoprotein; HDL, high-density lipoprotein; ALT, alanine transaminase; AST, aspartate transaminase; HR, healthy human microbiota receiver mice; CD, control diet; 2HFD, high-fructose, high-fat diet; NAFLR, NAFL patient microbiota receiver mice; (* p < 0.05, ** p < 0.01, *** p < 0.001) were used for statistical comparisons.
Figure 6
Figure 6
Liver steatosis analysis of CD- and 2HFD-fed HR vs. NAFLR mice, n = 10–12 mice/group. (a) Liver hematoxylin-eosin staining (HES) histology observation, magnification: 20×; (b) steatosis histological scores; (c) liver triglycerides. HR, healthy human microbiota receiver mice; CD, control diet; 2HFD, high-fructose, high-fat diet; NAFLR, NAFL patient microbiota receiver mice; light green, HR_CD, HR mice on CD; dark green, HR_2HFD, HR mice on 2HFD; purple, NAFLR_2HFD, NAFLR mice on 2HFD; HES, hematoxylin-eosin staining; (* p < 0.05, *** p < 0.001) were used for statistical comparisons.
Figure 7
Figure 7
Gene expression in the caecum and in the liver, n = 12 mice/group. (a) Caecal permeability; (b) caecal inflammation; (c) liver inflammation score; (d,e) liver genes involved in inflammation. HR, healthy human microbiota receiver mice; CD, control diet; 2HFD, high-fructose, high-fat diet; NAFLR, NAFL patient microbiota receiver mice; light green, HR_CD, HR mice on CD; dark green, HR_2HFD, HR mice on 2HFD; purple, NAFLR_2HFD, NAFLR mice on 2HFD; (* p < 0.05, ** p < 0.01) were used for statistical comparisons.
Figure 8
Figure 8
Metabolomic analysis of plasma in HR_2HFD and NAFLR_2HFD mice, n = 12 mice/group. (a) Plasma glycine (µM); (b) plasma 3-IPA (µM). 3-IPA, 3-Indolepropionic acid; HR, healthy human microbiota receiver mice; CD, control diet; 2HFD, high-fructose, high-fat diet; NAFLR, NAFL patient microbiota receiver mice; light green, HR_CD, HR mice on CD; dark green, HR_2HFD, HR mice on 2HFD; purple, NAFLR_2HFD, NAFLR mice on 2HFD; (* p < 0.05, *** p < 0.001) were used for statistical comparisons.
Figure 9
Figure 9
Hepatic expression of genes involved in lipid and carbohydrate metabolisms. (a) genes whose expression tended to decrease with 2HFD and then tended to increase with NAFL microbiota (b) genes whose expression tended to increase with 2HFD and even more with NAFL microbiota; HR, healthy human microbiota receiver mice; CD, control diet; 2HFD, high-fructose, high-fat diet; NAFLR, NAFL patient microbiota receiver mice; light green, HR_CD, HR mice on CD; dark green, HR_2HFD, HR mice on 2HFD; purple, NAFLR_2HFD, NAFLR mice on 2HFD; (*** p < 0.001) was used for statistical comparisons.
Figure 10
Figure 10
Heatmap characterization of differentially abundant and prevalent operational taxonomic units (OTUs) all throughout the experiment. CD, control diet; 2HFD, high-fructose, high-fat diet; Mice_CD, mice microbiota at basal state, day 6, on CD; Healthy, healthy human microbiota; NAFL, NAFL patient microbiota; HR, healthy human microbiota receiver mice; NAFLR, NAFL patient microbiota receiver mice; HR_CD, HR on CD regimen; HR_2HFD, HR on 2HFD regimen; NAFLR_2HFD, NAFLR on 2HFD regimen.
Figure 11
Figure 11
Graphical representation of differentially abundant OTUs, having a large fold change and significant effect size in addition to high relative abundance between (a) healthy, H, and NAFL inocula; (b) HR_CD and HR_2HFD groups on day 90; (c) HR_2HFD and NAFLR_2HFD groups on day 90. Each OTU is represented by a dot and colored according to its taxonomic classification at the family level. Taxonomy at the genus or species level is also indicated, when available, next to each OTU. A logarithmic scale (log-2) was used for the x axis. (d) Core NAFLR_2HFD and Core HR_2HFD abundance through the groups, corresponding, respectively, to the OTUs differentially abundant and transferred from inocula to mice. HR, healthy human microbiota receiver mice on 2HFD; NAFLR, NAFL patient microbiota receiver mice on 2HFD; 2HFD, high-fructose, high-fat diet.

References

    1. Younossi Z.M., Tacke F., Arrese M., Sharma B.C., Mostafa I., Bugianesi E., Wong V.W.-S., Yilmaz Y., George J., Fan J., et al. Global Perspectives on Nonalcoholic Fatty Liver Disease and Nonalcoholic Steatohepatitis. Hepatology. 2019;69:2672–2682. doi: 10.1002/hep.30251. - DOI - PubMed
    1. Sender R., Fuchs S., Milo R. Are We Really Vastly Outnumbered? Revisiting the Ratio of Bacterial to Host Cells in Humans. Cell. 2016;164:337–340. doi: 10.1016/j.cell.2016.01.013. - DOI - PubMed
    1. Gaci N., Borrel G., Tottey W., O’Toole P.W., Brugère J.-F. Archaea and the human gut: New beginning of an old story. World J. Gastroenterol. 2014;20:16062–16078. doi: 10.3748/wjg.v20.i43.16062. - DOI - PMC - PubMed
    1. Lukeš J., Stensvold C.R., Jirků-Pomajbíková K., Parfrey L.W. Are Human Intestinal Eukaryotes Beneficial or Commensals? PLoS Pathog. 2015;11:e1005039. doi: 10.1371/journal.ppat.1005039. - DOI - PMC - PubMed
    1. Reyes A., Semenkovich N.P., Whiteson K., Rohwer F., Gordon J.I. Going viral: Next-generation sequencing applied to phage populations in the human gut. Nat. Rev. Genet. 2012;10:607–617. doi: 10.1038/nrmicro2853. - DOI - PMC - PubMed

LinkOut - more resources