. 2021 Jan 19;14(2):471.
doi: 10.3390/ma14020471.

Estimating a Stoichiometric Solid's Gibbs Free Energy Model by Means of a Constrained Evolutionary Strategy

Affiliations

Estimating a Stoichiometric Solid's Gibbs Free Energy Model by Means of a Constrained Evolutionary Strategy

Constantino Grau Turuelo et al. Materials (Basel). .

Abstract

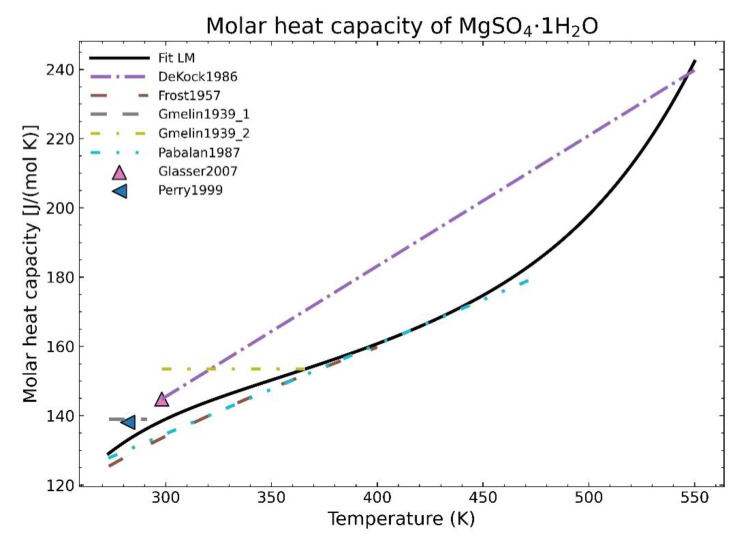
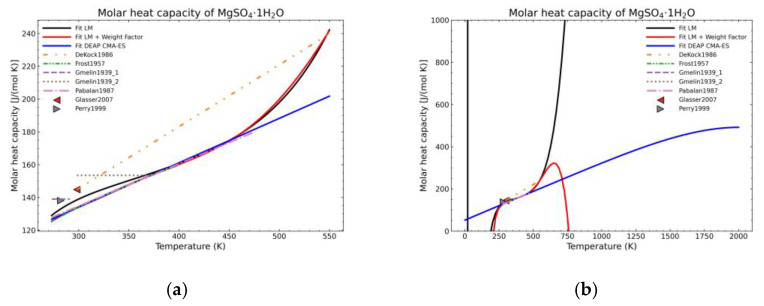
Modeling of thermodynamic properties, like heat capacities for stoichiometric solids, includes the treatment of different sources of data which may be inconsistent and diverse. In this work, an approach based on the covariance matrix adaptation evolution strategy (CMA-ES) is proposed and described as an alternative method for data treatment and fitting with the support of data source dependent weight factors and physical constraints. This is applied to a Gibb's Free Energy stoichiometric model for different magnesium sulfate hydrates by means of the NASA9 polynomial. Its behavior is proved by: (i) The comparison of the model to other standard methods for different heat capacity data, yielding a more plausible curve at high temperature ranges; (ii) the comparison of the fitted heat capacity values of MgSO4·7H2O against DSC measurements, resulting in a mean relative error of a 0.7% and a normalized root mean square deviation of 1.1%; and (iii) comparing the Van't Hoff and proposed Stoichiometric model vapor-solid equilibrium curves to different literature data for MgSO4·7H2O, MgSO4·6H2O, and MgSO4·1H2O, resulting in similar equilibrium values, especially for MgSO4·7H2O and MgSO4·6H2O. The results show good agreement with the employed data and confirm this method as a viable alternative for fitting complex physically constrained data sets, while being a potential approach for automatic data fitting of substance data.

Keywords: NASA9; constrained evolutionary strategy; data dispersion; data fitting; heat capacity; magnesium sulfate; salt hydrates; stoichiometric solid model; thermodynamic model; vapor-solid equilibrium.


Conflict of interest statement

The authors declare no conflict of interest.

Figures

Figure 1
Figure 1
Fitting of the heat capacity for the substance MgSO4·1H2O using the Levenberg-Marquardt algorithm.
Figure 2
Figure 2
Comparison of fit results from a standard LM-algorithm and the addition of weight factors (red) for: (a) Anhydrous magnesium sulfate; (b) magnesium sulfate monohydrate.
Figure 3
Figure 3
Example of two-dimensional spherical optimization problem. Points are individuals, the blue area is the solution area, and the dashed line is the dispersion calculated with the covariance matrix. Generation 1 shows the initial random distribution. Generations 2–3 show the population moving towards the detected favorable direction of the solution due to the ranking of the individuals. Higher random dispersion is expected as the algorithm looks for other possible minima in the vicinity by “mutation”. In generations 4–6, after the individuals are sufficiently dispersed, with the information of the covariance matrix, the global minimum is pinpointed and all the individuals, regardless of their initial position, converge to the final solution area.
Figure 4
Figure 4
Qualitative curve of the Debye model, the three regions indicate the application of the different established conditions.
Figure 5
Figure 5
Comparison of the different fit results of MgSO4 showing: (a) literature points region; (b) extended range until 2000 K.
Figure 6
Figure 6
Comparison of the different fit results of MgSO4·1H2O showing: (a) literature points region; (b) extended range until 2000 K.
Figure 7
Figure 7
Comparison of the different fit results of MgSO4·2H2O showing: (a) literature points region; (b) extended range until 2000 K.
Figure 8
Figure 8
Comparison of the different fit results of MgSO4·4H2O showing: (a) literature points region; (b) extended range until 2000 K.
Figure 9
Figure 9
Comparison of the different fit results of MgSO4·5H2O showing: (a) literature points region; (b) extended range until 2000 K.
Figure 10
Figure 10
Comparison of the different fit results of MgSO4·6H2O showing: (a) literature points area; (b) extended range until 2000 K.
Figure 11
Figure 11
Comparison of the different fit results of MgSO4·7H2O showing: (a) literature points region; (b) extended range until 2000 K.
Figure 12
Figure 12
Comparison of the different fit results, showing the literature data in green (mean of the values) with the 95% confidence interval boundaries of: (a) MgSO4; (b) MgSO4·1H2O.
Figure 13
Figure 13
Comparison of the different fit results, showing the literature data in green (mean of the values) with the 95% confidence interval boundaries of: (a) MgSO4·2H2O; (b) MgSO4·4H2O.
Figure 14
Figure 14
Comparison of the different fit results, showing the literature data in green (mean of the values) with the 95% confidence interval boundaries of: (a) MgSO4·6H2O; (b) MgSO4·7H2O.
Figure 15
Figure 15
Fitted results of the enthalpy curve in the literature points region for: (a) MgSO4; (b) MgSO4·1H2O.
Figure 16
Figure 16
Fitted results of the entropy curve in the literature points region for: (a) MgSO4; (b) MgSO4·1H2O.
Figure 17
Figure 17
Fitted results of the entropy curve in the literature points region for MgSO4·2H2O.
Figure 18
Figure 18
Comparison between the fitted heat capacity with the CMA-ES method and the experimental output from the DSC setup.
Figure 19
Figure 19
Temperature—vapor pressure comparison of MgSO4·7H2O between experimental data from Steiger et al. [37], Van’t Hoff curves, and the calculation of this work taking the MgSO4·7H2O as the fixed composition (black lines): (a) for a limited range to show literature points for the dehydration of MgSO4·7H2O and MgSO4·6H2O; (b) extended range to show further curves and the dehydration of MgSO4·1H2O.

References

    1. Moré J.J. Numerical Analysis. Springer; Berlin/Heidelberg, Germany: 1978. pp. 105–116.
    1. Stephan P., Schaber K., Stephan K., Mayinger F. Thermodynamik: Grundlagen und Technische Anwendungen-Band 2: Mehrstoffsysteme und Chemische Reaktionen. Springer; Berlin/Heidelberg, Germany: 2018.
    1. Sharma A., Tyagi V.V., Chen C.R., Buddhi D. Review on Thermal Energy Storage with Phase Change Materials and Applications. Renew. Sustain. Energy Rev. 2009;13:318–345. doi: 10.1016/j.rser.2007.10.005. - DOI
    1. Cabeza L.F., Castell A., Barreneche C., de Gracia A., Fernández A.I. Materials Used as PCM in Thermal Energy Storage in Buildings: A Review. Renew. Sustain. Energy Rev. 2011;15:1675–1695. doi: 10.1016/j.rser.2010.11.018. - DOI
    1. Donkers P.A.J., Sögütoglu L.C., Huinink H.P., Fischer H.R., Adan O.C.G. A Review of Salt Hydrates for Seasonal Heat Storage in Domestic Applications. Appl. Energy. 2017;199:45–68. doi: 10.1016/j.apenergy.2017.04.080. - DOI

LinkOut - more resources