

Inhibition of Amyloid β-Induced Lipid Membrane Permeation and Amyloid β Aggregation by K162
- PMID: 33478212
- PMCID: PMC7877724
- DOI: 10.1021/acschemneuro.0c00754
Inhibition of Amyloid β-Induced Lipid Membrane Permeation and Amyloid β Aggregation by K162
Abstract
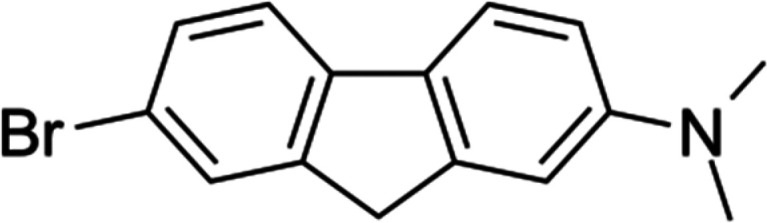
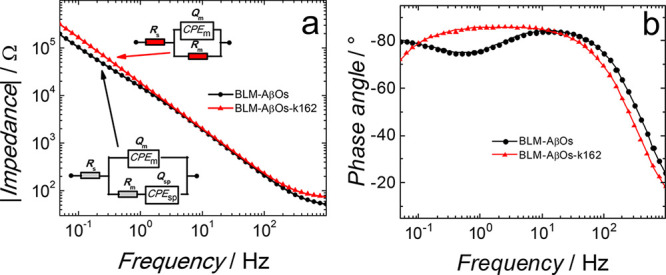
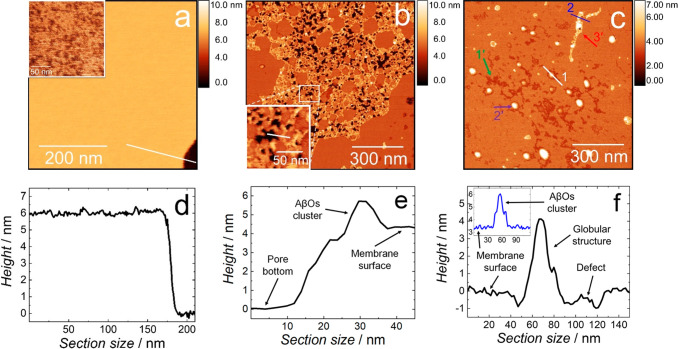
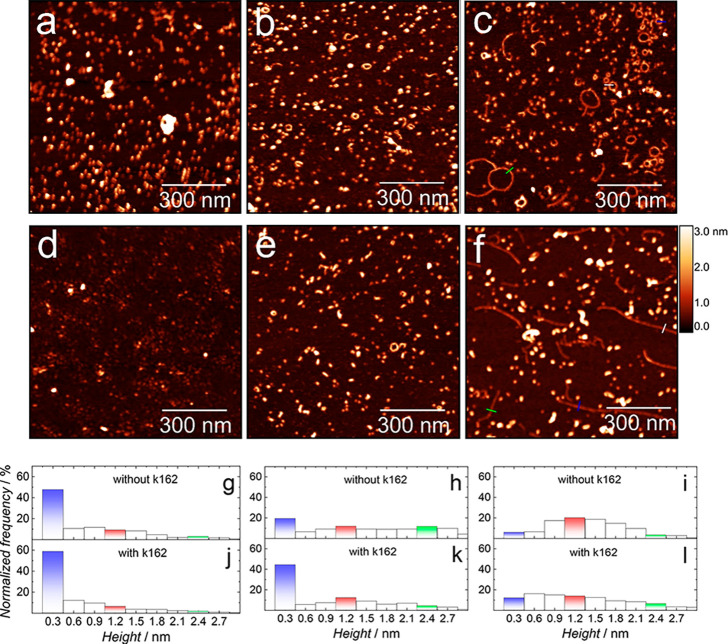
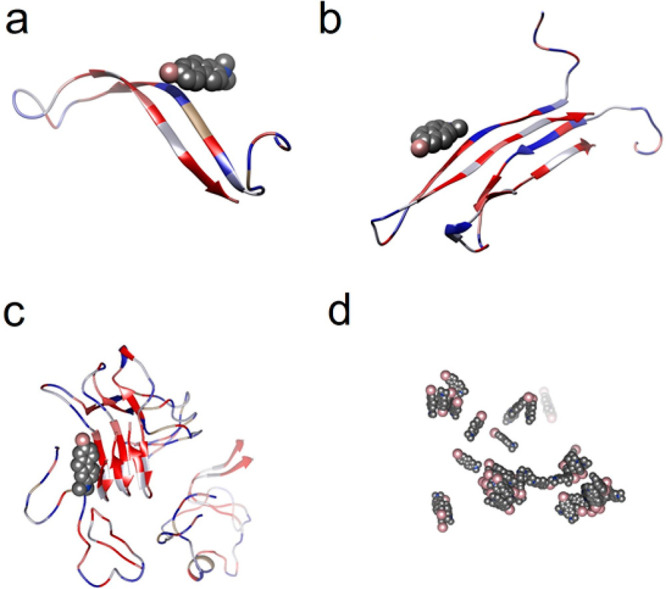
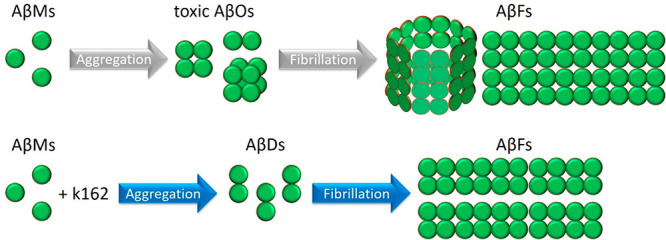
Alzheimer's disease (AD) is characterized by progressive neurodegeneration associated with amyloid β (Aβ) peptide aggregation. The aggregation of Aβ monomers (AβMs) leads to the formation of Aβ oligomers (AβOs), the neurotoxic Aβ form, capable of permeating the cell membrane. Here, we investigated the effect of a fluorene-based active drug candidate, named K162, on both Aβ aggregation and AβO toxicity toward the bilayer lipid membrane (BLM). Electrochemical impedance spectroscopy (EIS), atomic force microscopy (AFM), and molecular dynamics (MD) were employed to show that K162 inhibits AβOs-induced BLM permeation, thus preserving BLM integrity. In the presence of K162, only shallow defects on the BLM surface were formed. Apparently, K162 modifies Aβ aggregation by bypassing the formation of toxic AβOs, and only nontoxic AβMs, dimers (AβDs), and fibrils (AβFs) are produced. Unlike other Aβ toxicity inhibitors, K162 preserves neurologically beneficial AβMs. This unique K162 inhibition mechanism provides an alternative AD therapeutic strategy that could be explored in the future.
Keywords: Alzheimer’s disease; amyloid β; amyloid β aggregation; atomic force microscopy; membrane permeation; toxicity inhibition.
Conflict of interest statement
The authors declare no competing financial interest.
Figures
Similar articles
-
How do membranes initiate Alzheimer's Disease? Formation of toxic amyloid fibrils by the amyloid β-protein on ganglioside clusters.Acc Chem Res. 2014 Aug 19;47(8):2397-404. doi: 10.1021/ar500127z. Epub 2014 Jul 16. Acc Chem Res. 2014. PMID: 25029558
-
Visual and fluorescent assays for selective detection of beta-amyloid oligomers based on the inner filter effect of gold nanoparticles on the fluorescence of CdTe quantum dots.Biosens Bioelectron. 2016 Nov 15;85:625-632. doi: 10.1016/j.bios.2016.05.066. Epub 2016 May 24. Biosens Bioelectron. 2016. PMID: 27240009
-
Alzheimer's disease-related amyloid β peptide causes structural disordering of lipids and changes the electric properties of a floating bilayer lipid membrane.Nanoscale Adv. 2020 Jun 29;2(8):3467-3480. doi: 10.1039/d0na00292e. eCollection 2020 Aug 11. Nanoscale Adv. 2020. PMID: 36134289 Free PMC article.
-
Natural products targeting amyloid-β oligomer neurotoxicity in Alzheimer's disease.Eur J Med Chem. 2024 Oct 5;276:116684. doi: 10.1016/j.ejmech.2024.116684. Epub 2024 Jul 14. Eur J Med Chem. 2024. PMID: 39032401 Review.
-
Amyloid β oligomers in Alzheimer's disease pathogenesis, treatment, and diagnosis.Acta Neuropathol. 2015 Feb;129(2):183-206. doi: 10.1007/s00401-015-1386-3. Epub 2015 Jan 22. Acta Neuropathol. 2015. PMID: 25604547 Free PMC article. Review.
Cited by
-
Aggregation dynamics of a 150 kDa Aβ42 oligomer: Insights from cryo electron microscopy and multimodal analysis.Comput Struct Biotechnol J. 2024 Nov 12;23:4205-4213. doi: 10.1016/j.csbj.2024.11.024. eCollection 2024 Dec. Comput Struct Biotechnol J. 2024. PMID: 39650331 Free PMC article.
-
Mechanistic Understanding from Molecular Dynamics in Pharmaceutical Research 2: Lipid Membrane in Drug Design.Pharmaceuticals (Basel). 2021 Oct 19;14(10):1062. doi: 10.3390/ph14101062. Pharmaceuticals (Basel). 2021. PMID: 34681286 Free PMC article. Review.
-
Design of an electrochemical aptasensor in the presence of an array of gold nanostructure and a GO-MWCNTs nanocomposite: application in diagnosis of Alzheimer's disease.Mikrochim Acta. 2023 Sep 21;190(10):409. doi: 10.1007/s00604-023-05995-6. Mikrochim Acta. 2023. PMID: 37733170
-
Potential Anti-Alzheimer Agents from Guanidinyl Tryptophan Derivatives with Activities of Membrane Adhesion and Conformational Transition Inhibitions.Molecules. 2021 Aug 11;26(16):4863. doi: 10.3390/molecules26164863. Molecules. 2021. PMID: 34443456 Free PMC article.
-
"Proteinjury": a universal pathological mechanism mediated by cerebrospinal fluid in neurodegeneration and trauma.Front Cell Dev Biol. 2025 May 20;13:1593122. doi: 10.3389/fcell.2025.1593122. eCollection 2025. Front Cell Dev Biol. 2025. PMID: 40463840 Free PMC article. Review.
References
-
- Cohen S. I. A.; Cukalevski R.; Michaels T. C. T.; Šarić A.; Törnquist M.; Vendruscolo M.; Dobson C. M.; Buell A. K.; Knowles T. P. J.; Linse S. (2018) Distinct Thermodynamic Signatures of Oligomer Generation in the Aggregation of the Amyloid-β Peptide. Nat. Chem. 10 (5), 523–531. 10.1038/s41557-018-0023-x. - DOI - PMC - PubMed
-
- Flagmeier P.; De S.; Wirthensohn D. C.; Lee S. F.; Vincke C.; Muyldermans S.; Knowles T. P. J.; Gandhi S.; Dobson C. M.; Klenerman D. (2017) Ultrasensitive Measurement of Ca 2+ Influx into Lipid Vesicles Induced by Protein Aggregates. Angew. Chem., Int. Ed. 56 (27), 7750–7754. 10.1002/anie.201700966. - DOI - PMC - PubMed
Publication types
MeSH terms
Substances
LinkOut - more resources
Full Text Sources
Other Literature Sources
Medical
Miscellaneous
