

Transcriptomic profiling of wheat near-isogenic lines reveals candidate genes on chromosome 3A for pre-harvest sprouting resistance
- PMID: 33478384
- PMCID: PMC7818928
- DOI: 10.1186/s12870-021-02824-x
Transcriptomic profiling of wheat near-isogenic lines reveals candidate genes on chromosome 3A for pre-harvest sprouting resistance
Abstract
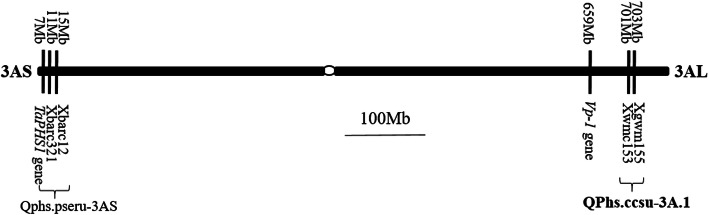
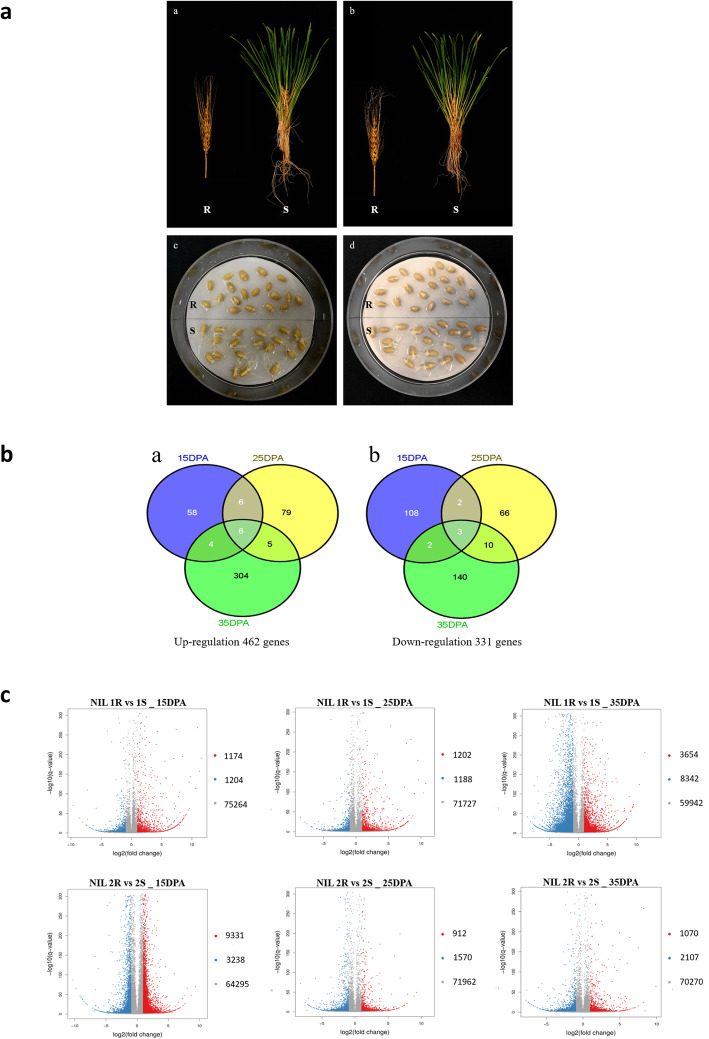
Background: Pre-harvest sprouting (PHS) in wheat can cause severe damage to both grain yield and quality. Resistance to PHS is a quantitative trait controlled by many genes located across all 21 wheat chromosomes. The study targeted a large-effect quantitative trait locus (QTL) QPhs.ccsu-3A.1 for PHS resistance using several sets previously developed near-isogenic lines (NILs). Two pairs of NILs with highly significant phenotypic differences between the isolines were examined by RNA sequencing for their transcriptomic profiles on developing seeds at 15, 25 and 35 days after pollination (DAP) to identify candidate genes underlying the QTL and elucidate gene effects on PHS resistance. At each DAP, differentially expressed genes (DEGs) between the isolines were investigated.
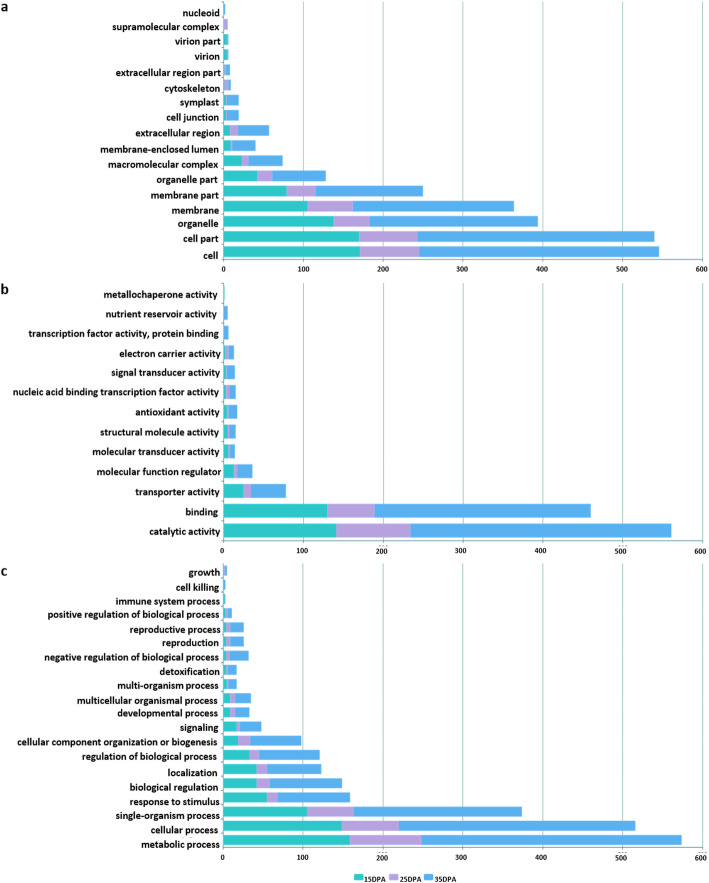
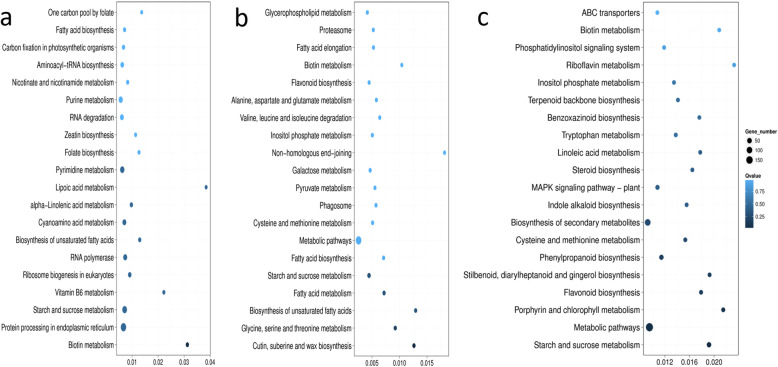
Results: Gene ontology and KEGG pathway enrichment analyses of key DEGs suggested that six candidate genes underlie QPhs.ccsu-3A.1 responsible for PHS resistance in wheat. Candidate gene expression was further validated by quantitative RT-PCR. Within the targeted QTL interval, 16 genetic variants including five single nucleotide polymorphisms (SNPs) and 11 indels showed consistent polymorphism between resistant and susceptible isolines.
Conclusions: The targeted QTL is confirmed to harbor core genes related to hormone signaling pathways that can be exploited as a key genomic region for marker-assisted selection. The candidate genes and SNP/indel markers detected in this study are valuable resources for understanding the mechanism of PHS resistance and for marker-assisted breeding of the trait in wheat.
Keywords: Marker-assisted selection; Near-isogenic lines; Pre-harvest sprouting; RNA sequencing; Wheat.
Conflict of interest statement
The authors declare that they have no competing interests for this research.
Figures
Similar articles
-
Phenotypic and genotypic characterization of near-isogenic lines targeting a major 4BL QTL responsible for pre-harvest sprouting in wheat.BMC Plant Biol. 2019 Aug 9;19(1):348. doi: 10.1186/s12870-019-1961-1. BMC Plant Biol. 2019. PMID: 31399046 Free PMC article.
-
Identification of candidate genes, regions and markers for pre-harvest sprouting resistance in wheat (Triticum aestivum L.).BMC Plant Biol. 2014 Nov 29;14:340. doi: 10.1186/s12870-014-0340-1. BMC Plant Biol. 2014. PMID: 25432597 Free PMC article.
-
Identification of loci for pre-harvest sprouting resistance in the highly dormant spring wheat RL4137.Theor Appl Genet. 2021 Jan;134(1):113-124. doi: 10.1007/s00122-020-03685-y. Epub 2020 Oct 1. Theor Appl Genet. 2021. PMID: 33001261
-
Genetic Improvement of Wheat with Pre-Harvest Sprouting Resistance in China.Genes (Basel). 2023 Mar 30;14(4):837. doi: 10.3390/genes14040837. Genes (Basel). 2023. PMID: 37107595 Free PMC article. Review.
-
Review: Revealing the genetic mechanisms of pre-harvest sprouting in hexaploid wheat (Triticum aestivum L.).Plant Sci. 2019 Apr;281:180-185. doi: 10.1016/j.plantsci.2019.01.004. Epub 2019 Jan 9. Plant Sci. 2019. PMID: 30824050 Review.
Cited by
-
Transcriptome Analyses of Near Isogenic Lines Reveal Putative Drought Tolerance Controlling Genes in Wheat.Front Plant Sci. 2022 Mar 29;13:857829. doi: 10.3389/fpls.2022.857829. eCollection 2022. Front Plant Sci. 2022. PMID: 35422827 Free PMC article.
-
Comparative transcriptome and genome analysis between susceptible Zhefang rice variety Diantun 502 and its resistance variety Diantun 506 upon Magnaporthe oryzae infection.BMC Plant Biol. 2025 Mar 17;25(1):341. doi: 10.1186/s12870-025-06357-5. BMC Plant Biol. 2025. PMID: 40091040 Free PMC article.
-
Comparative transcriptomic analysis provides insights into the molecular basis underlying pre-harvest sprouting in rice.BMC Genomics. 2022 Nov 24;23(1):771. doi: 10.1186/s12864-022-08998-4. BMC Genomics. 2022. PMID: 36434522 Free PMC article.
-
Genome-wide association mapping and genomic prediction for pre‑harvest sprouting resistance, low α-amylase and seed color in Iranian bread wheat.BMC Plant Biol. 2022 Jun 17;22(1):300. doi: 10.1186/s12870-022-03628-3. BMC Plant Biol. 2022. PMID: 35715737 Free PMC article.
-
Unraveling Allelic Impacts on Pre-Harvest Sprouting Resistance in TaVP1-B of Chinese Wheat Accessions Using Pan-Genome.Plants (Basel). 2025 Feb 7;14(4):504. doi: 10.3390/plants14040504. Plants (Basel). 2025. PMID: 40006763 Free PMC article.
References
-
- Black MBJ, Halmer P. Preharvest sprouting – economic importance. In: Black M, editor. The encyclopaedia of seeds science, technology and uses. Oxfordshire: CABI Publishing; 2006. p. 528.
-
- Biddulph TB, Plummer JA, Setter TL, Mares DJ. Influence of high temperature and terminal moisture stress on dormancy in wheat (Triticum aestivum L.) Field Crops Res. 2007;103(2):139–153. doi: 10.1016/j.fcr.2007.05.005. - DOI
-
- Chao S, Elias E, Benscher D, Ishikawa G, Huang Y, Saito M, Nakamura T, Xu S, Faris J, Sorrells M. Genetic mapping of major-effect seed dormancy quantitative trait loci on chromosome 2B using recombinant substitution lines in tetraploid wheat. Crop Sci. 2015;55(1):1–14. doi: 10.2135/cropsci2014.03.0249. - DOI
MeSH terms
Substances
Grants and funding
LinkOut - more resources
Full Text Sources
Other Literature Sources
