

A nomogram based on pretreatment levels of serum bilirubin and total bile acid levels predicts survival in colorectal cancer patients
- PMID: 33478423
- PMCID: PMC7818769
- DOI: 10.1186/s12885-021-07805-9
A nomogram based on pretreatment levels of serum bilirubin and total bile acid levels predicts survival in colorectal cancer patients
Abstract
Background: Serum bilirubin and total bile acid (TBA) levels have been reported to be strongly associated with the risk and prognosis of certain cancers. Here, we aimed to investigate the effects of pretreatment levels of serum bilirubin and bile acids on the prognosis of patients with colorectal cancer (CRC).
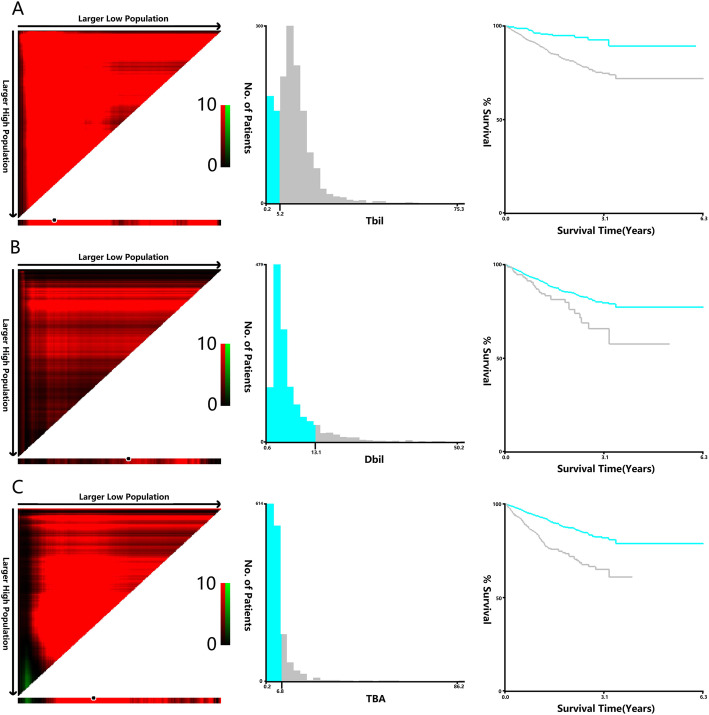
Methods: A retrospective cohort of 1474 patients with CRC who underwent surgical resection between January 2015 and December 2017 was included in the study. Survival analysis was used to evaluate the predictive value of pretreatment levels of bilirubin and bile acids. X-Tile software was used to identify optimal cut-off values for total bilirubin (TBIL), direct bilirubin (DBIL) and TBA in terms of overall survival (OS) and disease-free survival (DFS).
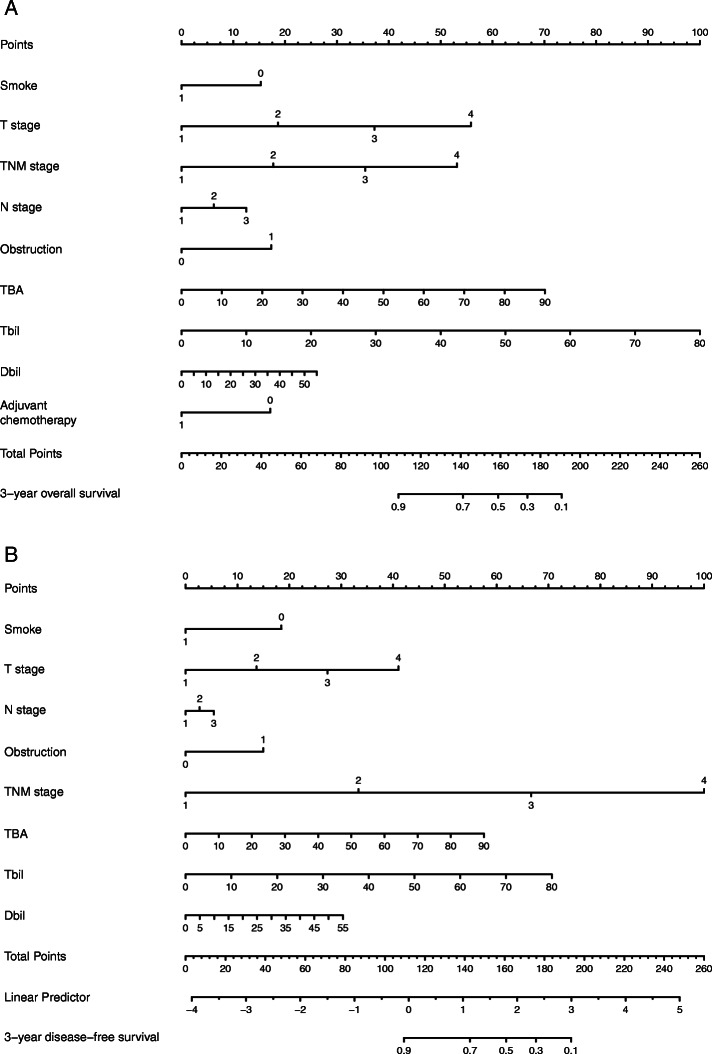
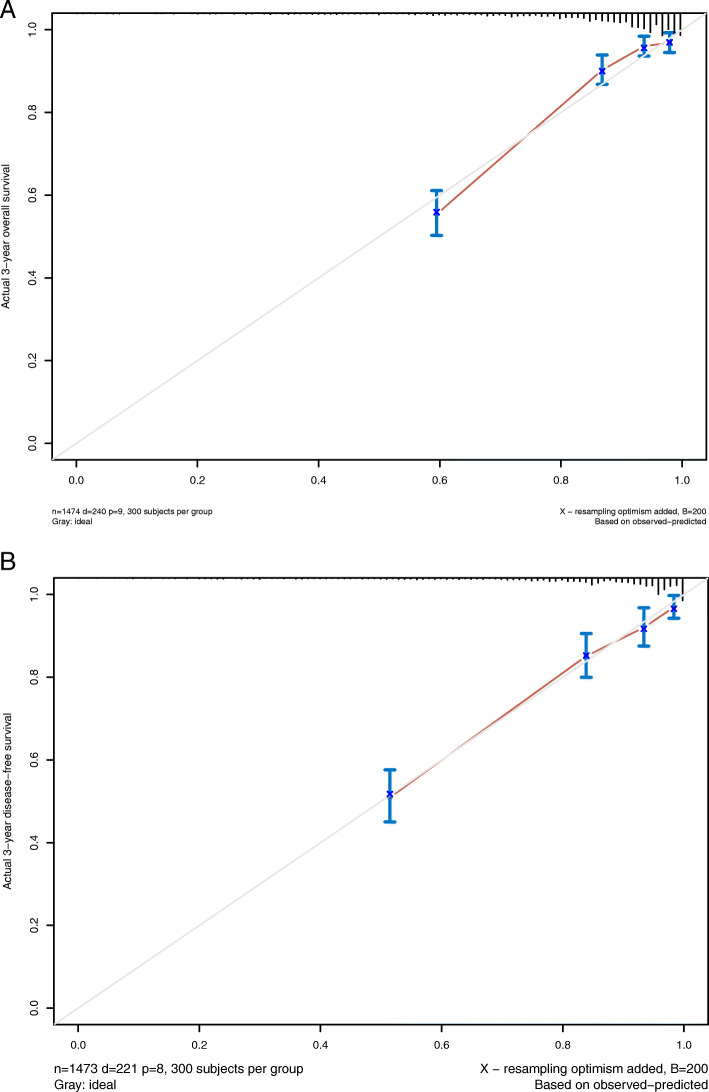
Results: DBIL, TBIL, and TBA were validated as significant prognostic factors by univariate Cox regression analysis for both 3-year OS and DFS. Multivariate Cox regression analyses confirmed that high DBIL, TBIL and TBA levels were independent prognostic factors for both OS (HR: 0.435, 95% CI: 0.299-0.637, P < 0.001; HR: 0.436, 95% CI: 0.329-0.578, P < 0.001; HR: 0.206, 95% CI: 0.124-0.341, P < 0.001, respectively) and DFS (HR: 0.583, 95% CI: 0.391-0.871, P = 0.008; HR:0.437,95% CI: 0.292-0.655, P <0.001; HR: 0.634, 95% CI: 0.465-0.865, P = 0.004, respectively). In addition, nomograms for OS and DFS were established according to all significant factors, and the c-indexes were 0.819 (95% CI: 0.806-0.832) and 0.835 (95% CI: 0.822-0.849), respectively.
Conclusions: TBIL, DBIL and TBA levels are independent prognostic factors in colorectal cancer patients. The nomograms based on OS and DFS can be used as a practical model for evaluating the prognosis of CRC patients.
Keywords: Colorectal cancer; Direct bilirubin; Survival analysis; Total bile acid; Total bilirubin.
Conflict of interest statement
The authors declare that they have no competing interests.
Figures

Similar articles
-
The prognostic impact of serum bilirubin in stage IV colorectal cancer patients.J Clin Lab Anal. 2018 Feb;32(2):e22272. doi: 10.1002/jcla.22272. Epub 2017 Nov 23. J Clin Lab Anal. 2018. PMID: 29168585 Free PMC article.
-
Nomograms incorporated serum direct bilirubin level for predicting prognosis in stages II and III colorectal cancer after radical resection.Oncotarget. 2016 Aug 19;8(41):71138-71146. doi: 10.18632/oncotarget.11424. eCollection 2017 Sep 19. Oncotarget. 2016. PMID: 29050349 Free PMC article.
-
An Oxidative Stress Index-Based Score for Prognostic Prediction in Colorectal Cancer Patients Undergoing Surgery.Oxid Med Cell Longev. 2021 Jan 9;2021:6693707. doi: 10.1155/2021/6693707. eCollection 2021. Oxid Med Cell Longev. 2021. PMID: 33505587 Free PMC article.
-
Performance of prediction models on survival outcomes of colorectal cancer with surgical resection: A systematic review and meta-analysis.Surg Oncol. 2019 Jun;29:196-202. doi: 10.1016/j.suronc.2019.05.014. Epub 2019 May 20. Surg Oncol. 2019. PMID: 31196488
-
Diagnostic and Prognostic Value of Serum Interleukin-6 in Colorectal Cancer.Medicine (Baltimore). 2016 Jan;95(2):e2502. doi: 10.1097/MD.0000000000002502. Medicine (Baltimore). 2016. PMID: 26765465 Free PMC article. Review.
Cited by
-
Association of clinical characteristics and recurrence of conventional colorectal adenomas with patient age: a single-center study.Surg Endosc. 2023 Nov;37(11):8373-8383. doi: 10.1007/s00464-023-10352-y. Epub 2023 Sep 13. Surg Endosc. 2023. PMID: 37704793
-
A Novel Systematic Oxidative Stress Score Predicts the Survival of Patients with Early-Stage Lung Adenocarcinoma.Cancers (Basel). 2023 Mar 11;15(6):1718. doi: 10.3390/cancers15061718. Cancers (Basel). 2023. PMID: 36980604 Free PMC article.
-
Emerging role of bile acids in colorectal liver metastasis: From molecular mechanism to clinical significance (Review).Int J Oncol. 2025 Mar;66(3):24. doi: 10.3892/ijo.2025.5730. Epub 2025 Feb 21. Int J Oncol. 2025. PMID: 39981904 Free PMC article. Review.
-
Prognostic model for the prediction of cancer-specific survival in elderly patients with stage I-III gastric cancer.Am J Transl Res. 2023 May 15;15(5):3188-3202. eCollection 2023. Am J Transl Res. 2023. PMID: 37303666 Free PMC article.
-
Predictive Value of the Total Bilirubin and CA50 Screened Based on Machine Learning for Recurrence of Bladder Cancer Patients.Cancer Manag Res. 2024 May 31;16:537-546. doi: 10.2147/CMAR.S457269. eCollection 2024. Cancer Manag Res. 2024. PMID: 38835478 Free PMC article.
References
-
- Da RP. Quality focus: trends in incidence and mortality of early age onset colorectal Cancer in South Dakota. S D Med. 2020;73(3):139. - PubMed
-
- Dikken JL, van de Velde CJ, Gonen M, Verheij M, Brennan MF, Coit DG. The new American joint committee on Cancer/International Union against Cancer staging system for adenocarcinoma of the stomach: increased complexity without clear improvement in predictive accuracy. Ann Surg Oncol. 2012;19(8):2443–2451. doi: 10.1245/s10434-012-2403-6. - DOI - PMC - PubMed
MeSH terms
Substances
Grants and funding
LinkOut - more resources
Full Text Sources
Other Literature Sources
Medical
