. 2021 Jan 21;6(55):eabe4782.
doi: 10.1126/sciimmunol.abe4782.

Severely ill COVID-19 patients display impaired exhaustion features in SARS-CoV-2-reactive CD8+ T cells

Affiliations

Severely ill COVID-19 patients display impaired exhaustion features in SARS-CoV-2-reactive CD8+ T cells

Anthony Kusnadi et al. Sci Immunol. .

Abstract

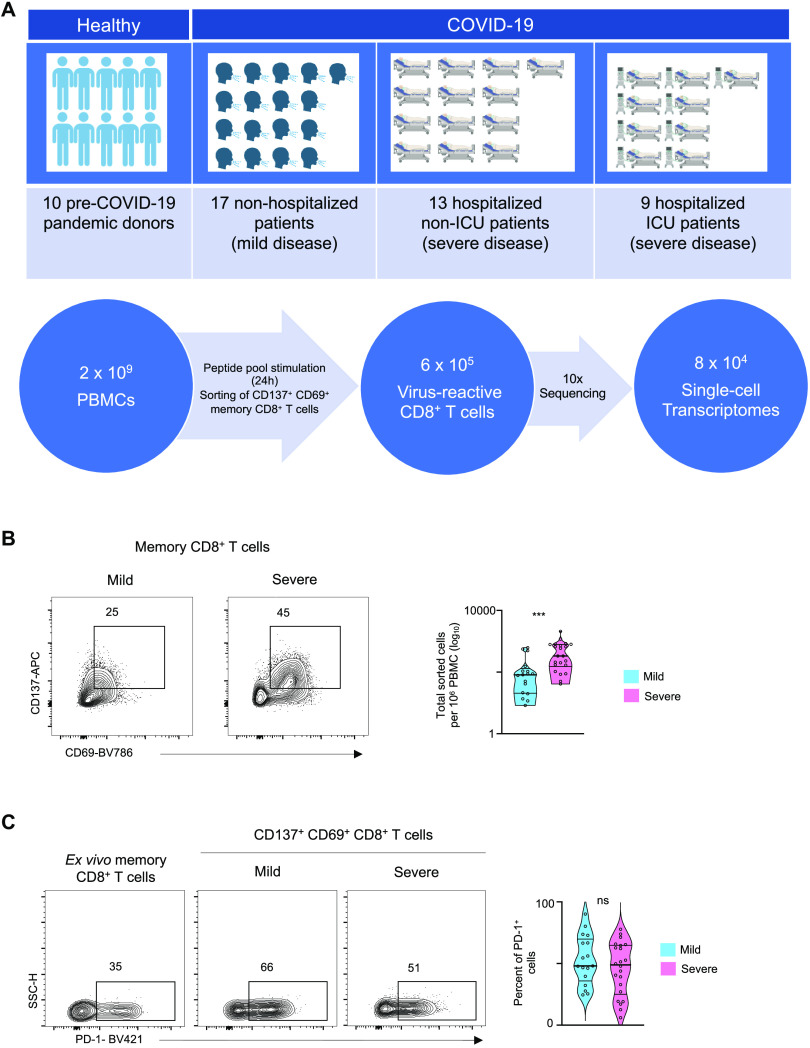
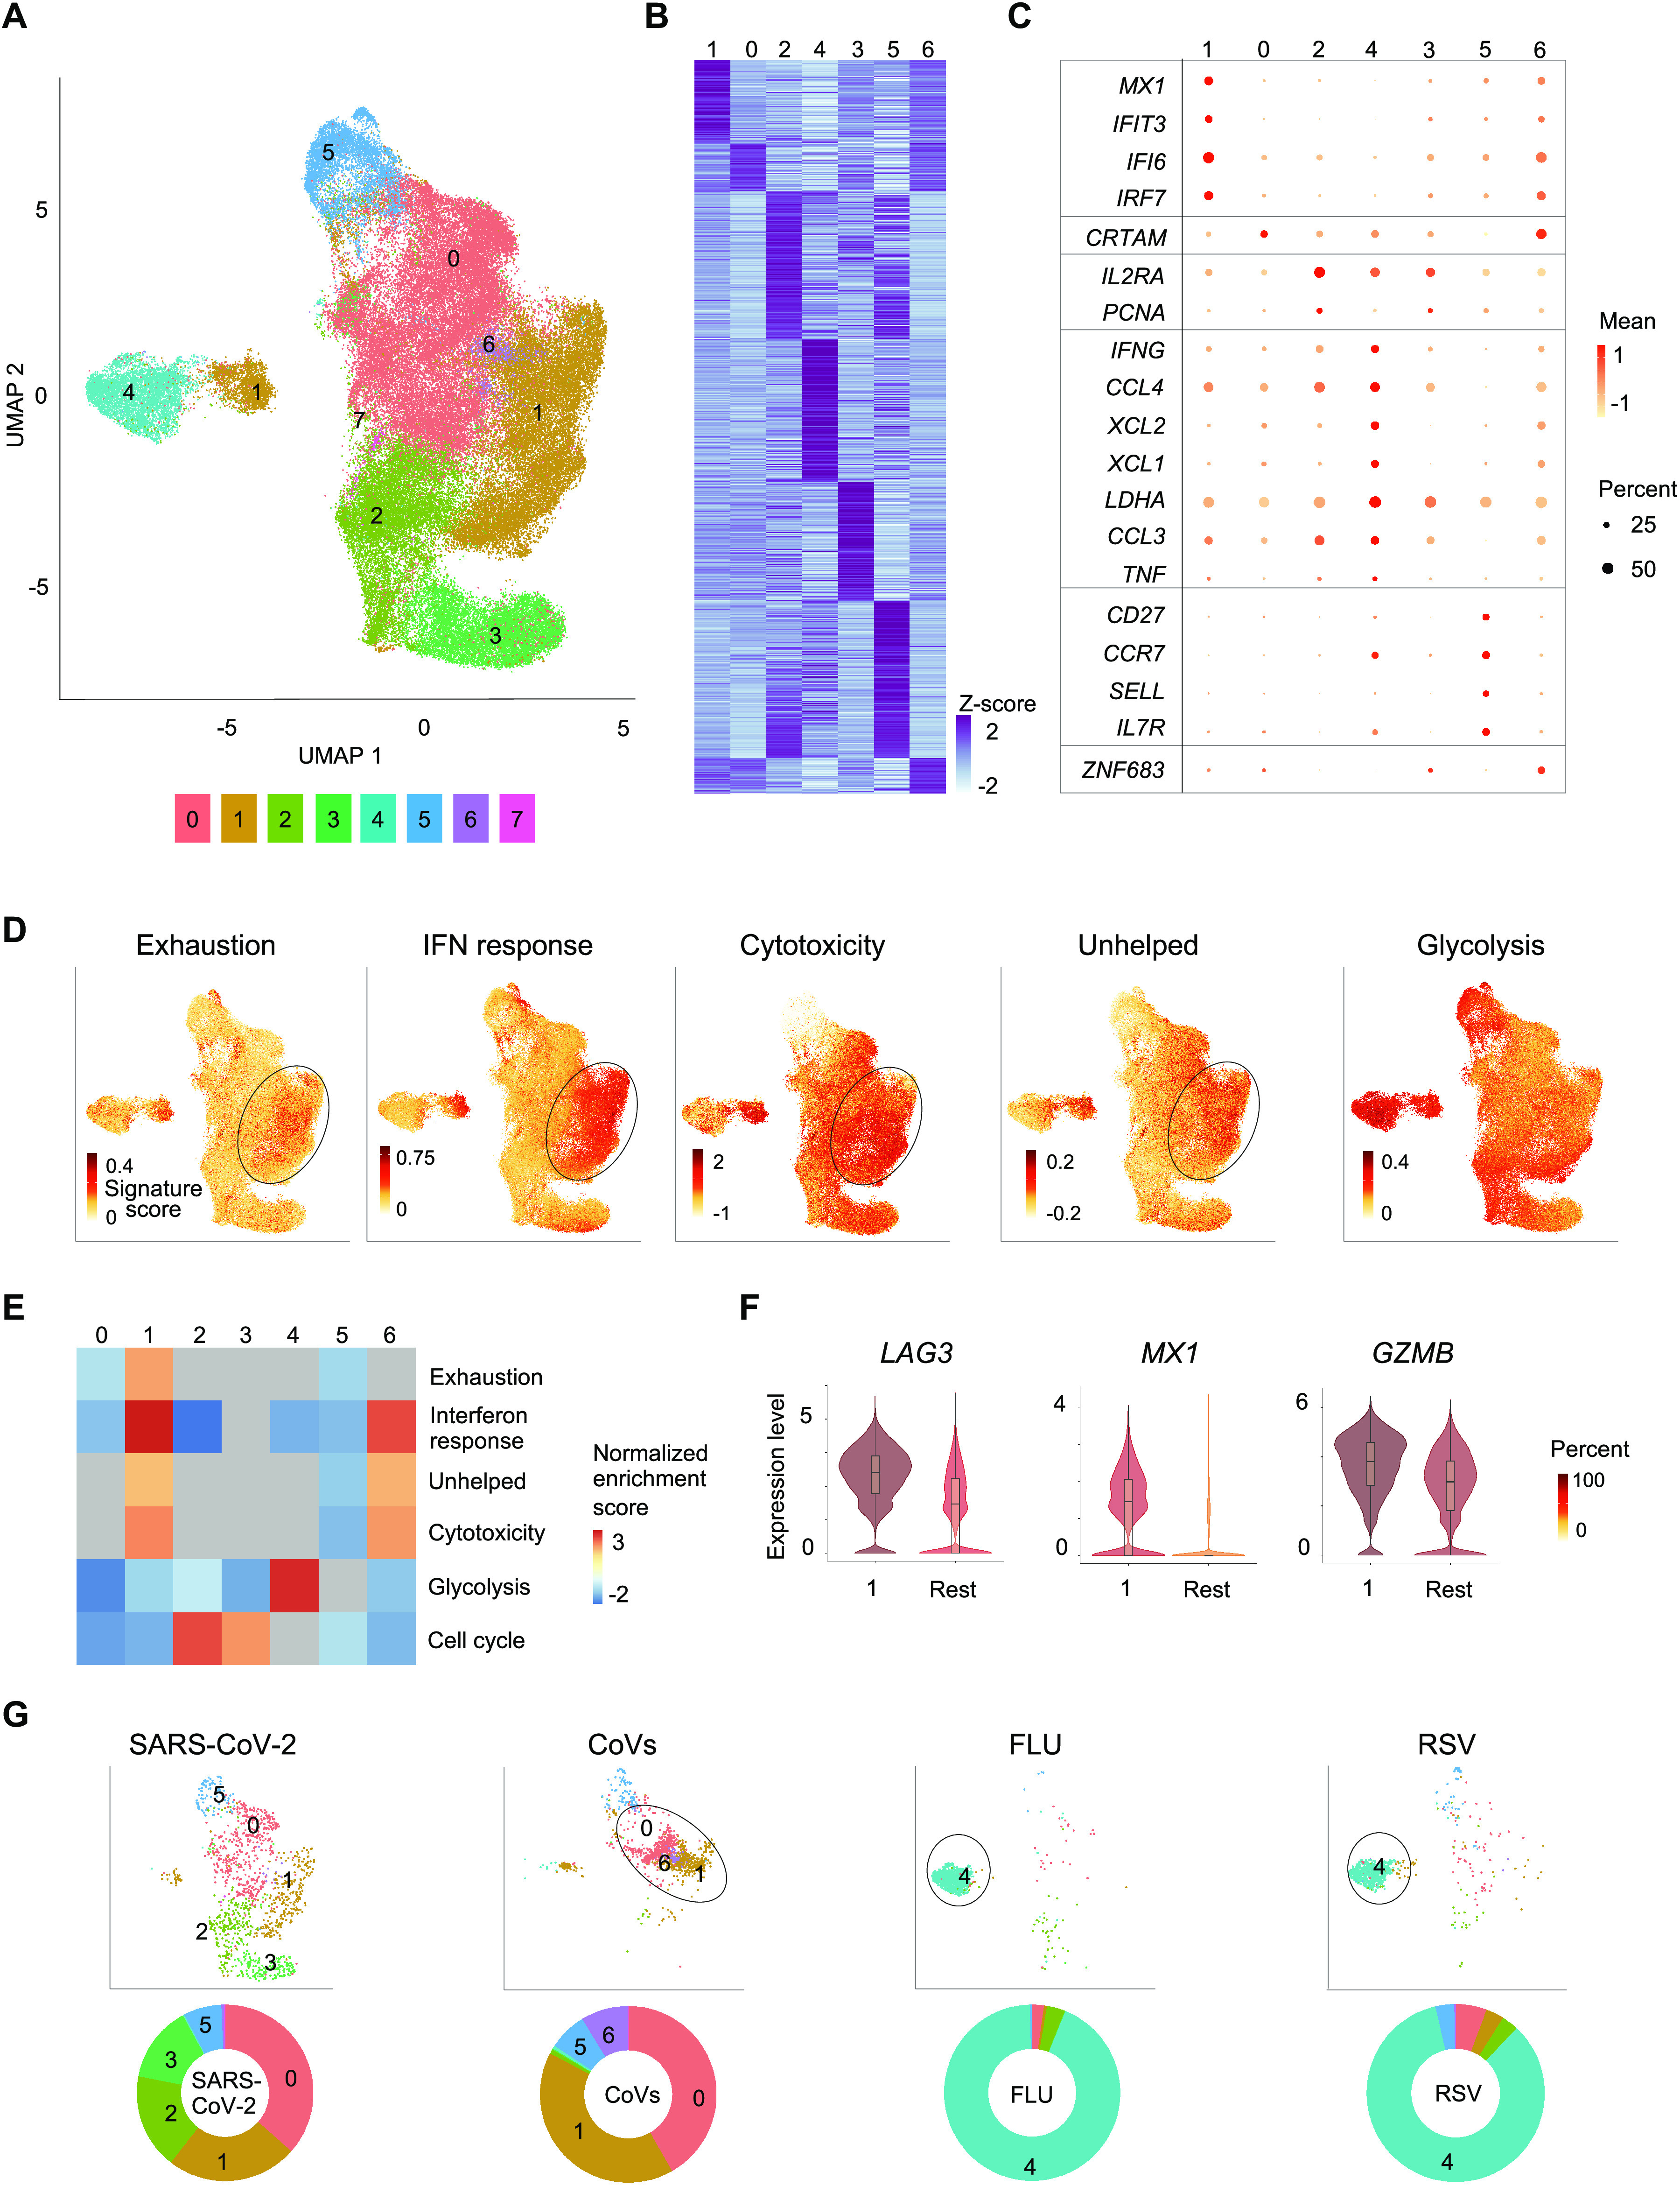
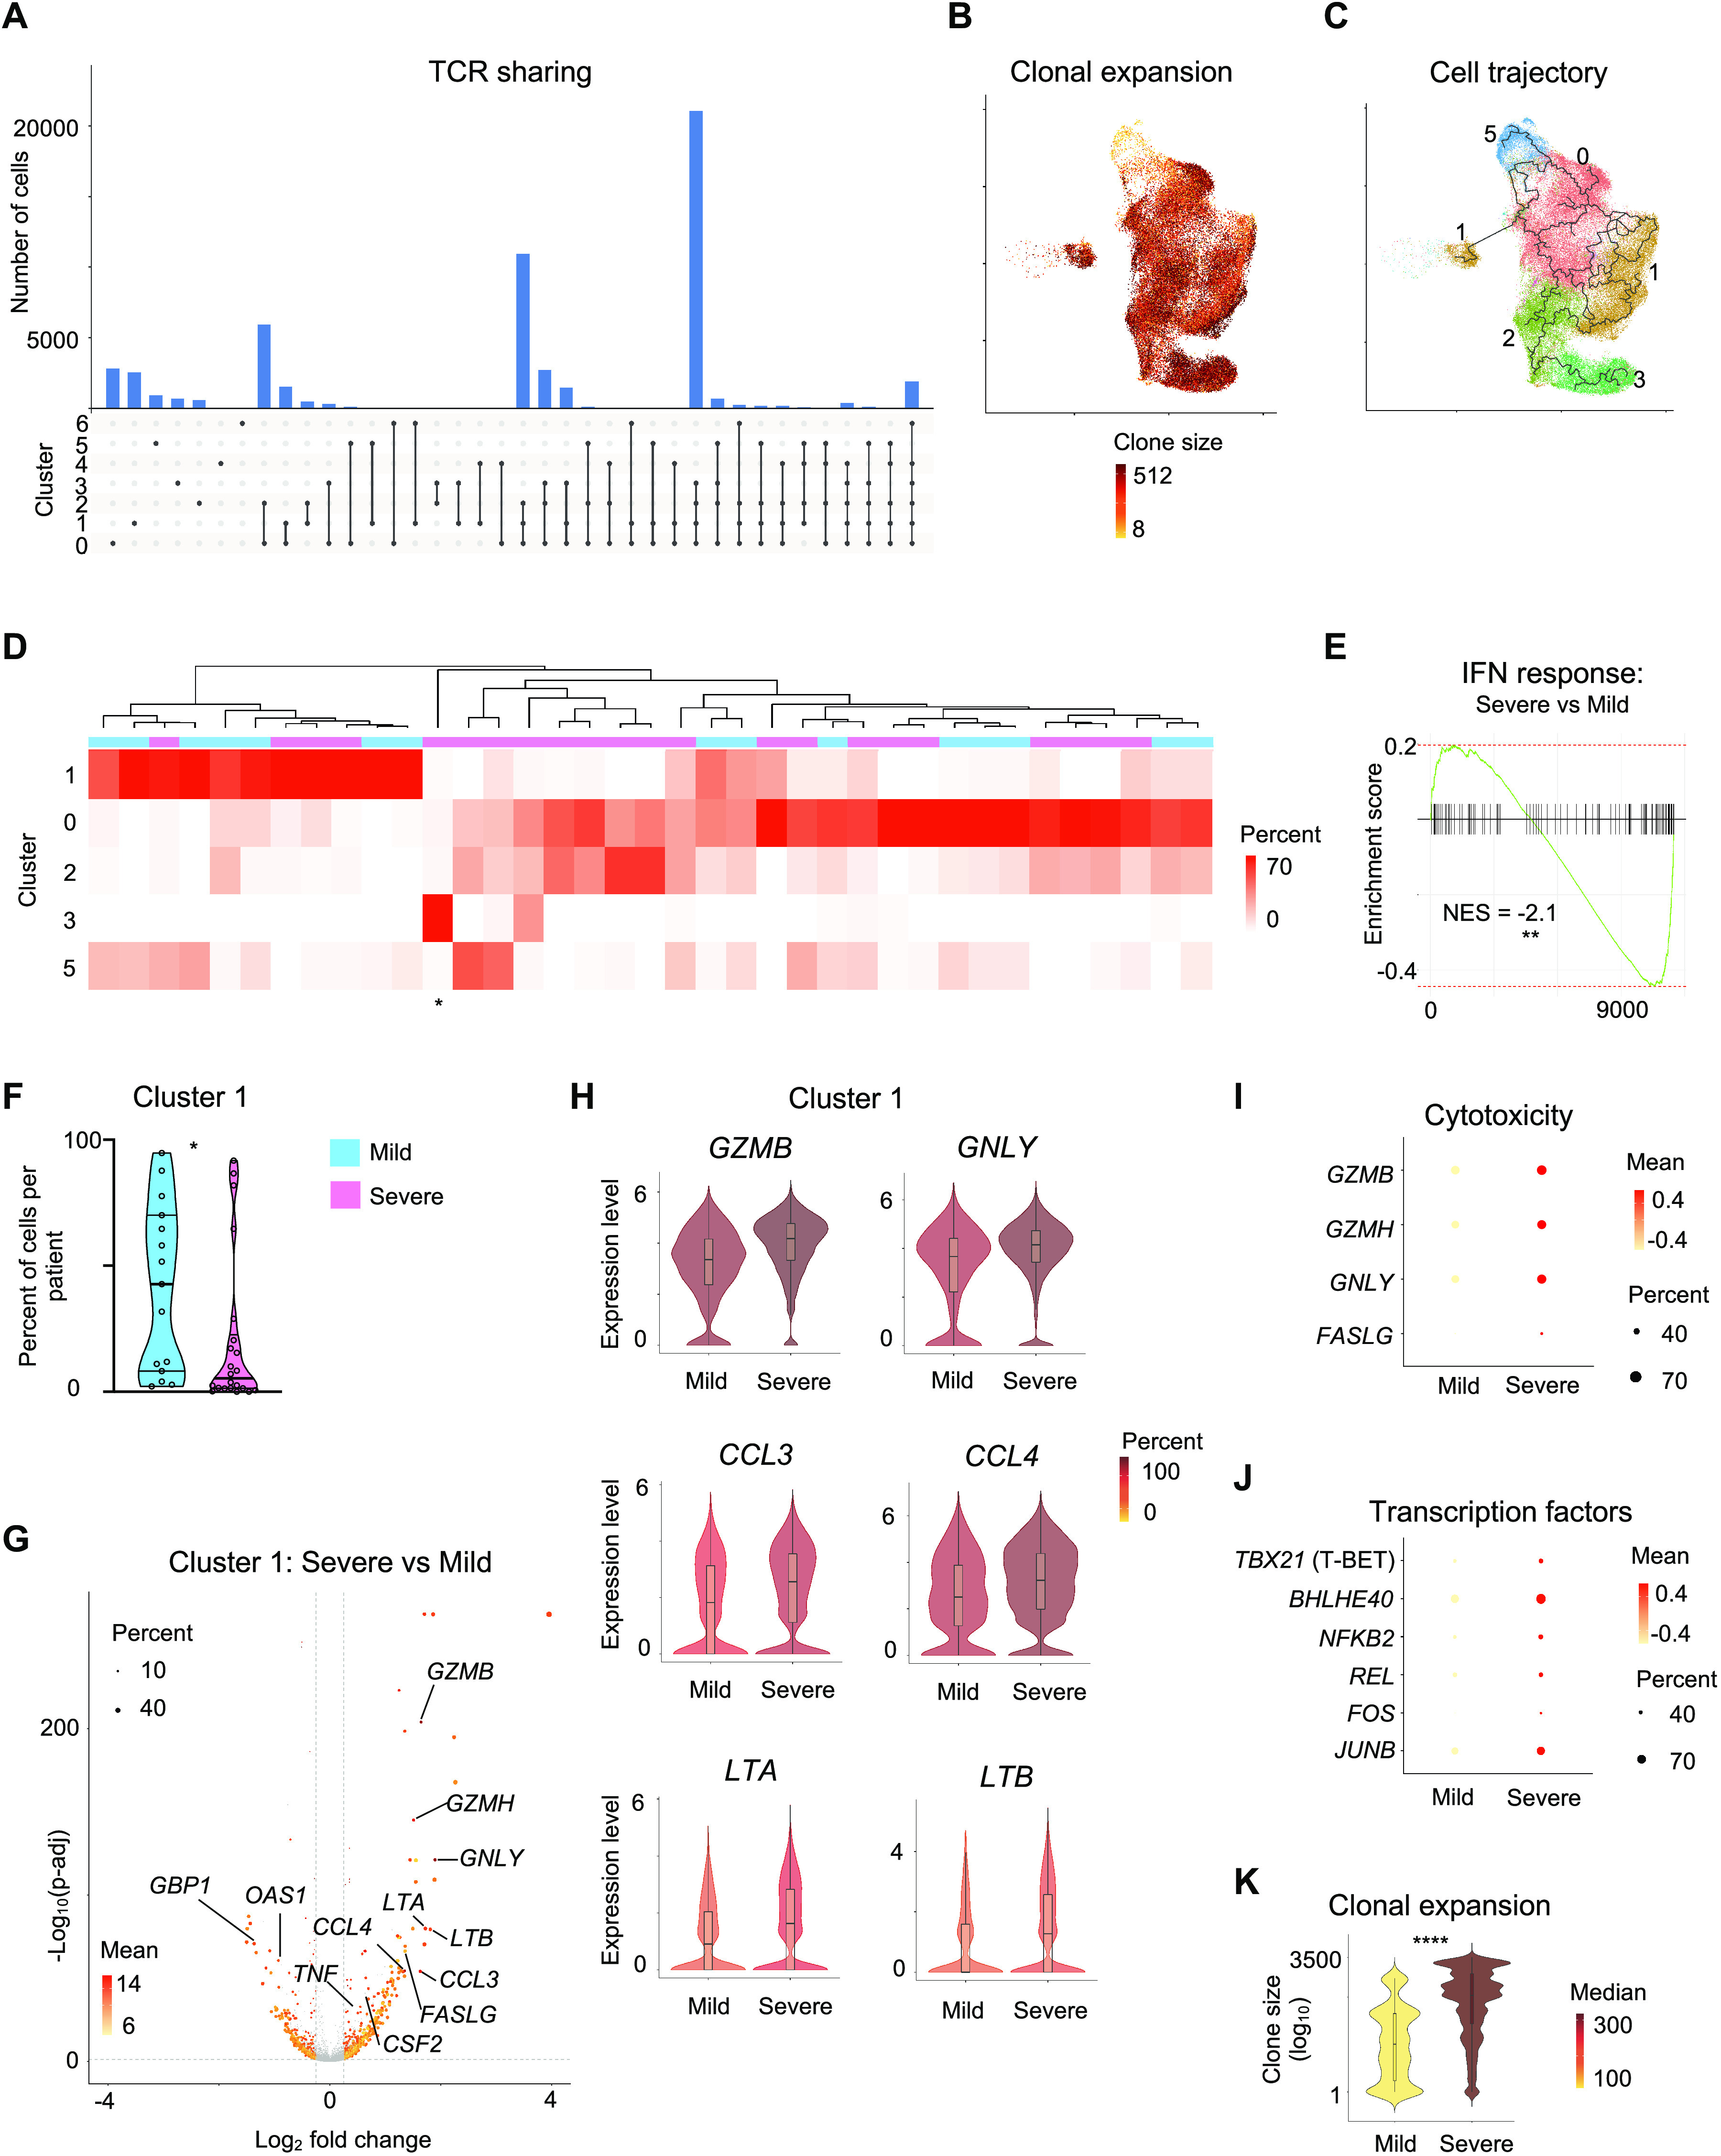
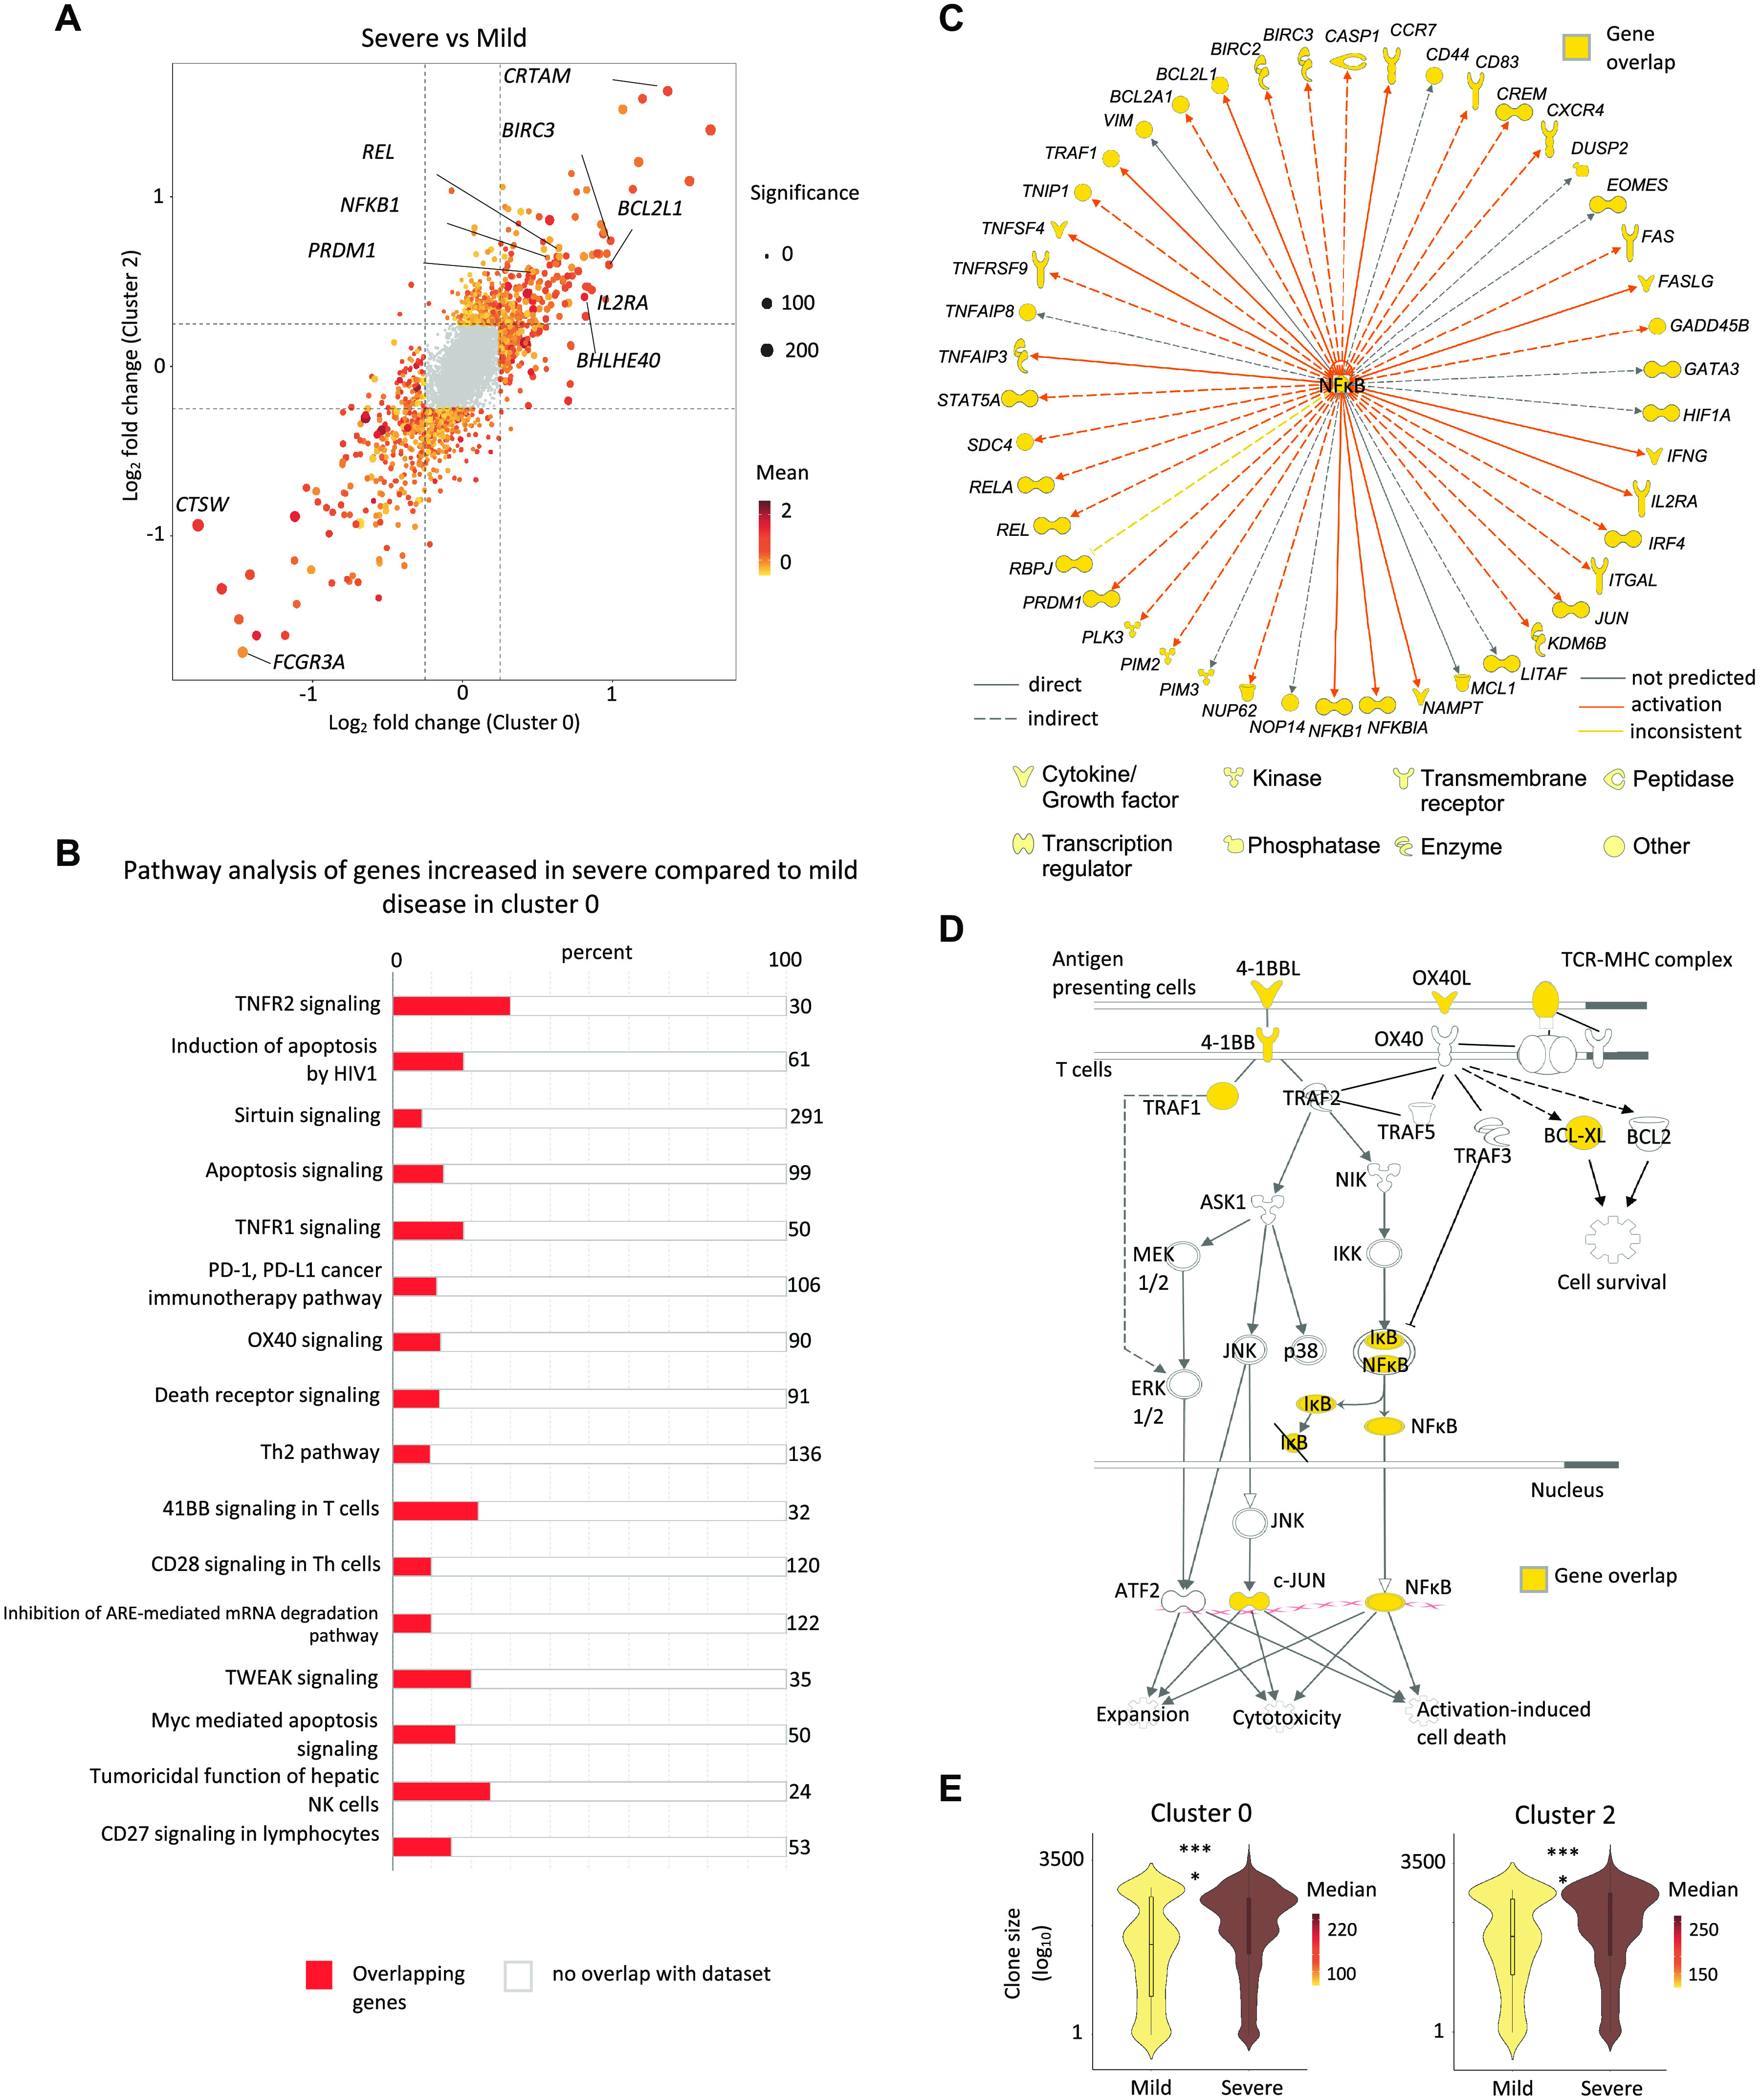
The molecular properties of CD8+ T cells that respond to SARS-CoV-2 infection are not fully known. Here, we report on the single-cell transcriptomes of >80,000 virus-reactive CD8+ T cells, obtained using a modified Antigen-Reactive T cell Enrichment (ARTE) assay, from 39 COVID-19 patients and 10 healthy subjects. COVID-19 patients segregated into two groups based on whether the dominant CD8+ T cell response to SARS-CoV-2 was 'exhausted' or not. SARS-CoV-2-reactive cells in the exhausted subset were increased in frequency and displayed lesser cytotoxicity and inflammatory features in COVID-19 patients with mild compared to severe illness. In contrast, SARS-CoV-2-reactive cells in the dominant non-exhausted subset from patients with severe disease showed enrichment of transcripts linked to co-stimulation, pro-survival NF-κB signaling, and anti-apoptotic pathways, suggesting the generation of robust CD8+ T cell memory responses in patients with severe COVID-19 illness. CD8+ T cells reactive to influenza and respiratory syncytial virus from healthy subjects displayed polyfunctional features and enhanced glycolysis. Cells with such features were largely absent in SARS-CoV-2-reactive cells from both COVID-19 patients and healthy controls non-exposed to SARS-CoV-2. Overall, our single-cell analysis revealed substantial diversity in the nature of CD8+ T cells responding to SARS-CoV-2.


Figures

Fig. 1
Fig. 1. CD8+ T cell responses in COVID-19 illness.
(A) Study design overview. (B) Representative FACS plots displaying surface staining of CD137 and CD69 in post-enriched CD8+ memory T cells, stimulated for 24 hours with SARS-CoV-2 peptide pools, from COVID-19 patients with mild and severe illness (left), and summary of the number of cells sorted per million PBMC (right); data are displayed as median with interquartile ranges for 17 and 22 patients with mild and severe COVID-19 disease, respectively. (C) Representative FACS plots (left) showing surface expression of PD-1 in CD8+ memory T cells ex vivo (without in vitro stimulation) and in CD137+CD69+ CD8+ memory T cells following stimulation, post-enrichment (CD137-based) and corresponding summary plots (right) showing proportion of PD-1 expressing cells in each study subject (P = 0.26, unpaired t-test); data are displayed as median with interquartile ranges for 17 mild and 22 severe COVID-19 patients, respectively. ***P<0.001 by Mann-Whitney test (B).
Fig. 2
Fig. 2. Virus-reactive CD8+ T cells show transcriptomic heterogeneity.
(A) Uniform manifold approximation and projection (UMAP) analysis that displays single-cell transcriptomic landscape of sorted CD137+CD69+ CD8+ memory T cells following 24 hours of stimulation with virus-specific peptide pools. Seurat-based clustering of 84,140 single cells colored based on cluster type. (B) Heatmap showing expression of the most significantly enriched transcripts in clusters 0-6 (see table S4, Seurat marker gene analysis – comparison of a cluster of interest versus all other cells). Shown are a subset of the top 200 transcripts that have an adjusted P < 0.05, log2 fold change > 0.25, and >10% difference in the percentage of cells expressing the differentially expressed transcript between two groups compared. (C) Graph showing average expression (color scale) and percent of expressing cells (size scale) of selected marker transcripts in each cluster; cells in cluster 7 that comprise <1% of all cells are not shown (B, C). (D) UMAPs are illustrating exhaustion, interferon (IFN) response, cytotoxicity, ‘unhelped’, and glycolysis signature scores for each cell. (E) Gene Set Enrichment Analysis (GSEA) for the indicated gene signatures comparing each cluster with the rest of the cells. Heatmap shows summary of the normalized enrichment scores for each cluster. Gray color indicates that the signature does not reach statistical significance (P >0.05) in a given cluster. (F) Violin plots showing normalized expression level (log2(CPM+1)) of representative exhaustion, IFN response and cytotoxicity marker transcripts (LAG3, MX1 and GZMB, respectively) in cluster 1 compared to an aggregation of remaining cells (Rest). Color indicates percentage of cells expressing indicated transcript. (G) UMAPs are depicting CD8+ memory T cells for individual virus-specific pool stimulation conditions (top panel). Each group of virus-reactive cells was randomly down-sampled to ensure equal representation; corresponding pie charts are displaying proportions of virus-reactive cells in individual clusters (bottom panel).
Fig. 3
Fig. 3. Exhausted SARS-CoV-2-reactive CD8+ T cells are increased in mild COVID-19 illness.
(A) Single-cell TCR sequence analysis of SARS-CoV-2-reactive cells showing the sharing of TCRs between cells from individual clusters (rows, connected by lines). Bars (top) indicate the number of cells intersecting indicated clusters (columns). (B) UMAP is showing the clone size of SARS-CoV-2-reactive cells from COVID-19 patients. (C) Single-cell trajectory analysis showing the relationship between cells in different clusters (line). (D) Unsupervised clustering of all COVID-19 patients (mild and severe illness) based on the proportion of SARS-CoV-2-reactive CD8+ T cells present in each cluster per patient. The symbol * below represents patient 8. Clusters 4, 6, and 7 that had a very low frequency of cells in COVID-19 patients (<1% cells per cluster in total) are not shown here; full details provided in table S3. (E) Gene Set Enrichment Analysis (GSEA) of type I interferon response genes in all cells from COVID-19 patients with severe versus mild illness. Normalized Enrichment Score (NES) = -2.1, ** P<0.01. (F) Violin plots comparing the proportion of cells in cluster 1 from COVID-19 patients with mild and severe illness. Data are displayed as median with interquartile ranges (n=37, 2 subjects without hashtag data were not included for donor-specific analysis). (G) Volcano plot showing genes differentially expressed (adjusted P < 0.05, mean CPM >0, log2 fold change >0.25) in cluster 1 cells between COVID-19 patients with severe and mild disease. (H) Violin plots comparing the normalized expression level (log2(CPM+1)) of indicated transcripts in cluster 1 cells between COVID-19 patients with mild and severe disease. Color indicates percentage of cells expressing indicated transcript. (I) Plot displaying the mean expression (color scale) and percent of expressing cells (size scale) of several cytotoxicity molecules in cluster 1 cells from COVID-19 patients with severe and mild illness. (J) Plot displaying the mean expression (color scale) and percent of expressing cells (size scale) of several key transcription factors in cluster 1 cells from COVID-19 patients with severe and mild illness. (K) Violin plots showing the degree of CD8+ T cell-clonal expansion in cluster 1 cells between COVID-19 patients with mild and severe disease. Color indicates median size per group. * P<0.05, ****P<0.0001 by Mann-Whitney tests (F, K).
Fig. 4
Fig. 4. Pro-survival features in SARS-CoV-2-reactive CD8+ T cells from patients with severe COVID-19 illness.
(A) Plot shows fold change values of differentially expressed genes (adjusted P < 0.05, mean CPM >0, log2 fold change >0.25) in clusters 0 (x-axis) and 2 (y-axis) when comparing COVID-19 patients with severe and mild illness. A positive value indicates that the particular gene has increased expression in patients with severe disease relative to patients with mild disease in a given cluster, while a negative value indicates the opposite. (B-D) Ingenuity Pathway Analysis (IPA) of genes with increased expression (adjusted P <0.05, log2 fold change >0.25) in cluster 0 cells between COVID-19 patients with severe versus mild illness; (B) Top 16 canonical pathways with significant enrichment. (C) Upstream regulatory network analysis of genes in NF-κB pathway. (D) Transcripts encoding components in the 4-1BB and OX40 signaling pathway. (E) Violin plots showing the degree of CD8+ T cell-clonal expansion in cluster 0 (left) and 2 (right) between COVID-19 patients with mild and severe disease. Color indicates median size per group. **** P <0.0001 by Mann-Whitney test.

Update of

Comment in

References

    1. Hanke T., Blanchard T. J., Schneider J., Hannan C. M., Becker M., Gilbert S. C., Hill A. V., Smith G. L., McMichael A., Enhancement of MHC class I-restricted peptide-specific T cell induction by a DNA prime/MVA boost vaccination regime. Vaccine 16, 439–445 (1998). 10.1016/S0264-410X(97)00226-0 - DOI - PubMed
    1. McMichael A., Mwau M., Hanke T., HIV T cell vaccines, the importance of clades. Vaccine 20, 1918–1921 (2002). 10.1016/S0264-410X(02)00067-1 - DOI - PubMed
    1. Arunachalam P. S., Charles T. P., Joag V., Bollimpelli V. S., Scott M. K. D., Wimmers F., Burton S. L., Labranche C. C., Petitdemange C., Gangadhara S., Styles T. M., Quarnstrom C. F., Walter K. A., Ketas T. J., Legere T., Jagadeesh Reddy P. B., Kasturi S. P., Tsai A., Yeung B. Z., Gupta S., Tomai M., Vasilakos J., Shaw G. M., Kang C.-Y., Moore J. P., Subramaniam S., Khatri P., Montefiori D., Kozlowski P. A., Derdeyn C. A., Hunter E., Masopust D., Amara R. R., Pulendran B., T cell-inducing vaccine durably prevents mucosal SHIV infection even with lower neutralizing antibody titers. Nat. Med. 26, 932–940 (2020). 10.1038/s41591-020-0858-8 - DOI - PMC - PubMed
    1. Petitdemange C., Kasturi S. P., Kozlowski P. A., Nabi R., Quarnstrom C. F., Reddy P. B. J., Derdeyn C. A., Spicer L. M., Patel P., Legere T., Kovalenkov Y. O., Labranche C. C., Villinger F., Tomai M., Vasilakos J., Haynes B., Kang C. Y., Gibbs J. S., Yewdell J. W., Barouch D., Wrammert J., Montefiori D., Hunter E., Amara R. R., Masopust D., Pulendran B., Vaccine induction of antibodies and tissue-resident CD8+ T cells enhances protection against mucosal SHIV-infection in young macaques. JCI Insight 4, e126047 (2019). 10.1172/jci.insight.126047 - DOI - PMC - PubMed
    1. Grifoni A., Weiskopf D., Ramirez S. I., Mateus J., Dan J. M., Moderbacher C. R., Rawlings S. A., Sutherland A., Premkumar L., Jadi R. S., Marrama D., de Silva A. M., Frazier A., Carlin A. F., Greenbaum J. A., Peters B., Krammer F., Smith D. M., Crotty S., Sette A., Targets of T Cell Responses to SARS-CoV-2 Coronavirus in Humans with COVID-19 Disease and Unexposed Individuals. Cell 181, 1489–1501.e15 (2020). 10.1016/j.cell.2020.05.015 - DOI - PMC - PubMed

Publication types