Observational Study
. 2022 Feb;71(2):402-414.
doi: 10.1136/gutjnl-2020-323419. Epub 2021 Jan 21.

Two-dimensional shear wave elastography predicts survival in advanced chronic liver disease

Affiliations
Observational Study

Two-dimensional shear wave elastography predicts survival in advanced chronic liver disease

Jonel Trebicka et al. Gut. 2022 Feb.

Abstract

Objective: Liver stiffness measurement (LSM) is a tool used to screen for significant fibrosis and portal hypertension. The aim of this retrospective multicentre study was to develop an easy tool using LSM for clinical outcomes in advanced chronic liver disease (ACLD) patients.

Design: This international multicentre cohort study included a derivation ACLD patient cohort with valid two-dimensional shear wave elastography (2D-SWE) results. Clinical and laboratory parameters at baseline and during follow-up were recorded. LSM by transient elastography (TE) was also recorded if available. The primary outcome was overall mortality. The secondary outcome was the development of first/further decompensation.

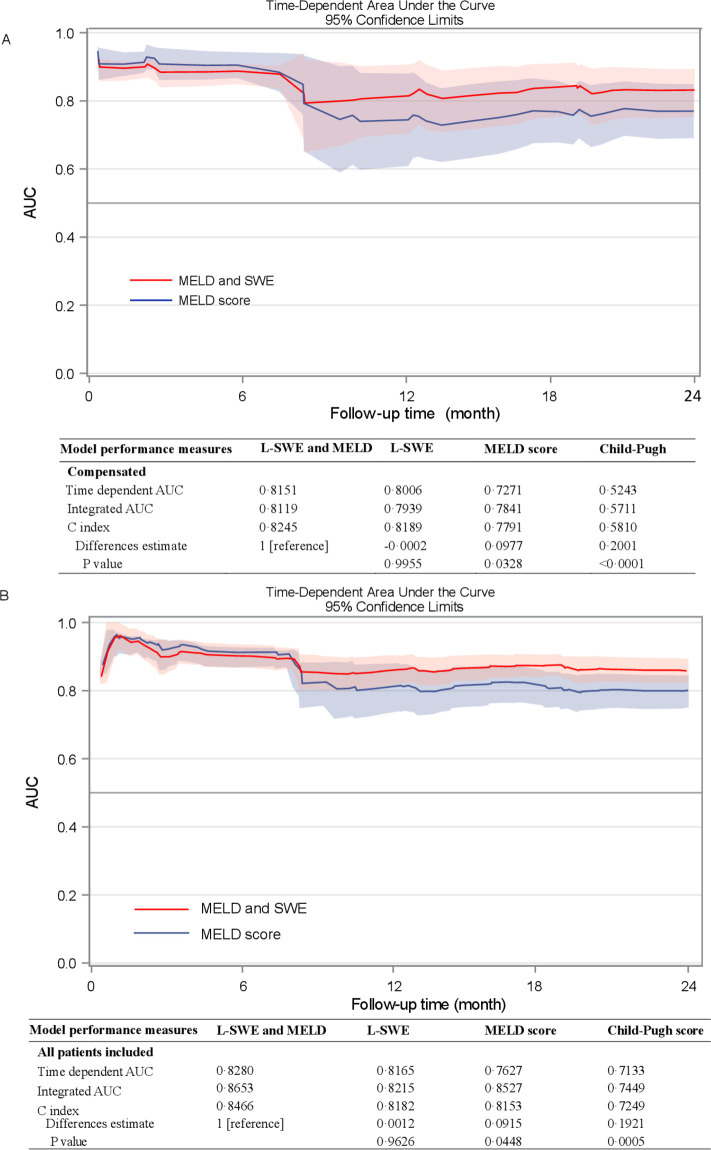
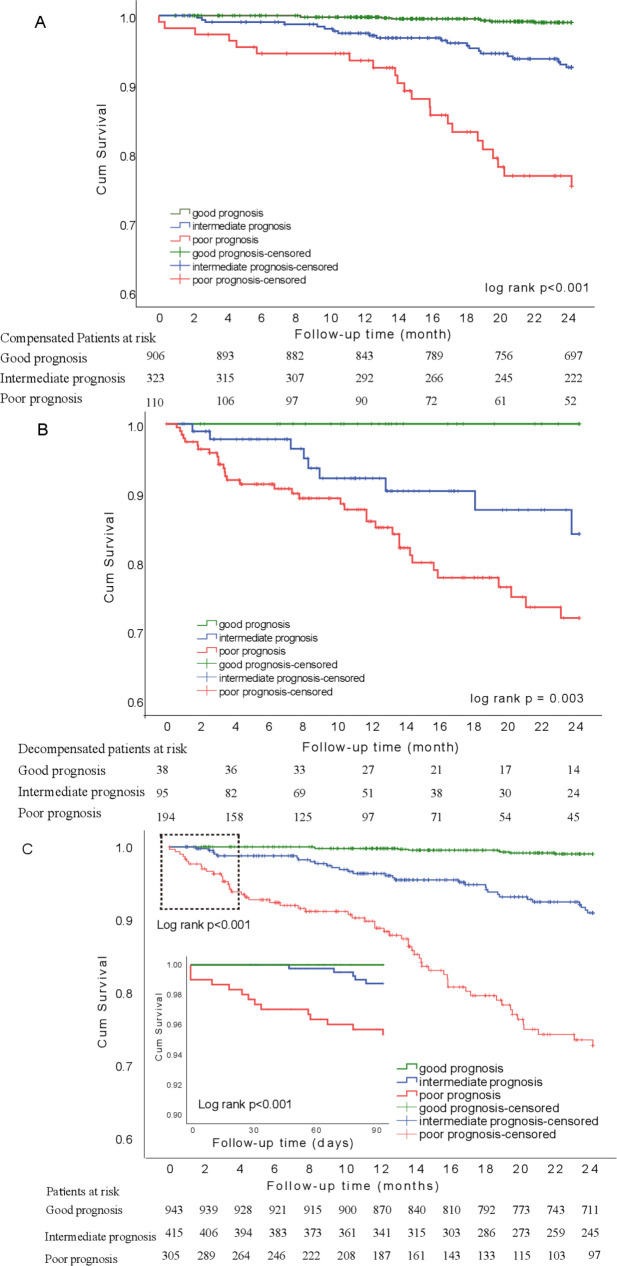
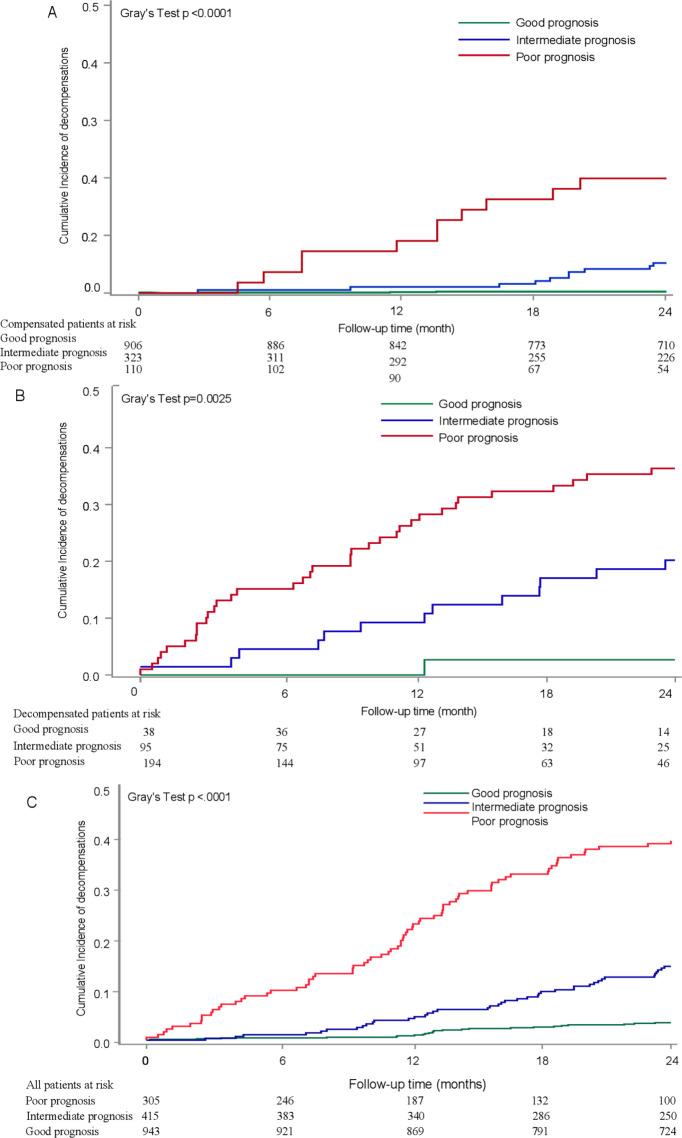
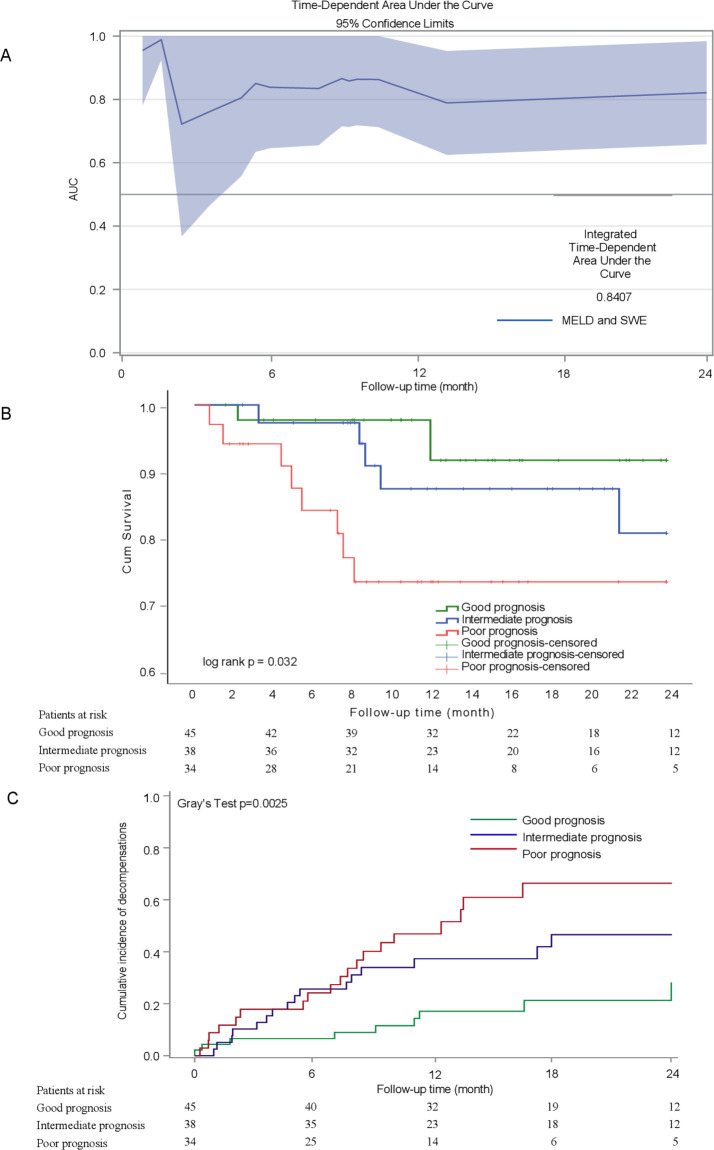
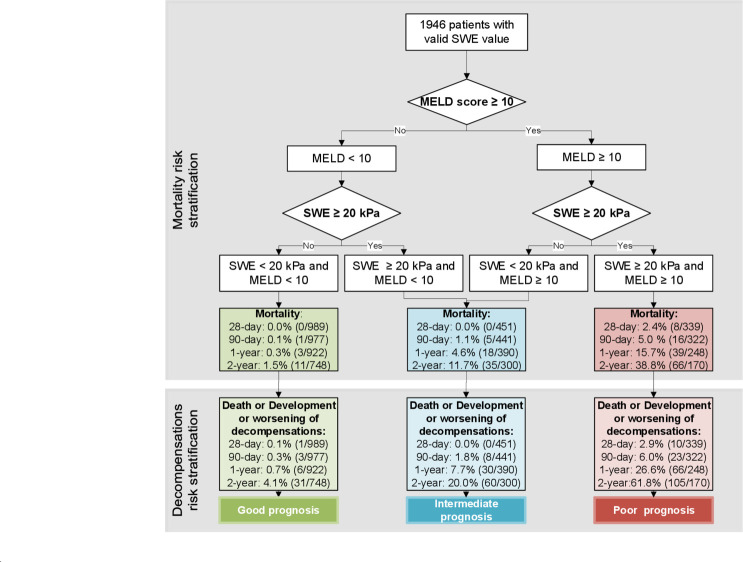
Results: After screening 2148 patients (16 centres), 1827 patients (55 years, 62.4% men) were included in the 2D-SWE cohort, with median liver SWE (L-SWE) 11.8 kPa and a model for end stage liver disease (MELD) score of 8. Combination of MELD score and L-SWE predict independently of mortality (AUC 0.8). L-SWE cut-off at ≥20 kPa combined with MELD ≥10 could stratify the risk of mortality and first/further decompensation in ACLD patients. The 2-year mortality and decompensation rates were 36.9% and 61.8%, respectively, in the 305 (18.3%) high-risk patients (with L-SWE ≥20 kPa and MELD ≥10), while in the 944 (56.6%) low-risk patients, these were 1.1% and 3.5%, respectively. Importantly, this M10LS20 algorithm was validated by TE-based LSM and in an additional cohort of 119 patients with valid point shear SWE-LSM.

Conclusion: The M10LS20 algorithm allows risk stratification of patients with ACLD. Patients with L-SWE ≥20 kPa and MELD ≥10 should be followed closely and receive intensified care, while patients with low risk may be managed at longer intervals.

Keywords: chronic liver disease; clinical decision making; liver cirrhosis; liver failure; portal hypertension.


Conflict of interest statement

Competing interests: JT has received speaking and/or consulting fees from Gore, Bayer, Alexion, MSD, Gilead, Intercept, Norgine, Grifols, Versantis, and Martin Pharmaceutical. Philip Ferstl received consultancy for SNIPR Biome. Supersonic Imagine supported interaction within the groups, but without specific funding.

Figures

Figure 1
Figure 1
(A) Time-dependent area under the curve and 95% CI of the combined algorithm based on MELD score and SEW, and MELD score alone in compensated patients only during 2 years of follow-up. (B) Time-dependent area under the curve and 95% CI of the combined model of MELD score and swe, and MELD score alone in all patients (including decompensated patients at baseline) of the cohort with 2D-SWE during 2 years of follow-up. 2D-SWE, 2-dimensional shear wave elastography; AUC, area under the curve; MELD, the model for end-stage liver disease.
Figure 2
Figure 2
Curves of patients with good, intermediate and poor prognosis. (A) Kaplan-Meier of 2-year survival curve in compensated patients. Level of significance: log-rank p<0.001. (B) Kaplan-Meier of 2 years survival curve in decompensated patients. Level of significance: log-rank p=0.003.(C) Kaplan-Meier of 2-year and 90-day survival curve of all patients of the cohort with 2D-SWE measurements. The top left rectangle in the curve of 2 years survival indicates the area of the Kaplan-Meier curve of 90-day survival depicted in the bottom left panel. Level of significance: log-rank p<0.001. 2D-SWE, 2-dimensional shear wave elastography.
Figure 3
Figure 3
(A) Cumulative incidence of development of decompensations within 2 years of patients with good, intermediate and poor prognosis in compensated patients. Level of significance: Gray’s test p<0.0001. (B) Cumulative incidence of development of further episodes of decompensation within 2 years of decompensated patients with good, intermediate and poor prognosis. Level of significance: Gray’s test p=0.0025. (C) Cumulative incidence of development of decompensations within 2 years of all patients included in the cohort with 2D-SWE measurements with good, intermediate and poor prognosis. Level of significance: Gray’s test p<0.0001. 2D-SWE, 2-dimensional shear wave elastography.
Figure 4
Figure 4
(A) Time-dependent area under the curve and 95% CI of the combined model of MELD score and p-SWE in the additional cohort validated for p-SWE during 2 years of follow-up. (B) Two-year Kaplan-Meier curves of the additional cohort validated for p-SWE of patients classified with good, intermediate and poor prognosis. Level of significance: log-rank p<0.032. (C) Cumulative incidence of development of decompensations within 2 years of all patients included in the additional cohort validated for p-SWE with good, intermediate and poor prognosis. Level of significance: Gray’s test p=0.0025. AUC, area under the curve; MELD, model for end-stage liver disease; p-SWE, point shear wave elastography.
Figure 5
Figure 5
Stratification model of cohort with 2D-SWE and additional cohort with p-SWE for prediction of estimated mortality (upper panel) at 28 and 90 days as well as at one and 2 years of follow-up based on MELD score <10 vs ≥10 and L-SWE <20 vs ≥20 kPa; stratification model of cohort with 2D-SWE and additional cohort with p-SWE for prediction of first/further decompensation risk (lower panel) at 28 and 90 days as well as at one and 2 years of follow-up based on MELD score <10 vs ≥10 and L-SWE <20 vs ≥20 kPa. 2D-SWE, 2-dimensional shear wave elastography’ L-SWE, liver SWE; MELD, model for end stage liver disease; p-SWE, point SWE.

Comment in

References

    1. de Franchis R, Baveno V Faculty . Revising consensus in portal hypertension: report of the Baveno V consensus workshop on methodology of diagnosis and therapy in portal hypertension. J Hepatol 2010;53:762–8. 10.1016/j.jhep.2010.06.004 - DOI - PubMed
    1. Kamath PS, Wiesner RH, Malinchoc M, et al. . A model to predict survival in patients with end-stage liver disease. Hepatology 2001;33:464–70. 10.1053/jhep.2001.22172 - DOI - PubMed
    1. Jansen C, Möller P, Meyer C, et al. . Increase in liver stiffness after transjugular intrahepatic portosystemic shunt is associated with inflammation and predicts mortality. Hepatology 2018;67:1472–84. 10.1002/hep.29612 - DOI - PubMed
    1. Praktiknjo M, Book M, Luetkens J, et al. . Fat-Free muscle mass in magnetic resonance imaging predicts acute-on-chronic liver failure and survival in decompensated cirrhosis. Hepatology 2018;67:1014–26. 10.1002/hep.29602 - DOI - PubMed
    1. Lehmann J, Praktiknjo M, Nielsen MJ, et al. . Collagen type IV remodelling gender-specifically predicts mortality in decompensated cirrhosis. Liver Int 2019;39:885–93. 10.1111/liv.14070 - DOI - PMC - PubMed

Publication types