. 2021 Feb 26;371(6532):916-921.
doi: 10.1126/science.abe6959. Epub 2021 Jan 21.

Model-informed COVID-19 vaccine prioritization strategies by age and serostatus

Affiliations

Model-informed COVID-19 vaccine prioritization strategies by age and serostatus

Kate M Bubar et al. Science. .

Abstract

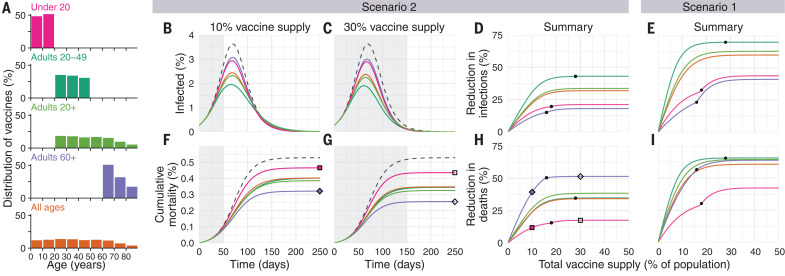
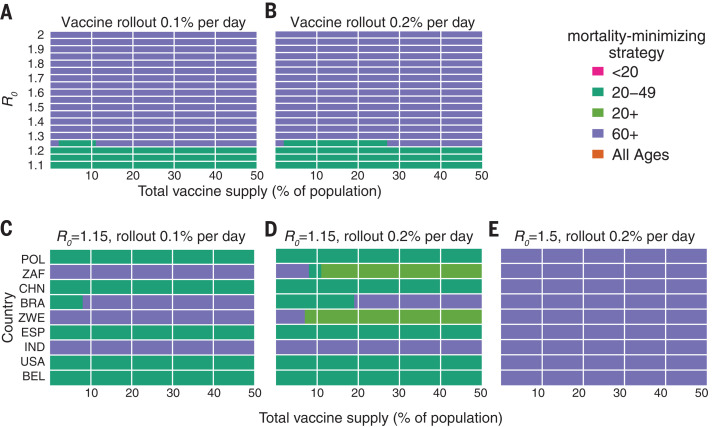
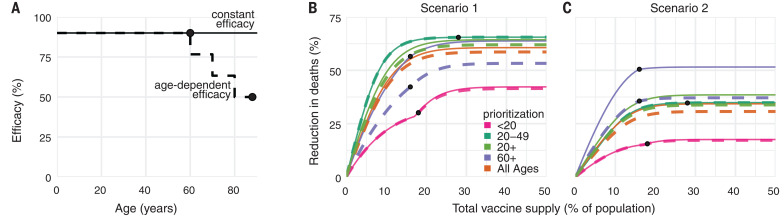
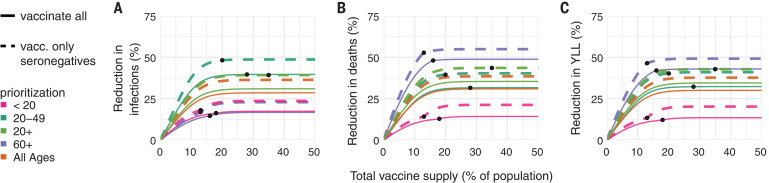
Limited initial supply of severe acute respiratory syndrome coronavirus 2 (SARS-CoV-2) vaccine raises the question of how to prioritize available doses. We used a mathematical model to compare five age-stratified prioritization strategies. A highly effective transmission-blocking vaccine prioritized to adults ages 20 to 49 years minimized cumulative incidence, but mortality and years of life lost were minimized in most scenarios when the vaccine was prioritized to adults greater than 60 years old. Use of individual-level serological tests to redirect doses to seronegative individuals improved the marginal impact of each dose while potentially reducing existing inequities in COVID-19 impact. Although maximum impact prioritization strategies were broadly consistent across countries, transmission rates, vaccination rollout speeds, and estimates of naturally acquired immunity, this framework can be used to compare impacts of prioritization strategies across contexts.


Figures

Fig. 1
Fig. 1. Impacts of vaccine prioritization strategies on mortality and infections.
(A) Distribution of vaccines for five prioritization strategies: under 20 years, adults 20 to 49 years, adults 20+ years, adults 60+ years, and all ages. (B, C, F, and G) Example simulation curves show [(B) and (C)] percentage of the total population infected over time and [(F) and (G)] cumulative mortality for no vaccines (gray dashed lines) and for five different prioritization strategies [colored lines matching (A)], with [(B) and (F)] 10% and [(C) and (G)] 30% vaccine supply. (D, E, H, and I) Summary curves show percent reductions in [(D) and (E)] infections and [(H) and (I)] deaths in comparison to an unmitigated outbreak for vaccine supplies between 1 and 50% after 365 days of simulation. Squares and diamonds show how the outputs from single simulations [(F) and (G)] correspond to points in summary curves (H). Gray shading indicates the period during which vaccine is being rolled out at 0.2% of total population per day. Black dots indicate break points at which prioritized demographic groups have been 70% vaccinated, after which vaccines are distributed without prioritization. These simulations assume contact patterns and demographics of the United States (38, 53) and an all-or-nothing, transmission-blocking vaccine with 90% vaccine efficacy and R0 = 1.5 (scenario 2) and R0 = 1.15 (scenario 1).
Fig. 2
Fig. 2. Mortality-minimizing vaccine prioritization strategies across reproductive numbers R0 and countries.
(A to E) Heatmaps show the prioritization strategies that result in maximum reduction of mortality for varying values of [(A) and (B)] the basic reproductive number R0 and [(C), (D), and (E)] across nine countries, for vaccine supplies between 1 and 50% of the total population, for an all-or-nothing and transmission-blocking vaccine, 90% vaccine efficacy. [(A) and (B)] Contact patterns and demographics of the United States (38, 53). [(C), (D), and (E)] Contact patterns and demographics of POL, Poland; ZAF, South Africa; CHN, China; BRA, Brazil; ZWE, Zimbabwe; ESP, Spain; IND, India; USA, United States of America; and BEL, Belgium, with R0 and rollout speeds as indicated.
Fig. 3
Fig. 3. Effects of age-dependent vaccine efficacy on the impacts of prioritization strategies.
(A) Diagram of hypothetical age-dependent vaccine efficacy shows decrease from 90% baseline efficacy to 50% efficacy among individuals aged 80+ years, beginning at age 60 (dashed line). (B and C) Percent reduction in deaths in comparison with an unmitigated outbreak for transmission-blocking all-or-nothing vaccines with either constant 90% efficacy for all age groups (solid lines) or age-dependent efficacy shown in (A) (dashed lines), covering scenario 1 [0.2% rollout per day, R0 = 1.15; (B)] and scenario 2 [0.2% rollout per day, R0 = 1.5 (C)]. Black dots indicate break points at which prioritized demographic groups have been 70% vaccinated, after which vaccines are distributed without prioritization. Shown are contact patterns and demographics of the United States (38, 53); all-or-nothing and transmission-blocking vaccine.
Fig. 4
Fig. 4. Effects of existing seropositivity on the impacts of prioritization strategies.
(A to C) Percent reductions in (A) infections, (B) deaths, and (C) years of life lost (YLL) for prioritization strategies when existing age-stratified seroprevalence is incorporated [August 2020 estimates for New York City; mean seroprevalence 26.9% (28)]. Plots show reductions for scenario 2 (0.2% rollout per day, R0 = 1.5) when vaccines are given to all individuals (solid lines) or to only seronegatives (dashed lines), inclusive of 96% serotest sensitivity, 99% specificity (54), and approximately 3 months of seroreversion (supplementary materials, materials and methods) (29). Shown are U.S. contact patterns and demographics (38, 53), all-or-nothing and transmission-blocking vaccine with 90% vaccine efficacy. Lower and higher seroprevalence examples are provided in figs. S12 and S13, respectively.

Update of

Comment in

  • Optimizing age-specific vaccination.
    Fitzpatrick MC, Galvani AP. Fitzpatrick MC, et al. Science. 2021 Feb 26;371(6532):890-891. doi: 10.1126/science.abg2334. Epub 2021 Jan 21. Science. 2021. PMID: 33479122 No abstract available.

References

    1. Johns Hopkins University Coronavirus Research Center, COVID-19 Dashboard by the Center for Systems Science and Engineering at Johns Hopkins University (2020); https://coronavirus.jhu.edu/map.html.
    1. Khamsi R., If a coronavirus vaccine arrives, can the world make enough? Nature 580, 578–580 (2020). 10.1038/d41586-020-01063-8 - DOI - PubMed
    1. National Academies of Sciences, Engineering, and Medicine, Framework for Equitable Allocation of COVID-19 Vaccine (National Academies Press, 2020); 10.17226/25917.10.17226/25917 - DOI - DOI - PubMed
    1. Weycker D., Edelsberg J., Halloran M. E., Longini I. M. Jr.., Nizam A., Ciuryla V., Oster G., Population-wide benefits of routine vaccination of children against influenza. Vaccine 23, 1284–1293 (2005). 10.1016/j.vaccine.2004.08.044 - DOI - PubMed
    1. Medlock J., Galvani A. P., Optimizing influenza vaccine distribution. Science 325, 1705–1708 (2009). 10.1126/science.1175570 - DOI - PubMed

Publication types

MeSH terms