. 2021 Mar 12;371(6534):eaay1833.
doi: 10.1126/science.aay1833. Epub 2021 Jan 21.

Noncanonical scaffolding of Gαi and β-arrestin by G protein-coupled receptors

Affiliations

Noncanonical scaffolding of Gαi and β-arrestin by G protein-coupled receptors

Jeffrey S Smith et al. Science. .

Abstract

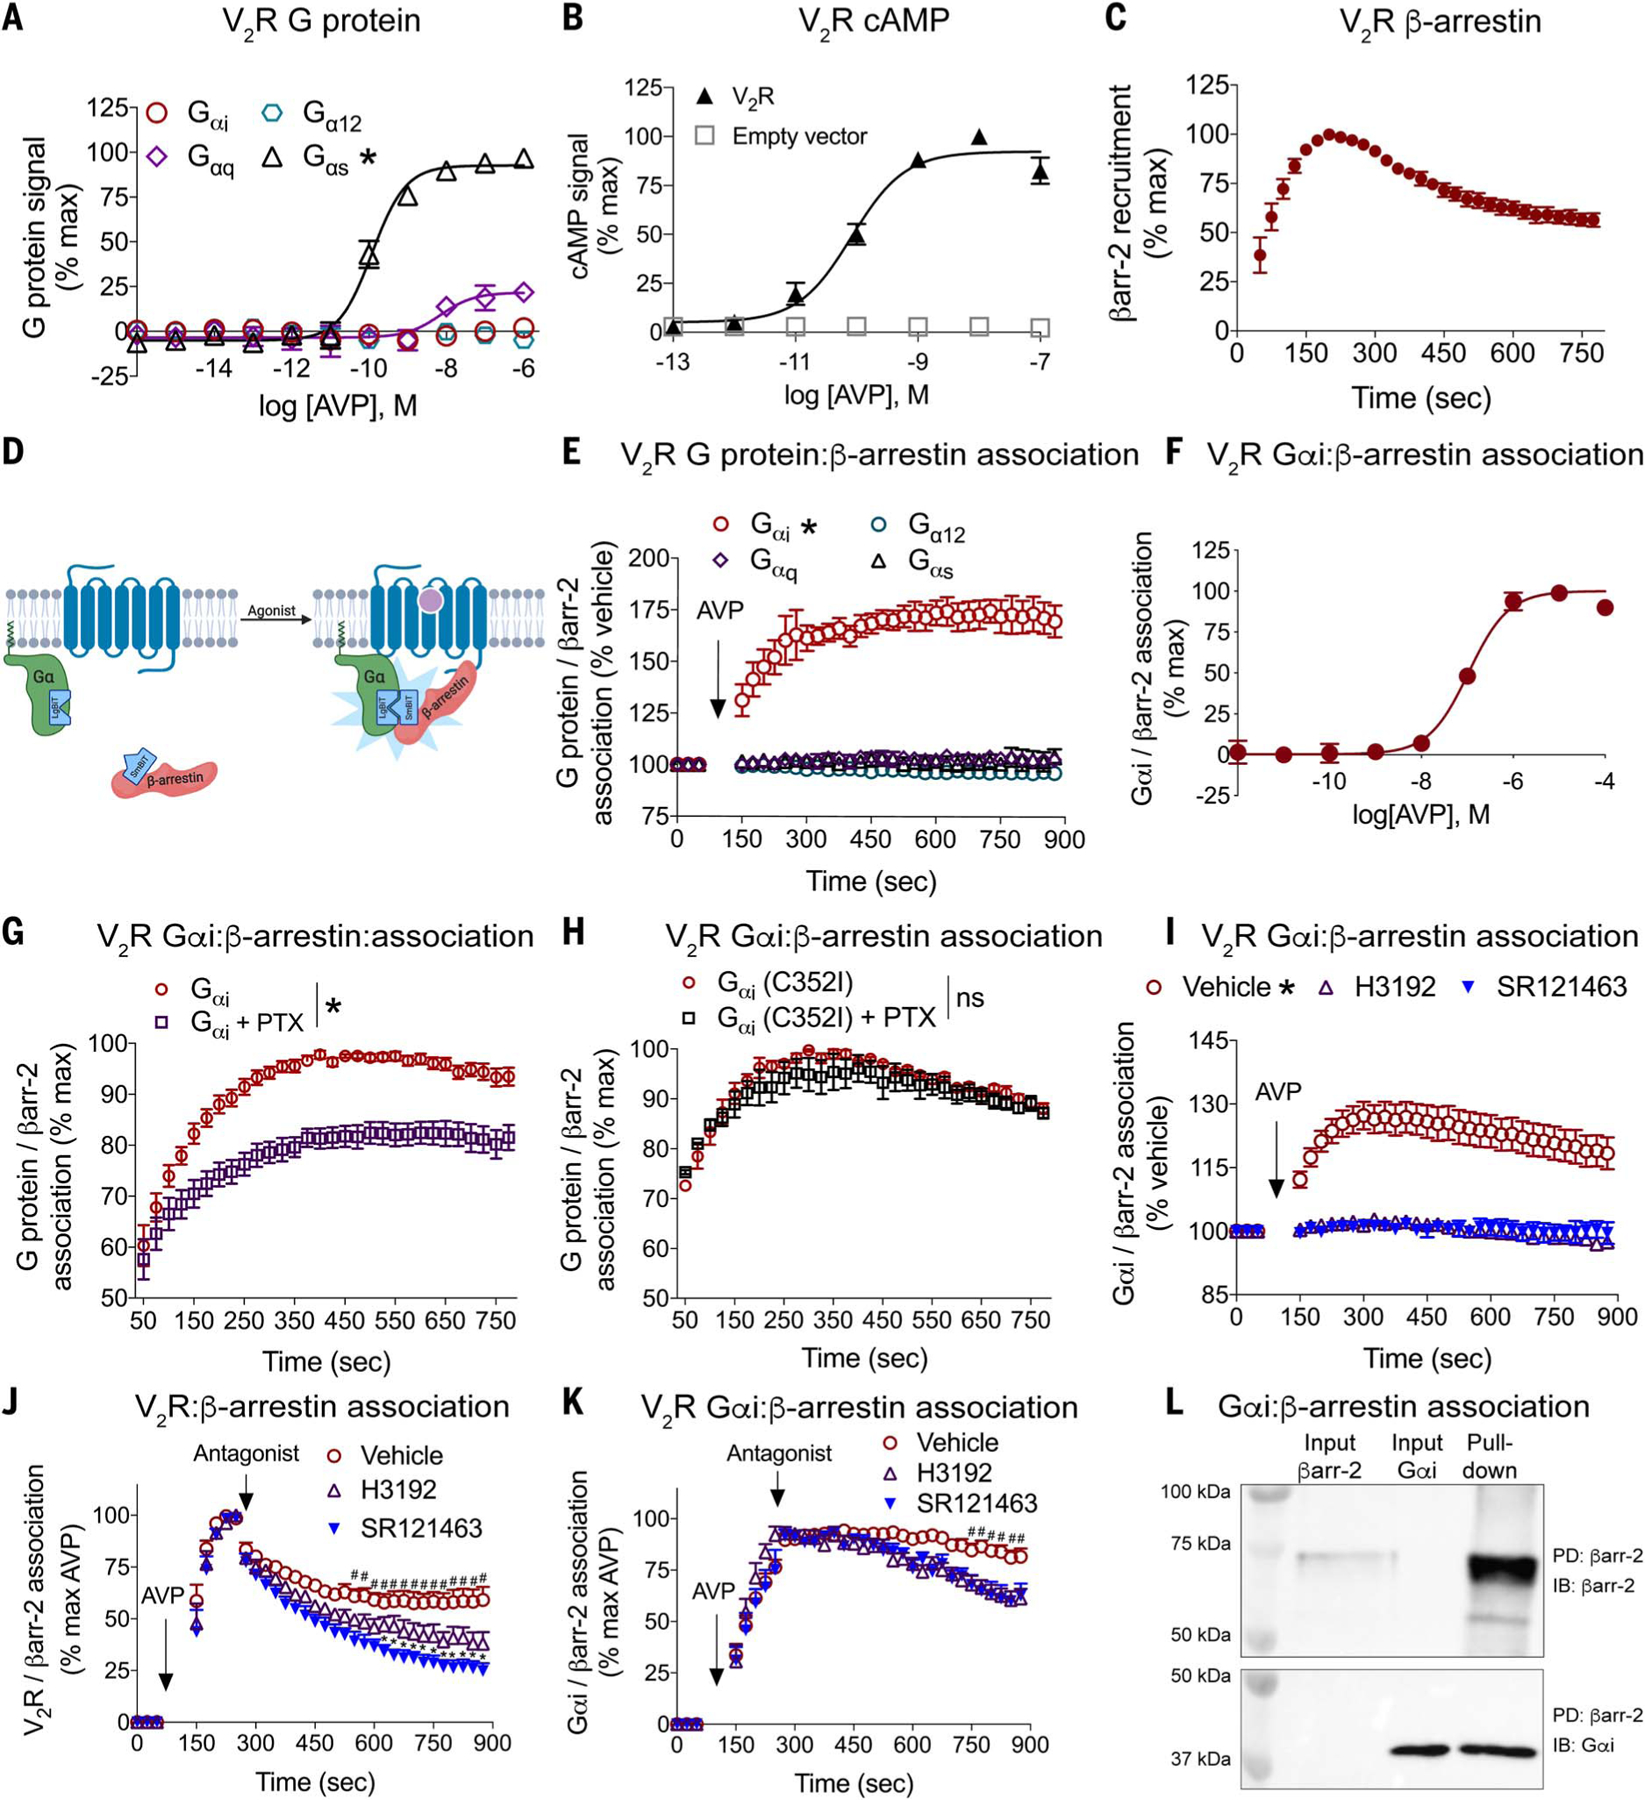
Heterotrimeric guanine nucleotide-binding protein (G protein)-coupled receptors (GPCRs) are common drug targets and canonically couple to specific Gα protein subtypes and β-arrestin adaptor proteins. G protein-mediated signaling and β-arrestin-mediated signaling have been considered separable. We show here that GPCRs promote a direct interaction between Gαi protein subtype family members and β-arrestins regardless of their canonical Gα protein subtype coupling. Gαi:β-arrestin complexes bound extracellular signal-regulated kinase (ERK), and their disruption impaired both ERK activation and cell migration, which is consistent with β-arrestins requiring a functional interaction with Gαi for certain signaling events. These results introduce a GPCR signaling mechanism distinct from canonical G protein activation in which GPCRs cause the formation of Gαi:β-arrestin signaling complexes.


Conflict of interest statement

Competing interests: A patent application for the BRET technique described in this manuscript has been filed on behalf of J.S.S., T.F.P., M.G.C., and S.R. by Duke University. The remaining authors declare no competing interests.

Figures

Fig. 1.
Fig. 1.. G protein:β-arrestin:GPCR complex formation.
(A) Arrangement of luciferase fragments and mKO acceptor fluorophore on G protein (LgBiT), β-arrestin-2 (mKO), and V2R (smBiT). HEK 293T cells were transiently transfected and stimulated with agonist or vehicle. (B) BRET ratio of Gαs-LgBiT:β-arrestin-mKO:V2R-smBiT after AVP (500 nM) treatment. After AVP treatment, an increase in the BRET ratio was observed in cells expressing β-arrestin-mKO but not in cells expressing cytosolic (untagged) mKO. (C) Quantification of Gαs-LgBiT:β-arrestin-mKO:V2R-smBiT complex formation in cells treated with either vehicle or AVP at a single 5-min time point. (D) Similar experiment to panel (B), except testing the ability of Gαi to form a complex. BRET ratio of Gαi-LgBiT:β-arrestin-mKO:V2R-smBiT after treatment with AVP. After AVP treatment, an increase in the BRET ratio was observed in cells expressing β-arrestin-mKO, but not in cells expressing cytosolic mKO [similar to (B)]. (E) Gαi-LgBiT:β-arrestin-mKO:V2R-smBiT formation at a single 5-min time point. (F) Rearrangement of BRET components; Gαi protein (LgBiT), β-arrestin (smBiT), and V2R (mKO). (G) BRET ratio of Gαi-LgBiT:β-arrestin-smBiT:V2R-mKO after AVP treatment. Rearrangement of BRET tags increased the observed signal compared with (D). (H) Five-minute quantification of Gαi-LgBiT:β-arrestin-smBiT:V2R-mKO complexes . (I) Similar experiment to (G), except testing the ability of Gαi-LgBiT:β-arrestin-smBiT to form a complex with the β2AR-mKO as opposed to the V2R-mKO. After isoproterenol (10 μM) treatment, an increase in the BRET ratio was observed in cells expressing β2AR-mKO but not in cells expressing cytosolic mKO. (J) Five-minute quantification of Gαi-LgBiT:β-arrestin-smBiT:β2AR-mKO complexes. For kinetic experiments, *P < 0.05 by two-way ANOVA, Fisher’s post hoc analysis with a significant difference between treatments; for 5-min quantification, *P < 0.05 by Student’s two-tailed t test. For (B) to (E), n = 3 per condition; for (G) to (J), n = 4 per condition. Graphs show mean ± SEM. Cyto, cytoplasmic.
Fig. 2.
Fig. 2.. Confocal microscopy of Gαi:β-arrestin:V2R complexes.
Confocal microscopy analysis of AVP-induced complexes of Gαi:β-arrestin:V2R in HEK 293T cells transfected with mVenus-tagged Gαi, mKO-tagged β-arrestin-2, and Mars1-tagged V2R. (A) Single cells preceding treatment (basal), at 5 min, or at 30 min. Localization of Gαi-mVenus:β-arrestin-mKO:V2R-Mars1 was observed at 5 min, with less at 30 min. Scale bars, 5 mm. (B) Inset of images in (A). Scale bars, 1 mm. (C) Line scan analysis of the 5-min time point demonstrating colocalization of fluorophores after AVP (100 nM) treatment. (D) Line-scan analysis of the 30-min time point. Data are representative of 10 (basal), 20 (5 min), or 15 (30 min) fields of view from three independent experiments.
Fig. 3.
Fig. 3.. Canonically Gαs-coupled V2R forms Gαi:β-arrestin complexes.
(A) Canonical G protein signaling of the V2R. (B) cAMP generation of the V2R. (C) Canonical β-arrestin-2-smBiT recruitment after AVP (500 nM) treatment of the V2R-LgBiT. (D) Arrangement of luciferase fragments on G protein (LgBiT) and β-arrestin (smBiT). (E) Only Gαi-LgBiT formed complexes with β-arrestin-2-smBiT after AVP (500 nM) treatment in cells overexpressing the V2R. (F) Concentration-response on Gαi-LgBiT:β-arrestin-2-smBiT association in cells overexpressing the V2R. (G) Gαi-LgBiT:β-arrestin-2-smBiT complex formation is sensitive to PTX pretreatment. Data are normalized to maximal signal within each replicate. (H) Loss of PTX sensitivity on Gαi-LgBiT:β-arrestin-2-smBiT by mutation of the ADP-ribosylation site (C352). (I) Pretreatment for 30 min with a membrane-permeable (SR121463, 10 μM) or a membrane-impermeable (H3192, 10 μM) V2R antagonist on Gαi-LgBiT:β-arrestin-2-smBiT complex formation. (J) V2R-LgBiT association with β-arrestin-2-smBiT after either membrane-permeable SR121463 or membrane-impermeable H3192 V2R antagonists. (K) Gαi-LgBiT association with β-arrestin-2-smBiT after membrane-permeable (SR121463) or membrane-impermeable (H3192) V2R antagonists. (L) GST-β-arrestin-2 association with purified Gαi. For (A), TGF-α shedding assay was conducted in Δ3G HEK 293T cells. All other experiments were conducted in WT HEK 293T cells overexpressing the indicated assay components. For (A) and (E), *P < 0.05 by two-way ANOVA, with a main effect of Gαs or Gαs, respectively, versus other Gα subunits. For (G) and (H), *P < 0.05 by two-way ANOVA, main effect of PTx treatment. For (I), *P < 0.05 by two-way ANOVA, main effect of vehicle relative to either antagonist. For (J) and (K), *P < 0.05 by two-way ANOVA, Bonferroni post hoc test of vehicle versus either antagonist; #P < 0.05 by two-way ANOVA, Bonferroni post hoc test of SR121463 versus H3192. For (A) to (C), (E), (F), and (H) to (J), n = 3 per condition; for (K), n = 6 to 9 per condition; for (G), n = 8 per condition. (L) is representative of three pulldown experiments. Graphs show mean ± SEM.
Fig. 4.
Fig. 4.. GPCRs form Gαi:β-arrestin complexes irrespective of canonical G protein coupling.
(A to E) Canonical G protein signaling at (A) β2AR, (B) CXCR3, (C) D1R, (D) D2R, and (E) NTS1R assessed with the TGF-α shedding assay. (F to J) Gαi:β-arrestin complex formation at (F) β2AR (10 μM isoproterenol), (G) CXCR3 (1 μM VUF10661), (H) D1R (500 nM dopamine), (I) D2R (500 nM dopamine), and (J) NTS1R (10 nM neurotensin). *P < 0.05 by two-way ANOVA, main effect of Gαi subtype. For (A) to (E), n = 4 per condition. For (F), n = 3 to 6 per condition; for (G), n = 3 to 4 per condition; for (H), n = 4 per condition; for (I), n = 3 to 4 per condition; for (J), n = 3 biological replicates per condition. Graphs show mean + SEM. Iso, isoproterenol.
Fig. 5.
Fig. 5.. Gαi:β-arrestin scaffolds form functional complexes with ERK.
(A) Arrangement of split luciferase components and mKO on Gα protein (LgBiT), β-arrestin (smBiT), or ERK (mKO). (B) BRET of Gαi-LgBiT, β-arrestin-smBiT, and ERK2-mKO in cells overexpressing untagged V2R treated with AVP (500 nM). (C) Representative immunoblot of phospho and total ERK1/2 in Δ3G HEK 293T cells pretreated with PTx (200 ng/ml) and/or βarr1/2 siRNA stimulated with either vehicle or AVP (500 nM). (D) Quantification of ERK immunoblots in Δ3G HEK 293T cells. “100%” represents the maximal signal of phospho ERK/total ERK in the control, vehicle-treated condition. (E) Representative immunoblot of β-arrestin, Gαi, phospho-ERK, and total ERK1/2 in Δ4G HEK 293T cells (lacking all G proteins) transfected with the indicated amounts of Gαi and/or βarr1/2. “100%” represents the signal of phospho ERK/total ERK in the control siRNA, absent PTx, AVP-stimulated condition. (F) Quantification of ERK immunoblots in Δ4G HEK 293T cells. *P< 0.05, ***P < 0.001, two-way ANOVA with Bonferroni post hoc compared with the no-treatment, control siRNA group. The net BRET ratio of cytosolic mKO control was subtracted from the net BRET ratio of ERK-mKO to yield an adjusted BRET ratio that is the ordinate of (B). Immunoblots are representative of four to five separate experiments. For (B), n = 5; for (D), n = 4; and for (F), n = 5 per condition. NT, no transfection of either Gαi or β-arrestin. Graphs show mean ± SEM.
Fig. 6.
Fig. 6.. Cell migration to the β-arrestin–biased ligand TRV120023 requires both Gαi and β-arrestins.
(A) BRET assay quantifying recruitment of β-arrestin-2-YFP to AT1R-RlucII after treatment with either AngII or TRV120023. (B and C) Canonical G protein signaling through the TGF-α shedding assay at the AT1R after treatment with either the endogenous ligand AngII (B) or TRV120023 (C). (D) Representative images of the four TRV120023 migration conditions in HEK 293T cells stably expressing ATIR. (E) Quantification of PTx pretreatment (200 ng/ml) and/or βarr1/2 siRNA on TRV120023-induced migration for the experiment shown in (D). (F) Split luciferase assay for monitoring Gαi-LgBiT:β-arrestin-smBiT association after treatment of AT1R with either AngII or TRV120023. (G) Cartoon schematic of three described GPCR transduction effectors. *P < 0.05, two-way ANOVA with Bonferroni post hoc test compared with the no-treatment, control siRNA group. #P < 0.05, two-way ANOVA with Bonferroni post hoc test compared with control siRNA, PTX-pretreated group. For (A), n = 4; for (B) and (C), n = 4 to 5; for (E) and (F), n = 4 replicates per condition. Graphs show mean ± SEM.

References

    1. Gilman AG, G proteins: Transducers of receptor-generated signals. Annu. Rev. Biochem 56, 615–649 (1987). doi: 10.1146/annurev.bi.56.070187.003151; - DOI - PubMed
    1. Lohse MJ, Benovic JL, Codina J, Caron MG, Lefkowitz RJ, beta-Arrestin: A protein that regulates beta-adrenergic receptor function. Science 248, 1547–1550 (1990). doi: 10.1126/science.2163110; - DOI - PubMed
    1. Lefkowitz RJ, Shenoy SK, Transduction of receptor signals by beta-arrestins. Science 308, 512–517 (2005). doi: 10.1126/science.1109237; - DOI - PubMed
    1. Thomsen ARB et al., GPCR-G protein-β-arrestin super-complex mediates sustained G protein signaling. Cell 166, 907–919 (2016). doi: 10.1016/j.cell.2016.07.004; - DOI - PMC - PubMed
    1. Wehbi VL et al., Noncanonical GPCR signaling arising from a PTH receptor-arrestin-Gβγ complex. Proc. Natl. Acad. Sci. U.S.A 110, 1530–1535 (2013). doi: 10.1073/pnas.1205756110; - DOI - PMC - PubMed

Publication types

MeSH terms

Substances