. 2021 Jan 22;371(6527):eaba6500.
doi: 10.1126/science.aba6500.

Developmental cell programs are co-opted in inflammatory skin disease

Affiliations

Developmental cell programs are co-opted in inflammatory skin disease

Gary Reynolds et al. Science. .

Abstract

The skin confers biophysical and immunological protection through a complex cellular network established early in embryonic development. We profiled the transcriptomes of more than 500,000 single cells from developing human fetal skin, healthy adult skin, and adult skin with atopic dermatitis and psoriasis. We leveraged these datasets to compare cell states across development, homeostasis, and disease. Our analysis revealed an enrichment of innate immune cells in skin during the first trimester and clonal expansion of disease-associated lymphocytes in atopic dermatitis and psoriasis. We uncovered and validated in situ a reemergence of prenatal vascular endothelial cell and macrophage cellular programs in atopic dermatitis and psoriasis lesional skin. These data illustrate the dynamism of cutaneous immunity and provide opportunities for targeting pathological developmental programs in inflammatory skin diseases.


Conflict of interest statement

Competing Interests

None declared

Figures

Figure 1
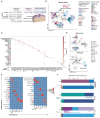
Figure 1. Deconstructing human skin
(a) Number of cells profiled by scRNA-seq and mass cytometry for each condition and schematic of sampling locations. AD = atopic dermatitis (b) UMAP visualization showing all cell states found in the healthy adult scRNA-seq data set, n = 5. KC = keratinocyte, Fb = fibroblast, VE = vascular endothelium, LE = lymphatic endothelium, ILC = innate lymphoid cell, NK = natural killer cell, Tc = cytotoxic T cell, Th = T helper cell, Treg = regulatory T cell, Mac = macrophage, Inf. = inflammatory, DC = dendritic cell, LC = Langerhans cell, Mono mac = monocyte derived macrophage, Mig. = migratory, MoDC = monocyte derived dendritic cell. (c) Dot plot showing the expression of discriminatory markers for each cell state in (b). CD8A, CD163, CD14 and CCR7 were chosen for CyTOF protein validation. (d) UMAPs showing the healthy adult cell states found (top) overlaid on the developing cell states (n=7) and the developing cell states (bottom) overlaid on the healthy adult cell states. Cells underlaid are shown in grey. (e) Median prediction score of developing skin cell states using healthy adult skin as reference derived from the TransferAnchors function in Seurat. Triangles refer to developing skin cells and circles refer to adult skin cells. (f) Bar charts showing the proportions of corresponding cell states found in adult and developing skin. Generalized linear modelling on a quasibinomial distribution was used to compare proportions between development and adult skin and showed statistically significant changes in vascular endothelium, Schwann and melanocytes (p-value = 3.1x10⁻⁷), keratinocytes (p-value = 3.1x10⁻⁴), LCs and DCs (p-value = 1.4x10⁻⁴) and fibroblasts (p-value = 4.0x10⁻⁴). Stars denote significance.
Figure 2
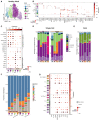
Figure 2. Skin innate lymphoid cells, T lymphocytes and TCR analysis
(a) UMAP visualization of lymphoid cells in healthy adult skin. ILC=innate lymphoid cell, NK=natural killer cell, Tc=cytotoxic T cell, Th=T helper cell, Treg=regulatory T cell, n=5 (b) Dot plot showing expression of marker genes of cell states found in adult skin (circles) shown in (a) and their developmental counterparts (triangles), separated by the dashed line. (c) Dot plot showing the differentially expressed genes in T cell subsets between epidermis and dermis in healthy adult skin, n= 5, Epi= epidermis, Derm= dermis. (d) Bar charts showing the proportions of lymphoid cell states in healthy and diseased skin. Tc IL13/IL22= cytotoxic T cells expressing IL13 and IL22, Tc17/Th17= T cells expressing IL17A and IL17F. Lesional dermal AD skin Tc IL13/IL22 compared to non-lesional dermal AD skin (modelled counts as negative binomial and analysed by ANOVA, * p-value= 0.04), and psoriasis epidermal lesional skin Tc17/Th17 compared to psoriasis non-lesional epidermis (*** p-value < 0.001). Significance of other cell states were not tested. HA = healthy adult, AD = atopic dermatitis, P= psoriasis, L= lesional, NL = non lesional. (e) Proportion of cells with Tc IL13/IL22 and Tc17/Th17 signature present in bulk RNA-seq data from GSE121212. Modelling the data on a quasibinomial distribution, lesional AD dermis is enriched for Tc IL13/IL22 (p-value= 3.4x10⁻²) and Treg (p-value= 3.2x10⁻²) compared to non-lesional skin. Lesional psoriatic epidermis is enriched for Tc17/Th17 (p-value= 1.6x10-05), Treg (p-value = 4.6x10x10-7) and Tc (p-value = 2.5x10⁻⁴) compared to non-lesional. p-values calculated using a likelihood ratio test. Stars denote significance. (f) Bar charts showing clonotype size in each T cell subset in lesional AD (left) and psoriasis (right). The color of the bar relates to the size of the clonotype. Modelling the data on a quasibinomial distribution, lesional AD dermis Tc IL13/IL22 have a higher proportion of clonotypes ≥ 2 cells compared to Th (p-value = 3.3x10⁻²) and lesional psoriasis Tc17/Th17 have a higher proportion of clonotypes ≥ 2 cells than Tregs (p-value = 1.6x10⁻²) with other comparisons not significant. p-values calculated using a likelihood ratio test. Stars denote significance and bars across the top show significance between cell types. (g) Dot plot showing the expression of significantly differentially expressed genes between non-clonal and clonal T cells in AD (top) and psoriasis (bottom). Hatched colored circles indicate non-clonal T cells and colored circles, clonal T cells.
Figure 3
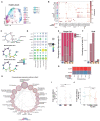
Figure 3. Dermal and epidermal mononuclear phagocytes
(a) UMAP visualization of different antigen presenting cell (APC) states found in healthy adult skin (n=5). LC = Langerhans cell, DC = dendritic cell, Mig. = migratory, Mac = macrophage, Mono mac = monocyte derived macrophage, MoDC = monocyte derived dendritic cell, inf. = inflammatory. (b) Dot plot showing the expression of differentially expressed genes characterizing adult healthy skin cell states (circles) shown in (a) and their developmental counterparts (triangles), separated by the dashed line. (c) Upper panel: abstracted graph (PAGA) showing connectivity between adult healthy skin DC clusters. The size of the nodes is proportional to cluster size and edge thickness is proportional to the strength of the connection between nodes. Lower panel: enrichment of gene signatures for murine splenic Xcr1+DC (DC1) and dermal CD11c+ (DC2) in each node. Av = average (d) Dot plot of enrichment of gene signature of APC cell types in adult human disease and developing thymus, SF = synovial fluid. (e) Bar charts showing the proportions of Mac1 and Mac2 in adult healthy, AD and psoriasis skin. HA = healthy adult, AD = atopic dermatitis, P = psoriasis, L = lesional, NL = non lesional. Mac2 are significantly expanded in both lesional AD and psoriasis skin, and Mac1 are significantly reduced in both lesional AD and psoriasis skin. Mac1 p-values = 5.4x10⁻³ (AD lesional) 3.3x10⁻⁵ (psoriasis lesional) and Mac2 p-values = 6.3x10⁻³ (AD non lesional), 6.0x10⁻⁵ (AD lesional) and 1.4x10⁻⁶ (psoriasis lesional). p-values calculated using a likelihood ratio test. Stars denote significance. (f) Proportion of cells with Mac2 signature present in bulk RNA-seq data from GSE121212. Generalized linear modelling on a quasibinomial distribution was used to compare proportions of predicted Mac2 between healthy and lesional skin and showed statistically significant expansion of Mac2 in lesional AD (p-value = 1.7x10⁻⁷). p-values calculated using a likelihood ratio test. Stars denote significance. (g) Prediction score for alignment using CCA (Seurat) between developing gut, kidney, liver, skin and thymus macrophages with Mac1 and Mac2 in healthy adult skin. (h) Network visualizations of pathways conserved between developing skin macrophages and Mac2 in AD and psoriasis. Network nodes are colored by enrichment score (q = <0.05) and represent individual enriched gene sets whilst edges represent shared genes between nodes (intersect≥10%). (i) Jitter plot displaying the number of positive F13A cells in 4x104 μm2 of healthy adult (n=7), AD (n=12) and psoriasis (n=6) skin. (p-values between healthy adult and AD = 6.6x10⁻⁴ and between healthy adult and psoriasis = 1.2x10⁻³). (j) Jitter plot displaying the number of positive F13A cells in 4x104 μm2 of AD skin (n=5) before treatment with methotrexate and 9-16 days and 12 weeks post treatment. (p-values between pre and 9-16 days post treatment = 1.5x10⁻² and between 9-16 days and 12 weeks post treatment = 2.0x10⁻³).
Figure 4
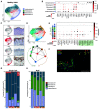
Figure 4. Keratinocyte cell states in health, AD and psoriasis
(a) Force-directed graph (FDG) visualization of the different keratinocyte cell states found in healthy adult skin. KC = keratinocyte. Asterix indicates the cell state with inflammatory markers, n=5. (b) Dot plot showing the expression of differentially expressed genes characterizing keratinocyte states in healthy adult skin (circle) shown in (a) and developmental keratinocytes (triangle), separated by the dashed line. (c) FDG feature plots showing gene expression of healthy adult skin keratinocyte cell states shown in (a), together with images of these markers in situ, from the Human Protein Atlas. Scale bars represent 100 μm. (d) Top panel: FDG in (a) annotated by Leiden clustering of eight groups; undifferentiated KC (clusters 1, 5), proliferating (cluster 2), differentiated KC (clusters 3, 4, 6, 7), differentiated KC* (cluster 8). Bottom panel: PAGA showing the relative connectivity between the keratinocyte clusters. Arrows indicate the two differentiation pathways of basal keratinocytes to suprabasal: LB = lamellar body. (e) Dot plot of genes related to lamellar body production and ichthyosis (green box) expressed by healthy adult keratinocyte states (circle) shown in (d), as well as fetal keratinocytes (triangle). Un.= undifferentiated, Diff = differentiated. (f) Immunofluorescence staining of healthy adult skin for CDK1 (red), IRF1 (green), SOX9 (yellow) and DAPI (blue). Red and yellow arrows indicate CDK1+ and SOX9+ cells respectively in suprabasal layers. Images representative of n = 3 donors. Scale bars represent 100μm. (g) Bar charts showing the proportions of the keratinocyte cell states in healthy and diseased skin. p-values for undifferentiated KC AD lesional = 6.1x10⁻⁴ and psoriasis lesional = 3.0x10⁻⁵; differentiated KCs AD lesional = 6.5x10⁻¹⁶, psoriasis non lesional = 6.5x10⁻⁷ and psoriasis lesional = 8.8x10⁻²⁰; differentiated KCs* psoriasis non lesional = 2.3x10⁻² and psoriasis lesional = 1.5x10⁻⁴; proliferating KCs AD non lesional = 6.5x10⁻¹⁰ and psoriasis lesional = 8.1x10⁻¹⁴. Populations are compared to those in healthy adult. p-values calculated using a likelihood ratio test. Stars denote significance. (h) Percentage of cells with undifferentiated, differentiated and proliferating keratinocyte signature present in bulk RNA-seq data from GSE121212. Generalized linear modelling on a quasibinomial distribution was used to compare proportions of predicted keratinocyte subsets between healthy, non-lesional and lesional skin and showed statistically significant expansion of differentiated keratinocytes in non-lesional AD (p-value = l.1x10-3), lesional AD (p-value = 9.6x10⁻¹⁰), non-lesional psoriasis (p-value = 2.1x10⁻⁵) and lesional psoriasis (p-value = 2.0x10⁻¹⁶).
Figure 5
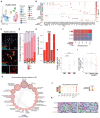
Figure 5. Stromal and endothelial cells
(a) UMAP visualization of the non-immune, non-keratinocyte cell states found in the healthy adult skin, n=5. Fb = fibroblast, LE = lymphatic endothelium, VE = vascular endothelium. (b) Dot plot showing the expression of differentially expressed genes characterizing adult healthy skin cell states (circle) shown in (a) and their developmental counterparts (triangle), separated by the dashed line. (c) 3D Reconstruction of Z-stacked images of whole mount immunofluorescence staining of dermis for CD31 (PECAM1, red), gamma synuclein (SNCG, green) and DRAQ5 (blue). White cubes represent 40x40x40 μm. (d) Bar charts showing the proportions of VE in healthy adult and diseased skin. p-values for VE1 psoriasis non-lesional = 5.5 x 10⁻⁶ and psoriasis lesional = 5.0 x 10⁻¹⁵, VE2 psoriasis non-lesional = 1.9 x 10⁻², and VE3 AD non-lesional = 1.3 x 10⁻², AD lesional = 1.5 x 10⁻⁴, psoriasis non-lesional = 1.3 x 10⁻³ and psoriasis lesional = 6.2 x 10⁻⁹, calculated using a likelihood ratio test. Stars denote significance. (e) Proportion of cells with VE3 signature present in bulk RNA-seq data from GSE121212. The proportion of VE3 increased in both lesional AD (p-value = 9.1x10⁻⁴) and psoriasis (p-value = 8.2 x 10⁻⁴). Stars denote significance. p-values calculated using a likelihood ratio test. (f) Prediction score for alignment using CCA (Seurat) between developing gut, kidney, liver, skin and thymus VE with VE1, VE2 and VE3 in healthy adult skin. (g) Network visualizations of pathways conserved between developing skin VE and VE3 in AD and psoriasis. Network nodes are colored by enrichment score (q = <0.05) and represent individual enriched gene sets whilst edges represent shared genes between nodes (intersect≥ 10%). (h) Jitter plot displaying the number of positive ACKR1 cells in 1.5x105 μm2 of healthy adult (n=6), AD (n=12) and psoriasis (n=6) skin. (Anova p-values between healthy adult and AD = 3.0x10⁻⁵ and between healthy adult and psoriasis = 2.4x10⁻¹³). Stars denote significance. (i) Jitter plot displaying the number of positive ACKR1 cells in 1.5x105 μm2 of AD skin (n=5) before treatment with methotrexate and 9-16 days and 12 weeks post treatment. (Anova p-values between pre and 12 weeks post treatment = 5.0x10⁻²). Stars denote significance. (j) Interactions between macrophage and vascular endothelium subsets predicted by CellPhoneDB. Color and size indicate log2 mean expression, averaged across the two clusters. Dev = developing skin (k) Immunohistochemical staining of AD (left) and psoriasis (right) skin for F13A (purple), ACKR1 (yellow) and CD31 (teal) showing the close proximity of Mac2 and VE3. Pink arrows point to F13A positive macrophages and green arrows point to CD31/ACKR1 positive vascular endothelial cells. Scale bar is 20μm. Representative image from n=4 for AD and n=6 for psoriasis shown.

Comment in

References

    1. Jessa S, Blanchet-Cohen A, Krug B, Vladoiu M, Coutelier M, Faury D, et al. Stalled developmental programs at the root of pediatric brain tumors. Nat Genet. 2019;51:1702–1713. - PMC - PubMed
    1. Tirosh I, Venteicher AS, Hebert C, Escalante LE, Patel AP, Yizhak K, et al. Single-cell RNA-seq supports a developmental hierarchy in human oligodendroglioma. Nature. 2016;539:309–313. - PMC - PubMed
    1. Francis R, Guo H, Streutker C, Ahmed M, Yung T, Dirks PB, et al. Gastrointestinal transcription factors drive lineage-specific developmental programs in organ specification and cancer. Sci Adv. 2019;5:eaax8898. - PMC - PubMed
    1. Pomerantz MM, Qiu X, Zhu Y, Takeda DY, Pan W, Baca SC, et al. Prostate cancer reactivates developmental epigenomic programs during metastatic progression. Nat Genet. 2020;52:790–799. - PMC - PubMed
    1. Guttman-Yassky E, Krueger JG. Atopic dermatitis and psoriasis: two different immune diseases or one spectrum? Curr Opin Immunol. 2017;48:68–73. - PubMed

Publication types

MeSH terms