. 2021 Jan 22;371(6527):405-410.
doi: 10.1126/science.abb2683.

Glycolysis fuels phosphoinositide 3-kinase signaling to bolster T cell immunity

Affiliations

Glycolysis fuels phosphoinositide 3-kinase signaling to bolster T cell immunity

Ke Xu et al. Science. .

Abstract

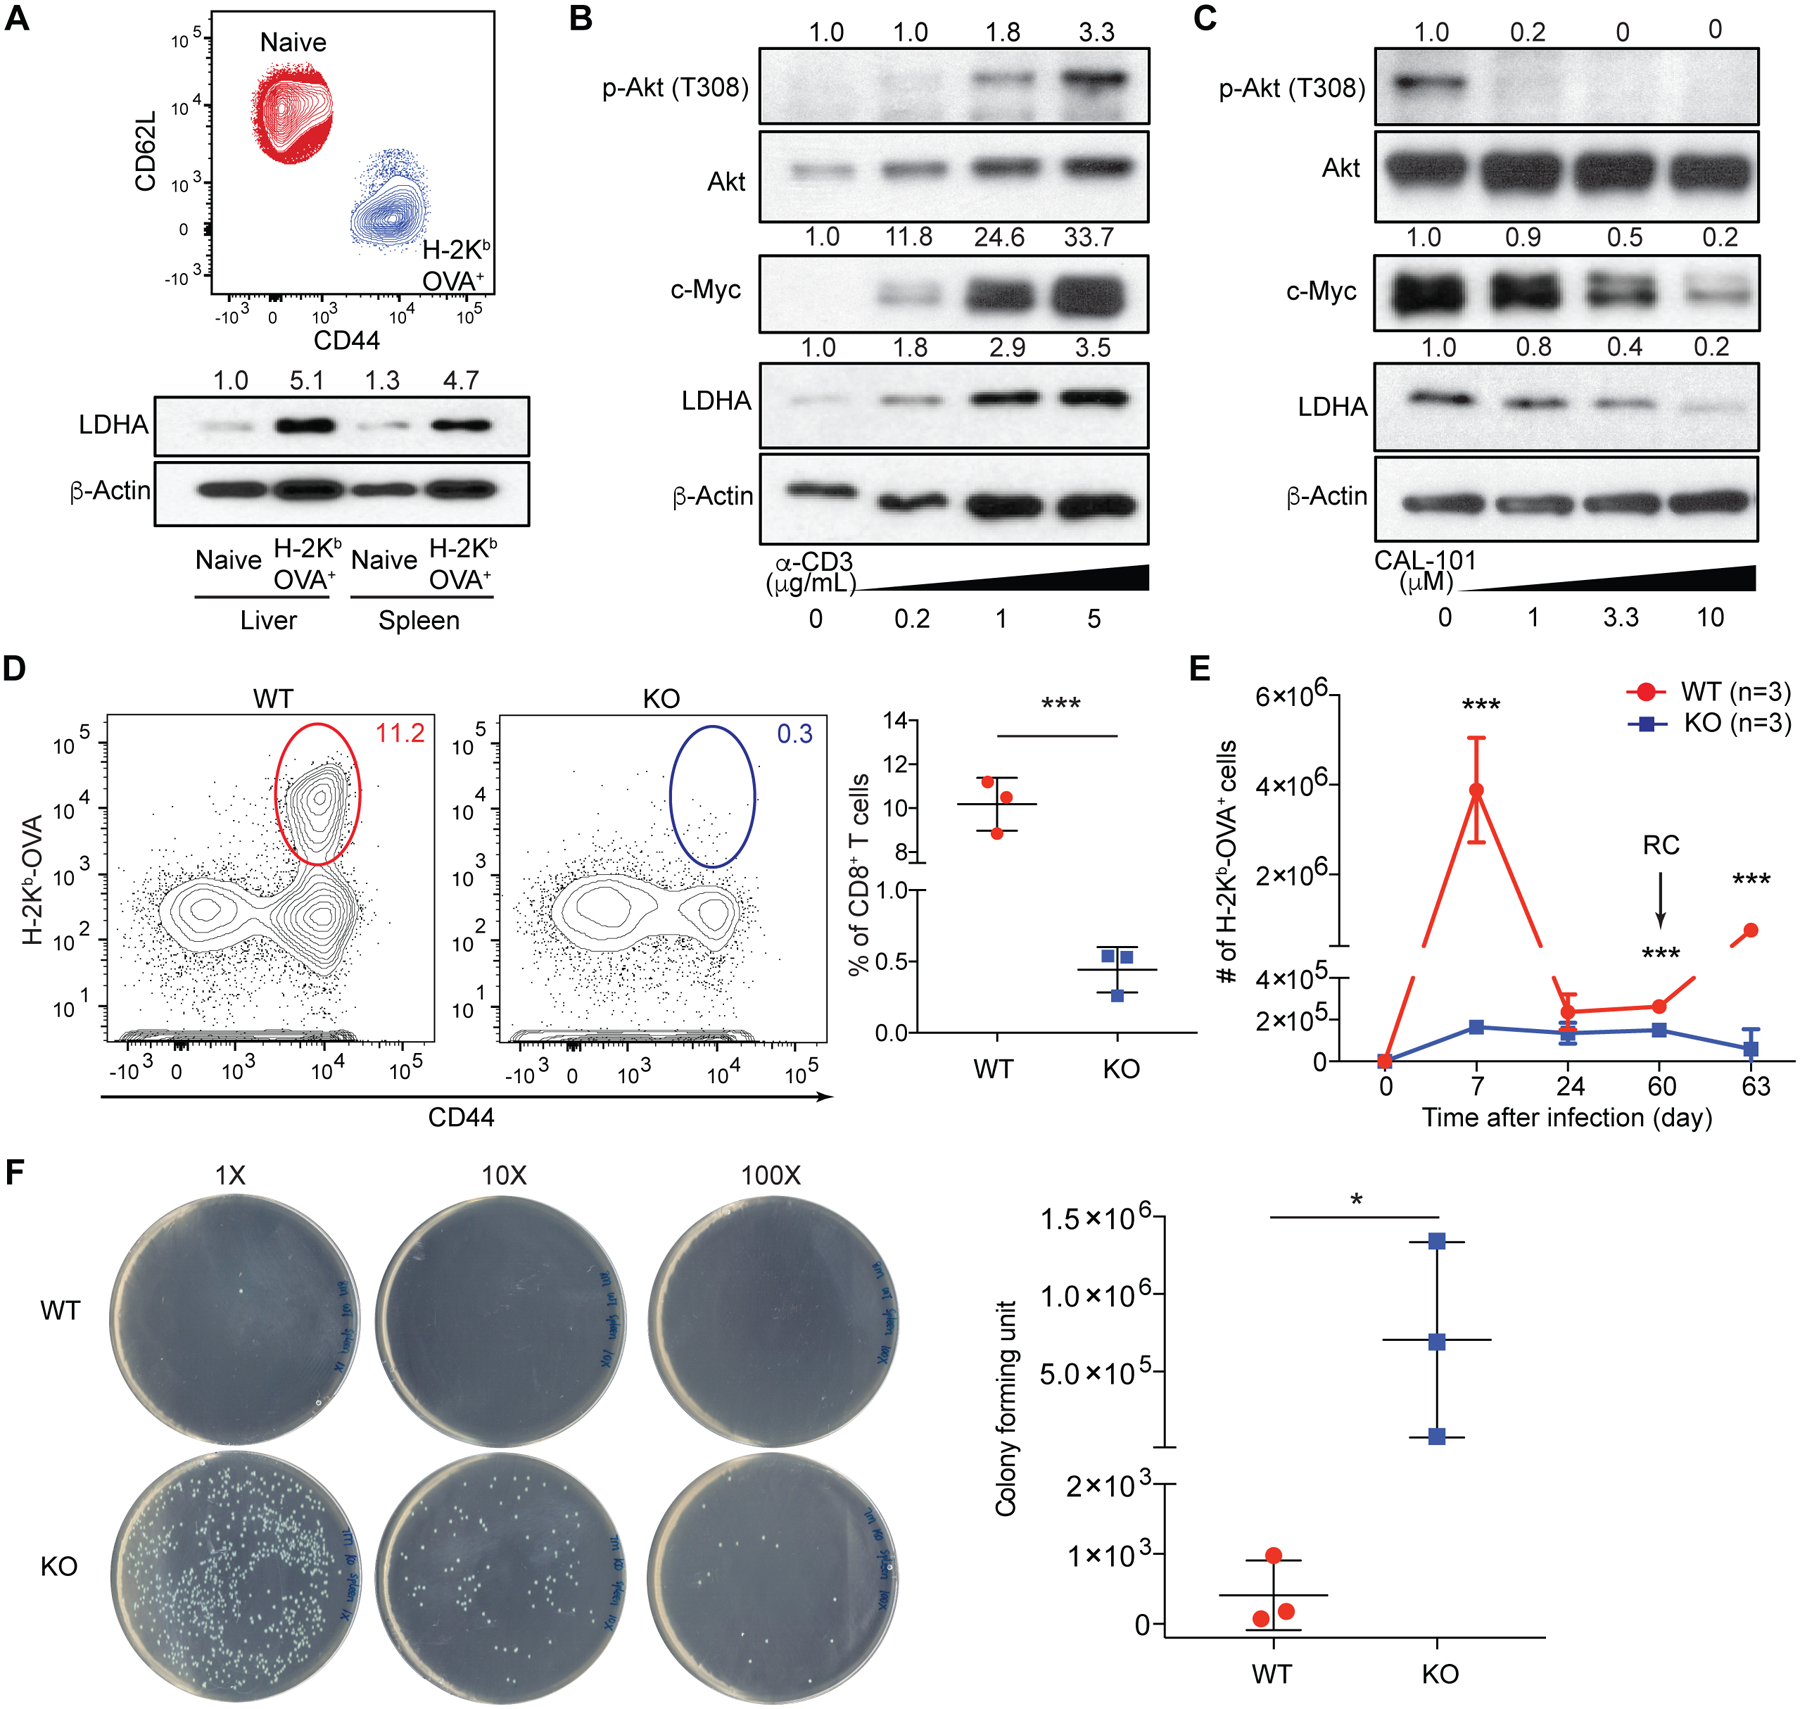
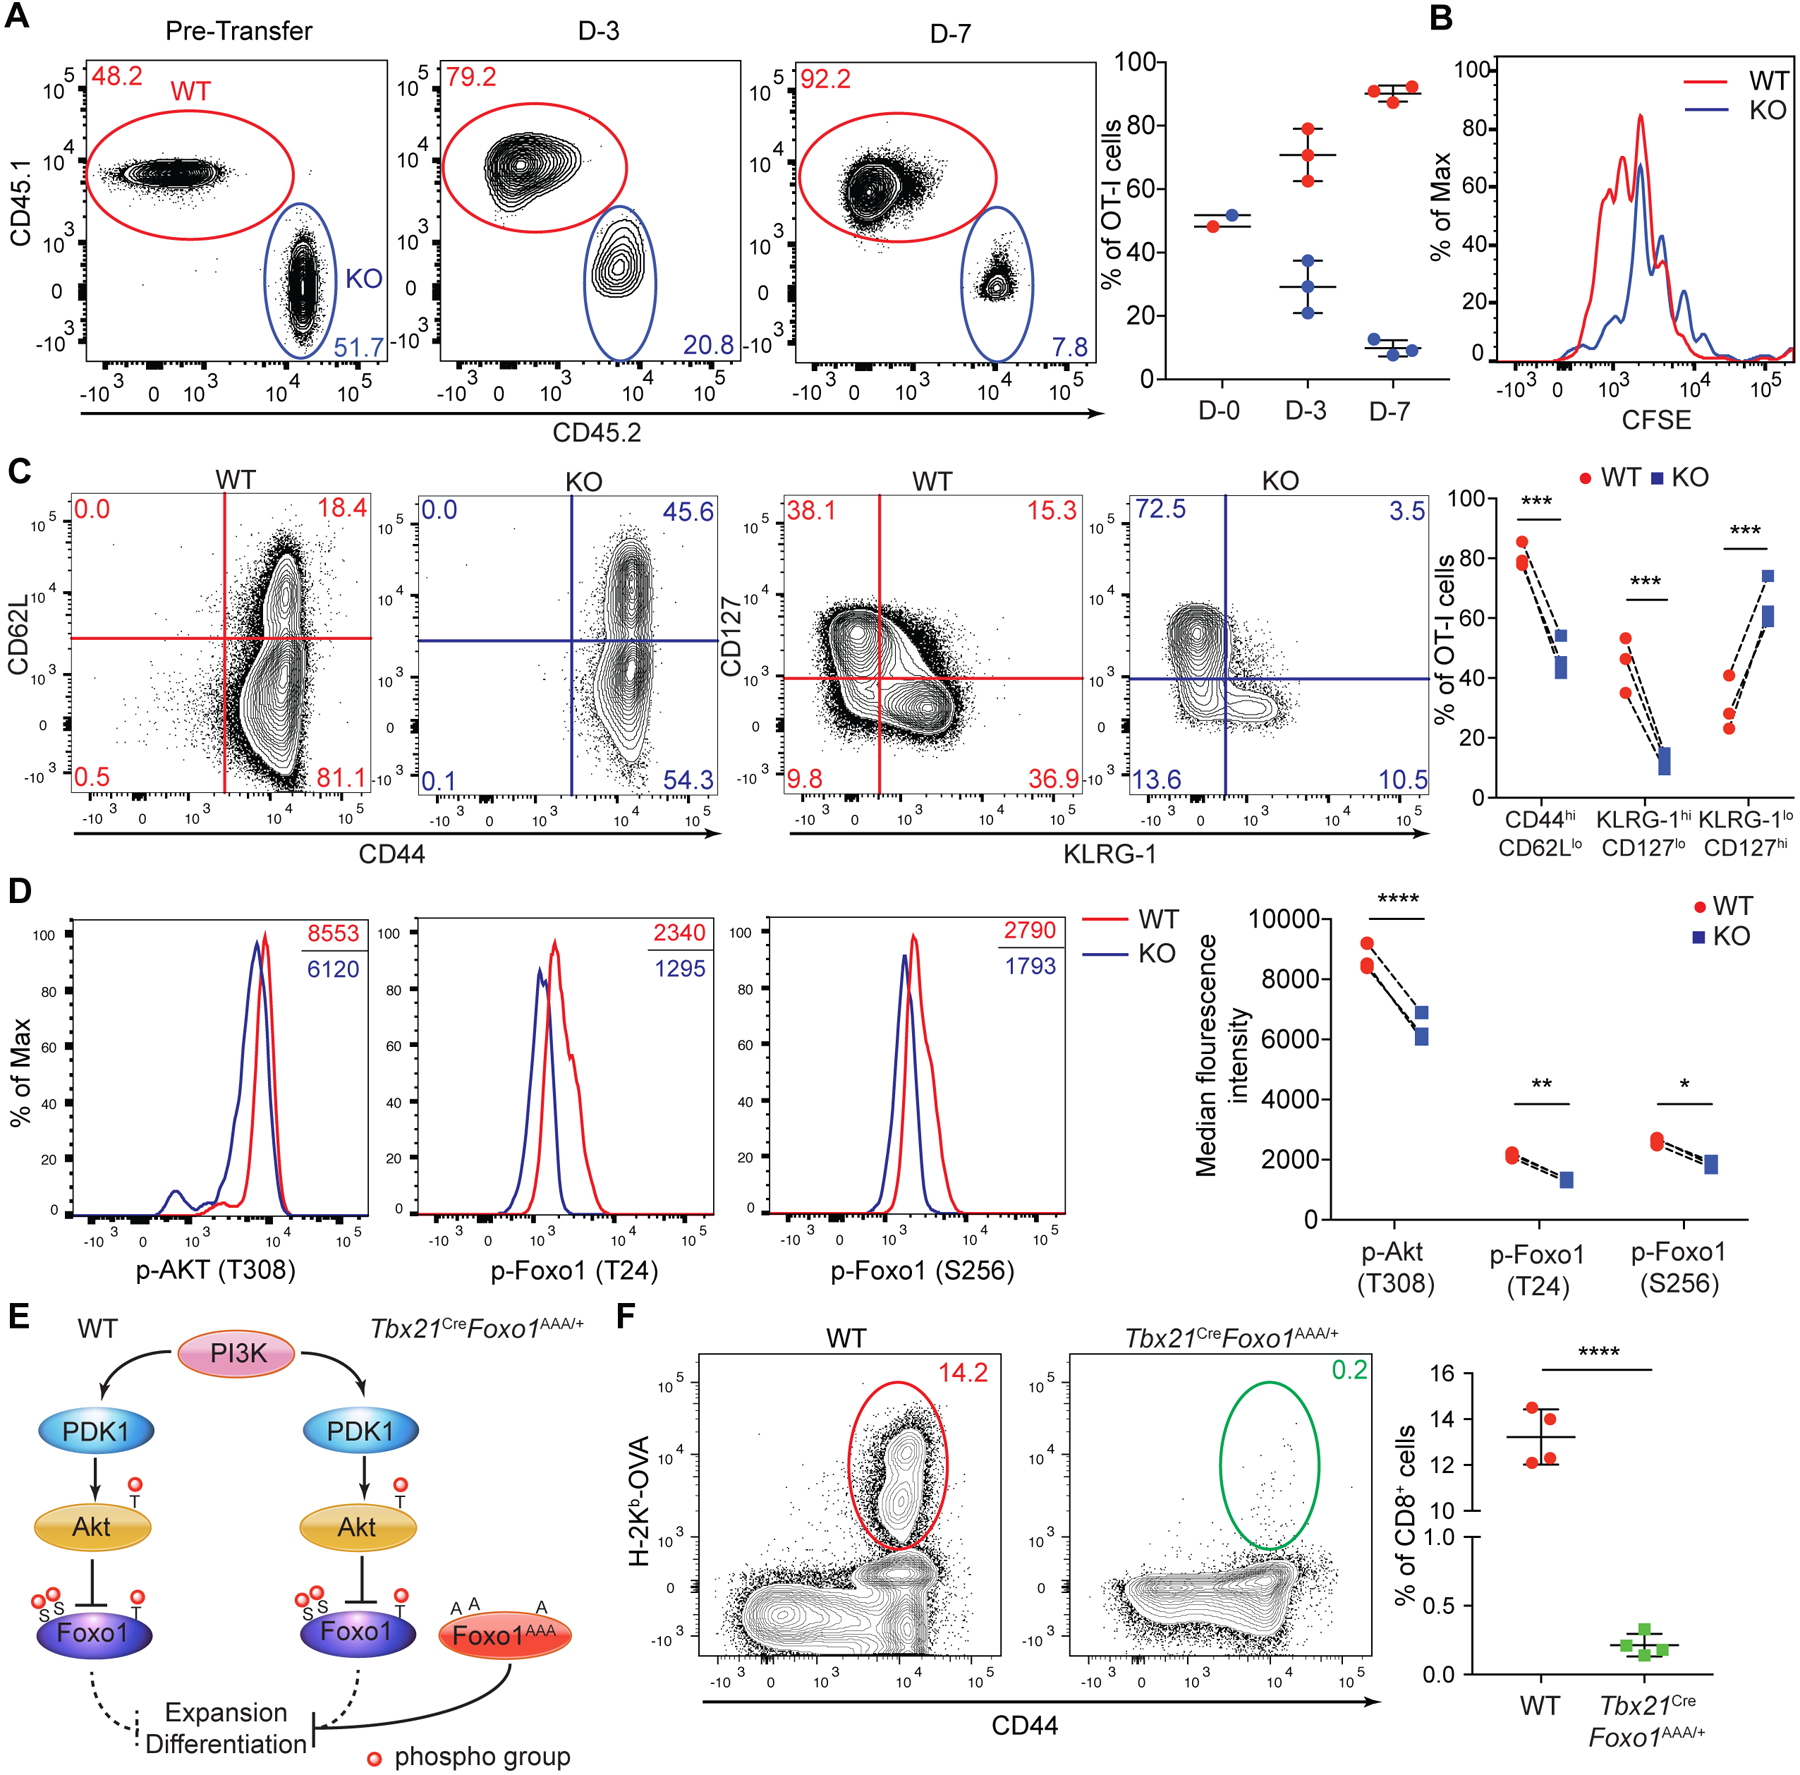
Infection triggers expansion and effector differentiation of T cells specific for microbial antigens in association with metabolic reprograming. We found that the glycolytic enzyme lactate dehydrogenase A (LDHA) is induced in CD8+ T effector cells through phosphoinositide 3-kinase (PI3K) signaling. In turn, ablation of LDHA inhibits PI3K-dependent phosphorylation of Akt and its transcription factor target Foxo1, causing defective antimicrobial immunity. LDHA deficiency cripples cellular redox control and diminishes adenosine triphosphate (ATP) production in effector T cells, resulting in attenuated PI3K signaling. Thus, nutrient metabolism and growth factor signaling are highly integrated processes, with glycolytic ATP serving as a rheostat to gauge PI3K-Akt-Foxo1 signaling in the control of T cell immunity. Such a bioenergetic mechanism for the regulation of signaling may explain the Warburg effect.


Conflict of interest statement

Competing interests: The authors declare no competing interests.

Figures

Fig. 1.
Fig. 1.. PI3K-dependent expression of LDHA in CD8+ effector T cells is essential for antibacterial immunity
(A) Flow cytometric analysis of CD44 and CD62L expression in splenic naïve and H-2Kb-OVA+ CD8+ T cells 7 days post LM-OVA infection. Immunoblotting and normalized expression of LDHA to β-actin. (B) Naïve CD8+ T cells were stimulated with anti-CD3 in the presence of anti-CD28, and IL-2. Immunoblotting and normalized expression of p-Akt (T308) to Akt as well as c-Myc and LDHA to β-actin. (C) Naïve CD8+ T cells were stimulated with anti-CD3, anti-CD28, and IL-2 in the presence of the PI3K inhibitor, CAL-101. Immunoblotting and normalized expression of p-Akt (T308) to Akt as well as c-Myc and LDHA to β-actin. (D to F) Ldhafl/fl (wild-type, WT) and Tbx21CreLdhafl/fl (knockout, KO) mice were infected followed or not by re-challenge (RC) with LM-OVA. (D) Representative flow cytometry plots and frequencies of splenic H-2Kb-OVA+ CD8+ T cells 7 days post LM-OVA infection. (E) H-2Kb-OVA+ CD8+ T cells were enumerated 7, 24, 60 days post-infection, and day-3 post-secondary infection. (F) Splenic bacterial burden from day-3-RC mice. Data are representative of three (A to C) and two (D to F, n= 3 per genotype, mean ± SD) independent experiments. Unpaired t tests for the measurements between the two groups (D and F) and multiple t tests between the two groups (E): *p<0.05 and ***p<0.001.
Fig. 2.
Fig. 2.. LDHA deficiency impairs Akt and Foxo1 phosphorylation causing defective CD8+ T cell expansion and differentiation
(A to D) Congenically marked naïve Ldhafl/fl (wild-type, WT) and Tbx21CreLdhafl/fl (knockout, KO) OT-I T cells were CFSE-labeled, mixed at a 1:1 ratio and transferred into wild-type recipient mice followed by infection with LM-OVA. (A) Representative plots and ratios (mean ± SD) of splenic WT and KO OT-I T cells day-3 and day-7 post-infection. (B) Proliferation of splenic WT and KO OT-I T cells at day-3 post-infection was assessed by CFSE dilution. (C) Representative flow cytometry plots of CD44, CD62L, CD127, and KLRG-1 expression and the percentages of CD44hiCD62Llo, KLRG-1hiCD127lo, and KLRG-1loCD127hi populations among splenic WT and KO OT-I T cells from recipient mice day-7 post-infection. (D) Representative flow cytometry plots and median florescence intensities of p-Akt (T308), p-Foxo1 (T24), and p-Foxo1 (S256) in splenic WT and KO OT- I T cells. (E) A schematic of the PI3K-Akt-Foxo1 signaling pathway. Foxo1AAA was engineered to resist AKT-mediated repression by replacing three phosphorylation sites T24, S256, and S319 with alanine (A). (F) Representative flow cytometry plots and frequencies of splenic H-2Kb-OVA+ CD8+ T cells in WT and Tbx21CreFoxo1AAA/+ mice 7 days post LM-OVA infection (n=4 per genotype, mean ± SD). Data are representative of at least three independent experiments (A to F). Paired t tests for the measurements between the two groups (C and D) and unpaired t test for the measurements between the two groups (F): *p<0.05, **p<0.01, ***p<0.001, and ****p<0.0001.
Fig. 3.
Fig. 3.. Reduced glycolytic ATP production accounts for defective PI3K-Akt-Foxo1 signaling in LDHA-deficient T cells following antigen stimulation
(A) A schematic depicting how naïve CD8+ T cells were treated for assessment of kinase signaling and PIP3 generation. (B) Naïve Ldhafl/fl (wild-type, WT) and Cd4CreLdhafl/fl (knockout, KO) CD8+ T cells were stimulated with anti-CD3, anti-CD28, and IL-2 for 3 days. Day-3 activated T cells and freshly isolated naïve WT and KO CD8+ T cells were left untreated, or labeled with biotinylated anti-CD3 and anti-CD28 and activated by streptavidin crosslinking. Immunoblotting and normalized expression of p-Akt (T308) to Akt, p-Foxo1 (T24) or p-Foxo1 (S256) to Foxo1, p-Zap70 (T319) to Zap70, p-LAT (T191) to LAT, and p-AMPKα (T172) to AMPKα. (C) Day-3 activated WT and KO CD8+ T cells were collected, rested in RPMI-1640 medium, and incubated in the absence or presence of ATP and/or Streptolysin O (SLO). T cells were subsequently restimulated with biotinylated anti-CD3 and anti-CD28 through streptavidin crosslinking. Immunoblotting and normalized expression of p-Akt (T308) to Akt, and p-Foxo1 (T24) or p-Foxo1 (S256) to Foxo1. (D) Representative immunofluorescent images of PIP3 and its quantification in WT and KO CD8+ T cells after receiving the indicated treatments as described in (C). Each dot represents one cell and the scale bar represents 5 micrometers. Data are representative of three (A to C) or two (D) independent experiments. Two-way ANOVA test for the measurements between the two groups (D): **p<0.01 and ****p<0.0001.
Fig. 4.
Fig. 4.. Mitochondrial respiration, but not ATP production, promotes Akt-Foxo1 signaling in activated T cells
(A) A schematic depicting electron transfer and disposition by cytosolic LDHA and mitochondrial electron transport chain (ETC) associated with NADH to NAD+ conversion. (B) Naïve Ldhafl/fl (wild-type, WT) and Cd4CreLdhafl/fl (knockout, KO) CD8+ T cells were stimulated with anti-CD3, anti-CD28, and IL-2 for 3 days. The amounts of NADH and NAD+ were measured. The ratios of NAD+ over NADH are plotted. (C) Measurements and quantifications of oxygen consumption rate (OCR) and spared respiratory capacity (SRC) of day-3 activated WT and KO CD8+ T cells. Sequential chemical treatments are indicated as shown in the graph. Oligo: oligomycin; FCCP: Trifluoromethoxy carbonylcyanide phenylhydrazone; Ant: antimycin; Rot: rotenone. (n=5 per genotype, mean ± SD) (D) A schematic of mitochondrial ETC, proton distribution, and ATP synthetase activity under the indicated treatment conditions. (E) Day-3 activated WT and KO CD8+ T cells were collected, and incubated in RPMI-1640 medium in the absence or presence of oligomycin and/or FCCP. T cells were subsequently restimulated with biotinylated anti-CD3 and anti-CD28 through streptavidin crosslinking. Immunoblotting and normalized expression of p-Akt (T308) to Akt, and p-Foxo1 (T24) or p-Foxo1 (S256) to Foxo1. Data are representative of three independent experiments (B, C and E). Unpaired t tests for the measurements between the two groups (B and C): **p<0.01 and ****p<0.0001.

References

    1. Wang R, Green DR, Metabolic checkpoints in activated T cells. Nat Immunol 13, 907–915 (2012). - PubMed
    1. MacIver NJ, Michalek RD, Rathmell JC, Metabolic regulation of T lymphocytes. Annu Rev Immunol 31, 259–283 (2013). - PMC - PubMed
    1. Chapman NM, Boothby MR, Chi H, Metabolic coordination of T cell quiescence and activation. Nat Rev Immunol 20, 55–70 (2020). - PubMed
    1. Pearce EL, Poffenberger MC, Chang CH, Jones RG, Fueling immunity: insights into metabolism and lymphocyte function. Science 342, 1242454 (2013). - PMC - PubMed
    1. Peng M et al., Aerobic glycolysis promotes T helper 1 cell differentiation through an epigenetic mechanism. Science 354, 481–484 (2016). - PMC - PubMed

Publication types

Substances