

Neighborhood Child Opportunity Index and Adolescent Cardiometabolic Risk
- PMID: 33479165
- PMCID: PMC7906069
- DOI: 10.1542/peds.2020-018903
Neighborhood Child Opportunity Index and Adolescent Cardiometabolic Risk
Abstract
Background and objectives: The Child Opportunity Index (ChOI) is a publicly available surveillance tool that incorporates traditional and novel attributes of neighborhood conditions that may promote or inhibit healthy child development. The extent to which ChOI relates to individual-level cardiometabolic risk remains unclear.
Methods: We geocoded residential addresses obtained from 743 participants in midchildhood (mean age 7.9 years) in Project Viva, a prebirth cohort from eastern Massachusetts, and linked each location with census tract-level ChOI data. We measured adiposity and cardiometabolic outcomes in midchildhood and early adolescence (mean age 13.1 years) and analyzed their associations with neighborhood-level ChOI in midchildhood using mixed-effects models, adjusting for individual and family sociodemographics.
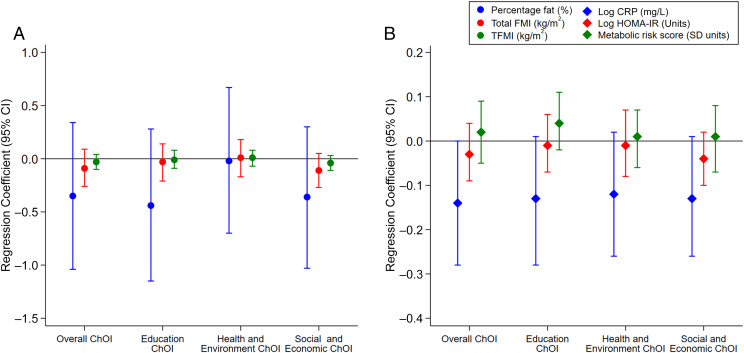
Results: On the basis of nationwide distributions of ChOI, 11.2% (n = 83) of children resided in areas of very low overall opportunity (ChOI score <20 U) and 55.3% (n = 411) resided in areas of very high (ChOI score ≥80 U) overall opportunity. Children who resided in areas with higher overall opportunity in midchildhood had persistently lower levels of C-reactive protein from midchildhood to early adolescence (per 25-U increase in ChOI score: β = .14 mg/L; 95% confidence interval, .28 to .00). Additionally, certain ChOI indicators, such as greater number of high-quality childhood education centers, greater access to healthy food, and greater proximity to employment in midchildhood, were associated with persistently lower adiposity, C-reactive protein levels, insulin resistance, and metabolic risk z scores from midchildhood to early adolescence.
Conclusions: Our findings suggest more favorable neighborhood opportunities in midchildhood predict better cardiometabolic health from midchildhood to early adolescence.
Copyright © 2021 by the American Academy of Pediatrics.
Conflict of interest statement
POTENTIAL CONFLICT OF INTEREST: The authors have indicated they have no potential conflicts of interest to disclose.
Figures


References
-
- Buka SL, Brennan RT, Rich-Edwards JW, Raudenbush SW, Earls F. Neighborhood support and the birth weight of urban infants. Am J Epidemiol. 2003;157(1):1–8 - PubMed
-
- Caughy MO, Nettles SM, O’Campo PJ. The effect of residential neighborhood on child behavior problems in first grade. Am J Community Psychol. 2008;42(1–2):39–50 - PubMed
-
- Sellström E, Bremberg S. The significance of neighbourhood context to child and adolescent health and well-being: a systematic review of multilevel studies. Scand J Public Health. 2006;34(5):544–554 - PubMed
-
- Christian H, Zubrick SR, Foster S, et al. . The influence of the neighborhood physical environment on early child health and development: a review and call for research. Health Place. 2015;33:25–36 - PubMed
-
- Krieger N. Epidemiology and the web of causation: has anyone seen the spider? Soc Sci Med. 1994;39(7):887–903 - PubMed
Publication types
MeSH terms
Grants and funding
LinkOut - more resources
Full Text Sources
Other Literature Sources
Medical
Research Materials
