. 2021 Feb 9;118(6):e2018587118.
doi: 10.1073/pnas.2018587118.

Major alterations in the mononuclear phagocyte landscape associated with COVID-19 severity

Collaborators, Affiliations

Major alterations in the mononuclear phagocyte landscape associated with COVID-19 severity

Egle Kvedaraite et al. Proc Natl Acad Sci U S A. .

Abstract

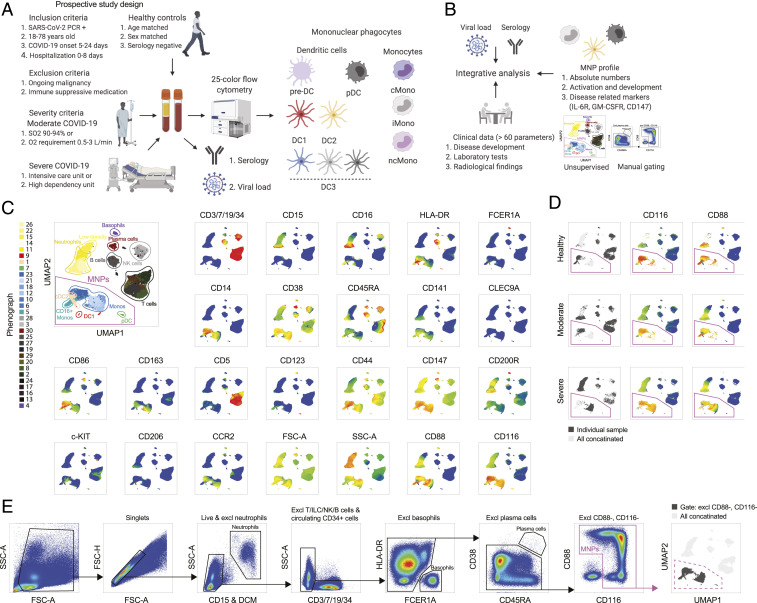
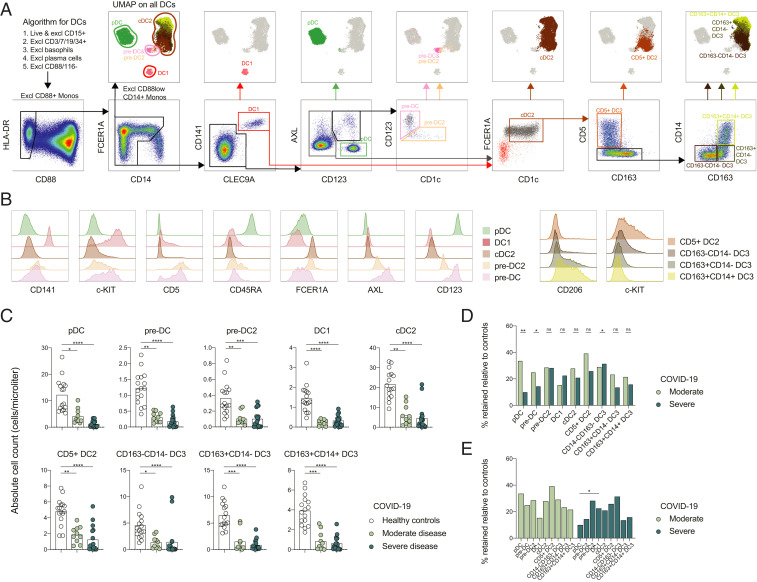
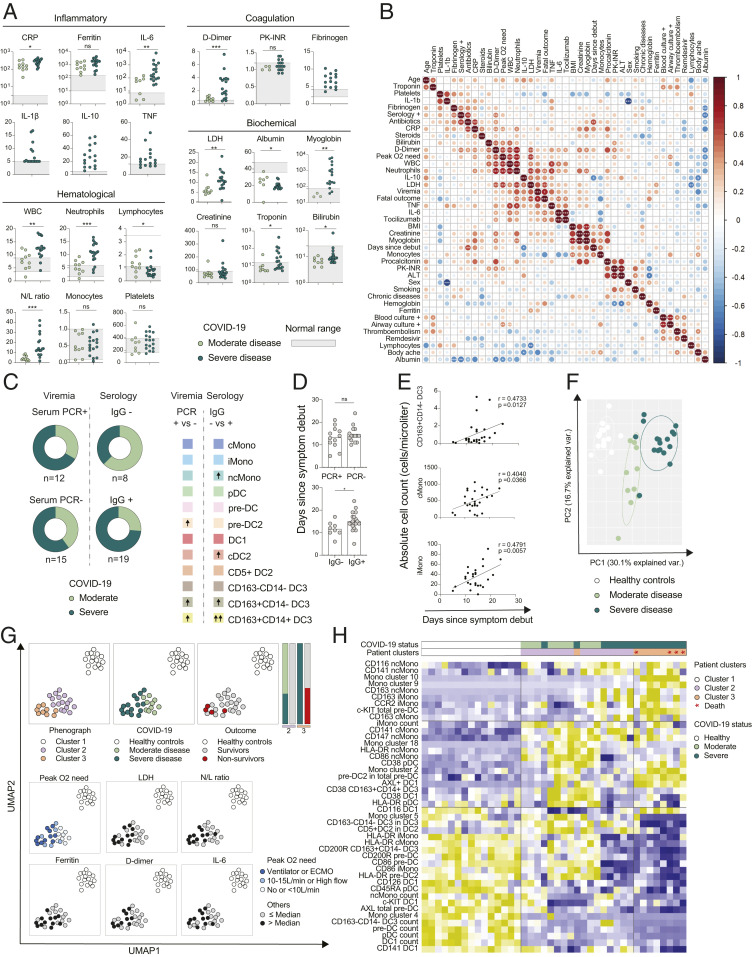
Dendritic cells (DCs) and monocytes are crucial mediators of innate and adaptive immune responses during viral infection, but misdirected responses by these cells may contribute to immunopathology. Here, we performed high-dimensional flow cytometry-analysis focusing on mononuclear phagocyte (MNP) lineages in SARS-CoV-2-infected patients with moderate and severe COVID-19. We provide a deep and comprehensive map of the MNP landscape in COVID-19. A redistribution of monocyte subsets toward intermediate monocytes and a general decrease in circulating DCs was observed in response to infection. Severe disease coincided with the appearance of monocytic myeloid-derived suppressor cell-like cells and a higher frequency of pre-DC2. Furthermore, phenotypic alterations in MNPs, and their late precursors, were cell-lineage-specific and associated either with the general response against SARS-CoV-2 or COVID-19 severity. This included an interferon-imprint in DC1s observed in all patients and a decreased expression of the coinhibitory molecule CD200R in pre-DCs, DC2s, and DC3 subsets of severely sick patients. Finally, unsupervised analysis revealed that the MNP profile, alone, pointed to a cluster of COVID-19 nonsurvivors. This study provides a reference for the MNP response to SARS-CoV-2 infection and unravels mononuclear phagocyte dysregulations associated with severe COVID-19.

Keywords: COVID-19; DCs; monocytes; pre-DCs.


Conflict of interest statement

The authors declare no competing interest.

Figures

Fig. 1.
Fig. 1.
Clinical and experimental study design and analytical pipeline. (A) Experimental design. (B) Analytical pipeline. (C) Flow cytometry data in a UMAP plot with color-coded Phenograph clusters with cell identities established based on the displayed markers; 500,000 live cells from one representative individual from each group (healthy, moderate, severe) are shown after concatenation. (D) Representative individual from each cohort presented in a UMAP; CD116 and CD88 expression highlighted. (E) Gating strategy to identify MNPs, after exclusion steps detected in the gate defined as CD88+ and/or CD116+ (i.e., excluding CD88, CD116 cells), and finally projected back to the UMAP.
Fig. 2.
Fig. 2.
Circulating cDCs, their progenitors, and pDCs decline in numbers in COVID-19 irrespective of disease severity. (A) DC gating strategy (Lower) projected to the UMAP (Upper) in all concatenated samples. (B) Key marker expression in the DCs presented across the identified DC subsets. (C) Absolute DC numbers in healthy controls, and moderate and severe COVID-19 patients. (D) Absolute DC numbers, each patient related to the mean of the controls as percentage of maintained cells and compared in moderate vs. severe patients for each DC population. (E) Percentage of maintained cells, calculated as described in D, compared among DC subsets in moderate and severe patients separately. Statistical evaluation using a Kruskal–Wallis test and Dunn’s multiple comparisons test (C), Mann–Whitney U test (D), and Friedman test (E). P values: *P < 0.05, **P < 0.01, ***P < 0.001, ****P < 0.0001; ns, not significant.
Fig. 3.
Fig. 3.
Altered activation and developmental phenotype of DCs in COVID-19. (A) All DCs from patients and controls concatenated in a UMAP, as described in Fig. 2A, with color-coded Phenograph clusters and manual DC gates; cell identity was established based on marker expression. (B) DC1s gated in a UMAP and subjected to analysis of percentage of AXL+ cells, representative healthy control and severe COVID-19 patient shown in a FACS plot. (C) Quantification of the percentage of AXL+ DC1s in the three cohorts. (D) MFI of c-KIT quantified in total DC1s, gated in DC UMAP as shown in B. (E) IPA of DEGs up-regulated in DC1s in BAL of severe COVID-19 patients compared to healthy controls; arrow indicate direction of up-regulation based on z-score; data reanalyzed from previously published report (22), as described in Material and Methods. (F) pDCs gated in a UMAP for downstream analysis. (G) MFI of CD123 and CD45RA quantified in total pDCs in the three cohorts. (H) IPA of DEGs up-regulated in pDCs in severe patients compared to moderate COVID-19; arrows indicate direction of up-regulation based on z-score; data reanalyzed from previously published report (22), as described in Material and Methods. (I) Genes in pDCs differentially expressed between severe and moderate COVID-19 patients, presented in the three cohorts; data reanalyzed from previously published report (22), as described in Material and Methods. (J) cDC2s gated in a UMAP for downstream analysis. (K) Quantification of the percentage of CD5+ DC2 among total cDC2s in the three cohorts. (L) Quantification of the percentage of the three DC3 subsets among total DC3s (as presented in Fig. 2A). DC3 subsets were defined from the cDC2 gate in J in the three cohorts. (M) Total pre-DCs gated in a UMAP subdivided in pre-DCs and pre-DC2s. (N) Quantification percentage of pre-DC2 in total pre-DCs. (O) MFI of AXL and c-KIT in total pre-DCs in the three cohorts. (P) Correlation between AXL MFI in pre-DCs and soluble FLT3L. (Q) Heatmap showing marker expression in the three cohorts, across the DC subsets, only samples with more than 10 cells included. Statistical evaluation was made separately in each indicated subset by comparing the MFI in the three cohorts; significance for healthy to moderate and healthy to severe comparisons is indicated by an asterisk (*) and for moderate to severe comparison is indicated by a pound sign (#). Statistical evaluation using Spearman test for correlation, Kruskal-Wallis test and Dunn’s multiple comparisons test for all other analysis. Samples with less than 10 cells in any of the DC subsets annotated in Q were excluded from the analyses. Significance level: *P < 0.05, **P < 0.01, ***P < 0.001, ****P < 0.0001; #P < 0.05, ##P < 0.01, ###P < 0.001.
Fig. 4.
Fig. 4.
Major phenotypic alterations within monocytes and monocyte-like cells in COVID-19 patients. (A) Monocyte gating strategy projected together with DCs, gated as described in Fig. 2A, to the MNP UMAP. (B) Key monocyte markers in monocyte subsets, compared to cDC2s, in all concatenated samples. (C) Absolute numbers of monocytes in the three cohorts. (D) Monocyte frequencies in the three cohorts. (E) Heatmap showing marker expression for the three cohorts in the indicated monocyte subsets with cDC2s included as a reference, comparing expression level within each cell population individually. Statistical evaluation was made separately in each indicated subset by comparing the MFI in the three cohorts; significance for healthy to moderate and healthy to severe comparisons are indicated by an asterisk (*) and for moderate to severe comparison by a pound sign (#). (F) MNPs from patients and controls concatenated in a UMAP with color-coded manually gated cell subsets (Left), rerun on monocytes presented in a UMAP with color-coded Phenograph clusters (Right). (G) Color-coded manual gates (Upper) and indicated Phenograph clusters (Lower) in monocyte UMAP of concatenated samples. (H) Expression of markers in selected significantly differential Phenograph clusters among the three cohorts (see also SI Appendix, Fig. S2). (I) Heatmap of correlation between Phenograph clusters 1 to 18 and levels of soluble factors in serum, a gradient between yellow and blue indicates positive (yellow) and negative (blue) correlation. (J) Correlation between soluble serum AREG and percentage of Phenograph clusters 9 and 10 in total monocytes. (K) MDSC signature genes, calculated by comparing MDSC with monocytes in a previous report (34), in lung MNP compartment differentially expressed between severe COVID-19 patients and controls, presented in the three cohorts; data reanalyzed from previously published report (22), as described in Material and Methods. Statistical evaluation using Kruskal–Wallis test and Dunn’s multiple comparisons test for comparison between the three cohorts and Spearman test for correlations, “bimod” test for DEGs. Significance level: *P < 0.05, **P < 0.01, ***P < 0.001, ****P < 0.0001; #P < 0.05, ##P < 0.01, ###P < 0.001.
Fig. 5.
Fig. 5.
Clinical hyperinflammation, the MNP landscape, and COVID-19 outcome. (A) Levels of clinical analytes in moderate and severe COVID-19 patients, reference levels indicated as a gray shaded area; CRP, D-dimer in milligrams per liter; procalcitonin, ferritin, myoglobin in micrograms per liter; hemoglobin, albumin in grams per liter; WBC, neutrophils, lymphocytes, monocytes, platelets as 109/L; troponin in nanograms per liter; fibrinogen in grams per liter; creatinine, bilirubin in micromoles per liter; LDH in units per liter; IL-6, IL-1β, TNF, IL-10 in nanograms per liter. (B) Integrated correlation clustering map of clinical parameters; the color of the circles indicated positive (red) and negative (blue) correlations, color intensity represented correlation strength as measured by the Pearson’s correlation coefficient. (C) Distribution of moderate and severe COVID-19 patients with respect to viremia (SARS-CoV-2 PCR+/−, measured at sampling) and serology (SARS-CoV-2 IgG−/+, measured at sampling) shown in donut charts (Left); differences in absolute numbers of MNP populations between SARS-CoV-2 PCR+ and SARS-CoV-2 PCR patients, and between SARS-CoV-2 IgG and SARS-CoV-2 IgG+ patients (Right), upward arrows indicate significant increase (SI Appendix, Fig. S3B). (D) Differences in days since symptom debut until sample collection in SARS-CoV-2 PCR+/− and SARS-CoV-2 IgG−/+ patients. (E) Correlation between days since symptom debut until the sample collection and absolute numbers of cells within MNP populations (SI Appendix, Fig. S3C). (F) PCA of 108 MNP parameters in the three cohorts (SI Appendix, Fig. S3D). (G) Dimensionality reduction of 108 MNP parameters for each patient or control presented in UMAP color-coded annotated by Phenograph clusters, disease status, and outcome (above dashed line), as well as levels of clinical parameters; that is, peak O2 need, LDH, neutrophil/lymphocyte (N/L) ratio, D-dimer, ferritin, and IL-6, converted to categorical variables based on a median value (below dashed line). (H) Hierarchical clustering of patients from the three Phenograph clusters and 44 selected preclinical parameters. Statistical evaluation using Mann–Whitney U for comparison between the two groups, Spearman test for correlations of nonnormally distributed data and Pearson test for correlations normally distributed data. Significance level: *P < 0.05, **P < 0.01, ***P < 0.001.
Fig. 6.
Fig. 6.
Summary of MNP response to SARS-CoV-2 and in relation to COVID-19 severity. Monocytes (Left) and dendritic cells (Right), respond to SARS-CoV-2 (Upper) with decreased circulating levels of all DC subsets, but higher CD5+ DC2 frequency, activated phenotype (up-regulation of ecto-enzyme CD38, expansion of CD14+CD16+ iMonos, decrease of CD14lowCD16++ ncMonos, and lower CD45RA levels on pDCs), and features pointing to viral sensing and type I IFN imprint found in DC1s (e.g., lower levels of c-KIT, expansion of AXL+DC1s). Severe COVID-19 (Lower) is associated with altered developmental DC phenotype (e.g., increased frequencies of late pre-DC2 progenitors and increased stem cell marker c-KIT expression in pre-DCs, as well as immature phenotype on all DC subsets with lower HLA-DR and CD86), expansion of Mo-MDSC–like cells and decrease in inhibitory receptor CD200R, specific to cDC2 lineage. Arrows in red boxes indicate changes in counts and frequencies of cell populations. Arrows in green areas illustrate altered expression of receptors within indicated populations.

References

    1. Mehta P.et al. .; HLH Across Speciality Collaboration, UK , COVID-19: Consider cytokine storm syndromes and immunosuppression. Lancet 395, 1033–1034 (2020). - PMC - PubMed
    1. Huang C., et al. ., Clinical features of patients infected with 2019 novel coronavirus in Wuhan, China. Lancet 395, 497–506 (2020). - PMC - PubMed
    1. Guilliams M., et al. ., Dendritic cells, monocytes and macrophages: A unified nomenclature based on ontogeny. Nat. Rev. Immunol. 14, 571–578 (2014). - PMC - PubMed
    1. Rescigno M., Dendritic cell functions: Learning from microbial evasion strategies. Semin. Immunol. 27, 119–124 (2015). - PubMed
    1. Wong K. L., et al. ., Gene expression profiling reveals the defining features of the classical, intermediate, and nonclassical human monocyte subsets. Blood 118, e16–e31 (2011). - PubMed

Publication types