. 2021 Jan 21;12(1):497.
doi: 10.1038/s41467-020-20810-z.

Universal toxin-based selection for precise genome engineering in human cells

Affiliations

Universal toxin-based selection for precise genome engineering in human cells

Songyuan Li et al. Nat Commun. .

Erratum in

Abstract

Prokaryotic restriction enzymes, recombinases and Cas proteins are powerful DNA engineering and genome editing tools. However, in many primary cell types, the efficiency of genome editing remains low, impeding the development of gene- and cell-based therapeutic applications. A safe strategy for robust and efficient enrichment of precisely genetically engineered cells is urgently required. Here, we screen for mutations in the receptor for Diphtheria Toxin (DT) which protect human cells from DT. Selection for cells with an edited DT receptor variant enriches for simultaneously introduced, precisely targeted gene modifications at a second independent locus, such as nucleotide substitutions and DNA insertions. Our method enables the rapid generation of a homogenous cell population with bi-allelic integration of a DNA cassette at the selection locus, without clonal isolation. Toxin-based selection works in both cancer-transformed and non-transformed cells, including human induced pluripotent stem cells and human primary T-lymphocytes, as well as it is applicable also in vivo, in mice with humanized liver. This work represents a flexible, precise, and efficient selection strategy to engineer cells using CRISPR-Cas and base editing systems.


Conflict of interest statement

S.L., N.A., S.C., M.P,. S.W., A.L., C.M., M.F., E.G., B.L., A.S., L.S.P., M.A.C., G.P., M.S., M.B.-Y., B.J.T., G.S., and M.M. are employees and shareholders of AstraZeneca. M.M. and S.L. are listed as co-inventors in a Astrazeneca patent application (application number: EP2020060250W) related to this work. The other authors claim no competing interests.

Figures

Fig. 1
Fig. 1. Base editing at the HBEGF locus induces resistance to diphtheria toxin.
a Schematic of our toxin-based selection scheme. b sgRNA sites targeted by CBE3 or ABE7.10, and used to screen for mutations in HBEGF that elicit resistance to DT. cDNA is the DNA sequence of the EGF-like domain of human HBEGF; hHBEGF is the corresponding amino acid sequence; mHBEGF is the aligned amino acid sequence of the mouse HBEGF homolog. Matching amino acids in mHBEGF are shown by a dot; unmatched amino acids are annotated. sgRNAs highlighted in red and blue were chosen to introduce DT-resistant mutations with CBE3 and ABE7.10, respectively. c Heatmap presenting the viability of HEK293 cells after DT selection for the depicted combination of base editors and sgRNAs. d Frequency of alleles in DT-resistant cells after CBE or ABE editing. The values in c and d represent an average of three independent biological replicates. CBE, cytidine base editor, ABE adenosine base editor.
Fig. 2
Fig. 2. Co-selection of base editing- and Cas9 nuclease-mediated genome modifications.
a Schematic of experimental design. b Bar graph of co-selected cytidine base editing events at the HBEGF locus and another locus, with or without DT selection, showing C–T conversion (%). c Bar graph of co-selected adenosine base editing events with or without DT selection, showing A–G conversion (%). d Bar graph of co-selected SpCas9-mediated genome editing events. In all graphs, the values and error bars reflect mean ± s.d. of n = 3 independent biological replicates. Relative fold changes between DT-selected and nonselected cells are indicated in the graphs. *P < 0.05, **P < 0.01, ***P < 0.001, Student’s paired t test (two-tailed). P values are calculated as below: in b, DPM2 (C4 = 0.0070, C6 = 0.0063, C7 = 0.0061, and C8 = 0.0061), EGFR (C3 = 0.0506, C5 = 0.0053, and C7 = 0.0184), EMX1 (C5 = 0.0031 and C6 = 0.0004), PSCK9 (C7 = 0.0028 and C8 = 0.0092), and DPM2 (C5 = 0.0038 and C8 = 0.0088); in c, CTLA4 (A6 = 0.0691), EMX1 (A8 = 0.3119), AAVS1.1 (A4 = 0.0091, A6 = 0.0090, A7 = 0.0090, and A8 = 0.1044), AAVS1.2 (A4 = 0.0072, A5 = 0.0107, and A7 = 0.0027), and IL2RA (A5 = 0.0006 and A8 = 0.0009); in d, DPM2 (0.0005), EMX1 (0.0016), PCSK9 (0.0002), and DNMT3B (0.0085). Source data of Fig. 2b–d are provided as a Source data file.
Fig. 3
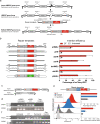
Fig. 3. Enrichment of DNA knock-in at the HBEGF locus.
a Schematic of the knock-in enrichment strategy. b The knock-in of various templates (left) and their corresponding efficiencies (right). The mCherry/GFP percentage of each sample was analyzed by flow cytometry with (DT) or without (untreated) DT selection. Repair templates were designed to be incorporated into the targeted site through homology-mediated end joining (pHMEJ and dsHMEJ), homologous recombination (pHR, dsHR, ssHR, and dsHR2), or nonhomologous end joining (pNHEJ). These templates were provided as plasmids (pHMEJ, pHR, or pNHEJ), double-stranded DNA (dsHR, dsHMEJ, and dsHR2), or single-stranded DNA (ssHR). c Schematic of the genotyping strategy. The PCR1 primer pair detect the insertion; PCR2 detects wild-type cells in the population. d PCR analysis of cell populations obtained from experiment (b), representative results were shown from three independent biological replicates. e Comparison of puromycin and DT-enriched knock-in populations. Upper panel: the repair template consists of a puromycin resistant gene and a mCherry gene linked to the mutated HBEGF gene. The lower left panel shows the representative mCherry histogram of edited HEK293 cell populations without or with different treatments. Neg control represents cells transfected with control sgRNA (no target loci), instead of sgRNAin3. Cells were analyzed by flow cytometry. The lower right panels show corresponding knock-in efficiencies and mean fluorescence intensities of each population. f PCR analysis of each population of cells obtained from experiment (e), representative results were shown from three independent biological replicates. The presented values and error bars reflect mean ± s.d. of n = 2 or 3 independent biological replicates. GOI gene of interest, T2A T2A self-cleaving peptide, SA splicing acceptor, HA homology arm, pA polyA sequence. Source data of Fig. 3b, d, e, f are provided as a Source data file.
Fig. 4
Fig. 4. Xential enables co-selection of knock-out and knock-in editing.
a Strategy for co-selecting knock-out events with precise knock-in at the HBEGF locus. b Co-selection of SpCas9 indels in HEK293 cells. Cells were co-transfected with SpCas9, sgRNAin3, the pHMEJ repair template for HBEGF locus, and a sgRNA targeting a second genomic locus. Cells were cultivated with (DT) or without DT (Untreated) from 72 h after transfection until confluent. Genomic DNA were extracted from harvested cells and analyzed by NGS. c Strategy of co-selecting knock-in events with precise knock-in at the HBEGF locus. d Co-selection of knock-in events at a second locus, HIST1H2BC, in HEK293 cells. Cells were co-transfected with SpCas9, sgRNAs, and repair templates for both HBEGF and HIST1H2BC locus; cultivated with (DT) or without (Untreated) DT; analyzed by flow cytometry. Both pHR and pHMEJ templates were used. Ratios of the amount of sgRNA and template for HBEGF locus to that for HIST1H2BC locus are indicated below. N/A indicates no corresponding component was used. Values and error bars reflect mean ± s.d. of n = 3 independent biological replicates. Relative fold changes between untreated and DT-treated samples are indicated in the graphs. *P < 0.05, **P < 0.01, ***P < 0.001, Student’s paired t test (two-tailed). P values are calculated as below: in b, DPM2 (0.0595), EMX1 (0.0003), PCSK9 (0.0228), and DNMT3B (0.0043); in d, P values from left to right are 0.1534, 0.0181, 0.0089, and 0.0128, respectively. Source data of Fig. 4b, d are provided as a Source data file.
Fig. 5
Fig. 5. Enrichment of genome editing events in human iPSCs.
a Schema of the experiment timeline. b, c Co-selection of CBE (b) and ABE (c) editing events in the genome of hiPSCs cultured with or without DT. Analysis of NGS reads showing containing b C–T conversions or c A–G conversions as a percentage of full-length reads from indicated loci using depicted sgRNAs. d Enrichment of knock-in events at HBEGF locus with Xential. The left panel shows the mCherry signal in the flow cytometry scatter plots for non-enriched and DT-enriched samples, and the right panel shows the quantitative frequencies of mCherry-positive cells. e PCR analysis of genomic DNA from hiPSCs after Xential. Genotyping at HBEGF intron 3 (see Fig. 3d). Representative results were shown from three independent biological replicates. fg The HSV-TK gene inserted in the HBEGF locus using Xential renders hiPSCs sensitive to gancivlovir. Crystal violet staining assay (f) and CellTiter-Glo assay (g) showing viability of cells containing either the mCherry or the HSV-TK gene inserted in the HBEGF locus. Cells were treated with depicted concentration of ganciclovir or DMSO (control) for 3 days followed by a 3-day recovery without the drug. Values and error bars reflect mean ± s.d. of n = 3 independent biological replicates. Relative fold changes are indicated in the graphs. *P < 0.05, **P < 0.01, ***P < 0.001, Student’s paired t test (two-tailed). P values are calculated as below: in b, CTLA4 (C4 = 0.0179 and C5 = 0.0007) and EMX1 (C5 = 0.0010 and C6 = 0.0006); in c, CTLA4 (0.0154) and EMX1 (0.1146). Source data of Fig. 5b–e, g are provided as a Source data file.
Fig. 6
Fig. 6. Co-selection of CBE editing events in human primary T cells using DT selection.
a Schema of the experimental setup. Total primary CD4+ T cells isolated from human blood, electroporated with CBE3 proteins, synthetic sgRNA10, and a synthetic sgRNA targeting a second genomic locus. The cells were cultivated with or without DT (untreated). b Analysis of NGS reads shown containing C–T conversion as a percentage of full-length reads in Amplicon-seq at indicated loci using depicted sgRNAs. The presented values and error bars show mean ± s.d. of n = 3 independent biological replicates. Relative fold changes are indicated in the graphs. *P < 0.05, **P < 0.01, ***P < 0.001, Student’s paired t test (two-tailed). P values are calculated as below: in b, PDCD1 (C7 = 0.0040 and C5 = 0.0075), CTLA4 (C4 = 0.0955 and C6 = 0.0459), and IL2RA (C7 = 0.0071). Source data of Fig. 6b are provided as a Source data file.
Fig. 7
Fig. 7. Co-selection of base editing events in vivo in mice with humanized liver.
a Design of an in vivo co-selection experiment. Adenovirus was used to introduce CBE3, sgRNA10, and a sgRNA targeting Pcsk9. After 2 weeks, mice were dosed with DT and terminated at 24 h or 4–11 days. At termination, liver tissue was collected for genomic DNA extraction and analysis by NGS. Icons of mice and syringes were created in a previous publication, and were used without modification under Creative Commons Attribution 4.0 International License (http://creativecommons.org/licenses/by/4.0/). b Enrichment of CBE editing at the HBEGF locus. c Co-selection of the CBE editing events at the Pcsk9 locus. The presented values and error bars present mean ± s.d. of n = 6 independent biological replicates. The relative fold change values are indicated in the graphs. *P < 0.05, **P < 0.01, Student’s paired t test (two-tailed). P values are calculated as below: in b, HBEGF (C4 = 0.0007, C6 = 0.0022, and C8 = 0.0017); in c, Pcsk9 (C4 = 0.0100 and C6 = 0.0099). Source data of Fig. 7b, c are provided as a Source data file.

Similar articles

Cited by

References

    1. Dunbar CE, et al. Gene therapy comes of age. Science. 2018;359:eaan4672. - PubMed
    1. June CH, O’Connor RS, Kawalekar OU, Ghassemi S, Milone MC. CAR T cell immunotherapy for human cancer. Science. 2018;359:1361–1365. - PubMed
    1. Labanieh L, Majzner RG, Mackall CL. Programming CAR-T cells to kill cancer. Nat. Biomed. Eng. 2018;2:377–391. - PubMed
    1. Xin Yu,J, Hubbard-Lucey VM, Tang J. The global pipeline of cell therapies for cancer. Nat. Rev. Drug Discov. 2019;18:821–822. - PubMed
    1. Rees HA, Liu DR. Base editing: precision chemistry on the genome and transcriptome of living cells. Nat. Rev. Genet. 2018;19:770–788. - PMC - PubMed

Publication types

Substances