. 2021 Jan 21;11(1):1981.
doi: 10.1038/s41598-021-81419-w.

Autumn COVID-19 surge dates in Europe correlated to latitudes, not to temperature-humidity, pointing to vitamin D as contributing factor

Affiliations

Autumn COVID-19 surge dates in Europe correlated to latitudes, not to temperature-humidity, pointing to vitamin D as contributing factor

Stephan Walrand. Sci Rep. .

Abstract

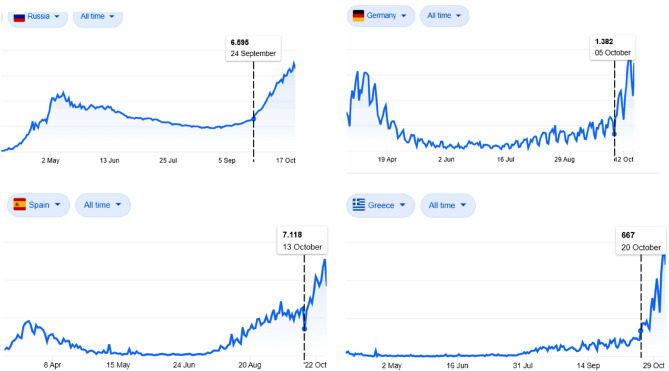
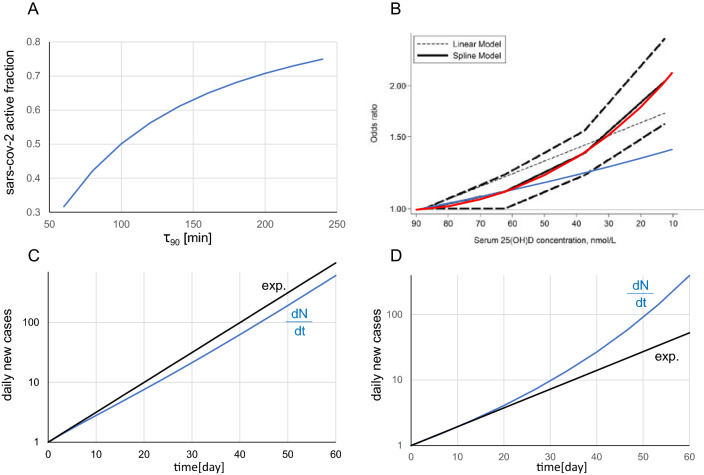
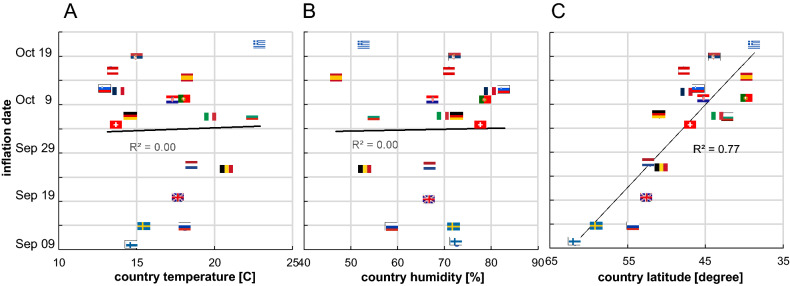
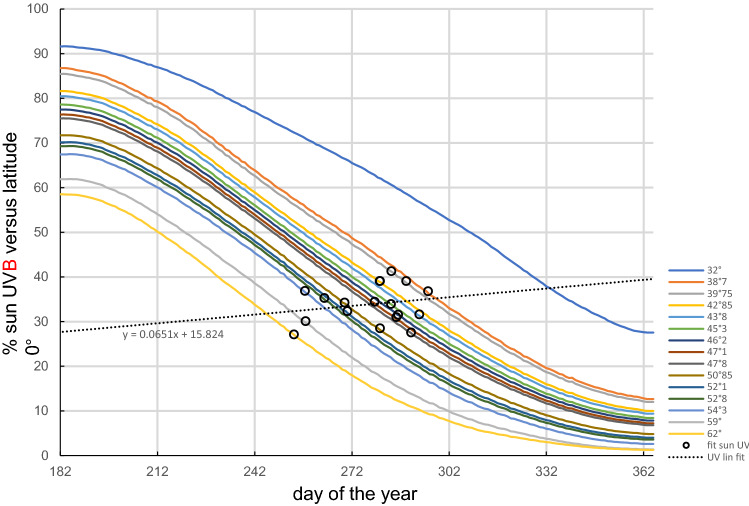
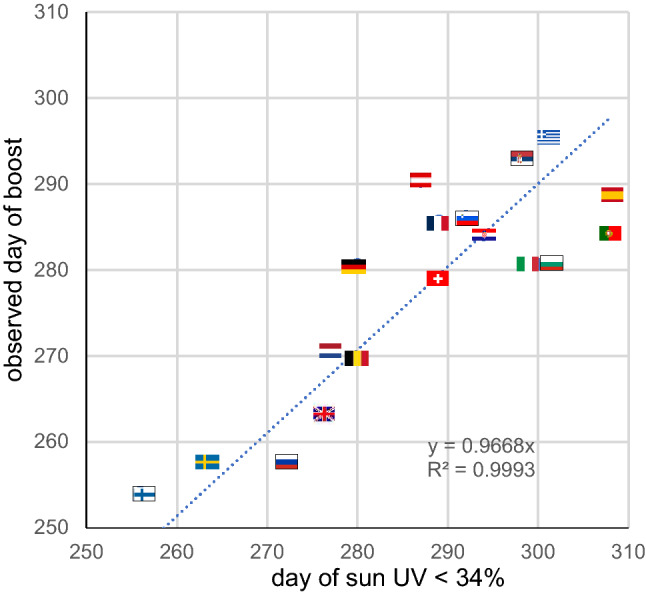
To determine the factor triggering the sudden surge of daily new COVID-19 cases arising in most European countries during the autumn of 2020. The dates of the surge were determined using a fitting of the two last months of reported daily new cases in 18 European countries with latitude ranging from 39° to 62°. The study proves no correlation between the country surge date and the 2 weeks preceding temperature or humidity but shows an impressive linear correlation with latitude. The country surge date corresponds to the time when its sun UV daily dose drops below ≈ 34% of that of 0° latitude. Introducing reported seasonal blood 25-hydroxyvitamin D (25(OH)D) concentration variation into the reported link between acute respiratory tract infection risk and 25(OH)D concentration quantitatively explains the surge dynamics. Several studies have already substantiated a 25(OH)D concentration impact on COVID-19 severity. However, by comparing different patient populations, discriminating whether a low 25(OH)D concentration is a real factor underlying COVID-19 severity or only a marker of another weakness that is the primary severity factor can be challenging. The date of the surge is an intrapopulation observation and has the benefit of being triggered only by a parameter globally affecting the population, i.e. decreases in the sun UV daily dose. The results indicate that a low 25(OH)D concentration is a contributing factor to COVID-19 severity, which, combined with previous studies, provides a convincing set of evidence.


Conflict of interest statement

The author declares no competing interests.

Figures

Figure 1
Figure 1
Typical examples of daily new COVID-19 cases (extracted from the statistics panel of the Google home page when searching “COVID” at www.google.com, last accessed 8th November 2020). All curves exhibit a clear surge in the growth rates.
Figure 2
Figure 2
(A) Survival of the active SARS-CoV-2 fraction after 30 min of solar UV insolation as a function of τ90. (B) Solid black line: acute respiratory track infection (ARTI) risk during cold and influenza epidemics as a function of the 25(OH)D concentration (reprinted from according to the  CC BY 4.0 licence terms (https://creativecommons.org/licenses/by/4.0/); red and blue curves: power exponential (Eq. 8) and first point monoexponential fits added by the present author. In both graphs, the corresponding date runs from left to right. (C,D) Blue curve: corresponding new daily cases to (A,B) obtained by numerically integrating Eq. (4) (see excel file). In both integrations, k0 was fitted to obtain a typical threefold increase in the last 10 days (see Fig. 1), and ρ was neglected (surge phase). Black curve: mono-exponential curve.
Figure 3
Figure 3
COVID-19 surge date as a function of country mean temperature (A) and humidity (B) during the 2 preceding weeks and as a function of country PWC latitude (C), pointing to vitamin D as one of the primary factors (flags link countries between graphs).
Figure 4
Figure 4
Solid curves: theoretical sun UVB daily dose for vitamin D skin production under a clear sky corresponding to the 18 PWC country latitudes plus the 31° latitude (derived from Fig. 1B in). Black circles: country surge dates positioned on their corresponding latitude curve.
Figure 5
Figure 5
Observed day of the second COVID-19 wave surge as a function of the day when the country sun UVB daily dose drops lower than 34% of that at latitude 0°. Trendline forced to intercept (0,0).

References

    1. Grigalavicius M, Juzeniene A, Baturaite Z, Dahlback A, Moan J. Biologically efficient solar radiation: Vitamin D production and induction of cutaneous malignant melanoma. Dermato-endocrinology. 2013;5:150–158. doi: 10.4161/derm.22941. - DOI - PMC - PubMed
    1. Herman J, Biegel B, Huang L. Inactivation times from 290 to 315 nm UVB in sunlight for SARS coronaviruses CoV and CoV-2 using OMI satellite data for the sunlit Earth. Air Qual. Atmos. Health. 2020;1:1–7. - PMC - PubMed
    1. Pham H, Rahman A, Majidi A, Waterhouse M, Neale RE. Acute respiratory tract infection and 25-hydroxyvitamin D concentration: A systematic review and meta-analysis. Int. J. Environ. Res. Public Health. 2019;16:3020. doi: 10.3390/ijerph16173020. - DOI - PMC - PubMed
    1. Klingberg E, Oleröd G, Konar J, Petzold M, Hammarsten O. Seasonal variations in serum 25-hydroxy vitamin D levels in a Swedish cohort. Endocrine. 2015;49:800–808. doi: 10.1007/s12020-015-0548-3. - DOI - PMC - PubMed
    1. Moosgaard B, et al. Vitamin D status, seasonal variations, parathyroid adenoma weight and bone mineral density in primary hyperparathyroidism. Clin. Endocrinol. 2005;63:506–513. doi: 10.1111/j.1365-2265.2005.02371.x. - DOI - PubMed